Trend analysis, volume analysis, and candlestick patterns are powerful tools that help us understand how price behaves in the stock market. They allow us to take high-profitable trades. In this article, we dive into the most popular topic in technical analysis: chart patterns! We will explore 6 types of chart patterns every trader should know.
What are Chart Patterns?
Chart patterns are formations that appear in price charts and create some type of recognisable shape over time as the candlesticks keep forming. You can identify these patterns by drawing a line connecting common price points, such as the closing prices or the highs or lows during a period. Price action traders seek to identify patterns to anticipate the future price direction of a security.
These patterns are a graphical depiction of the collective market psychology at a given time as they form as a result of the behaviour of the market participants. There are few common chart patterns that appear repeatedly and often lead to similar subsequent price movements. These recurring patterns can form a basis for market analysis and price forecasting.
There are two categories of chart patterns in the market:
- Continuation Patterns – Continuation patterns indicate that an asset’s price trend is likely to continue in the same direction as which it was before the pattern occurred. They form during periods of consolidation.
- Reversal Patterns – Reversal patterns signal a change in the price trend and can be bullish or bearish.
The six most common types of chart patterns are:
1. Bullish and Bearish Rectangle Pattern
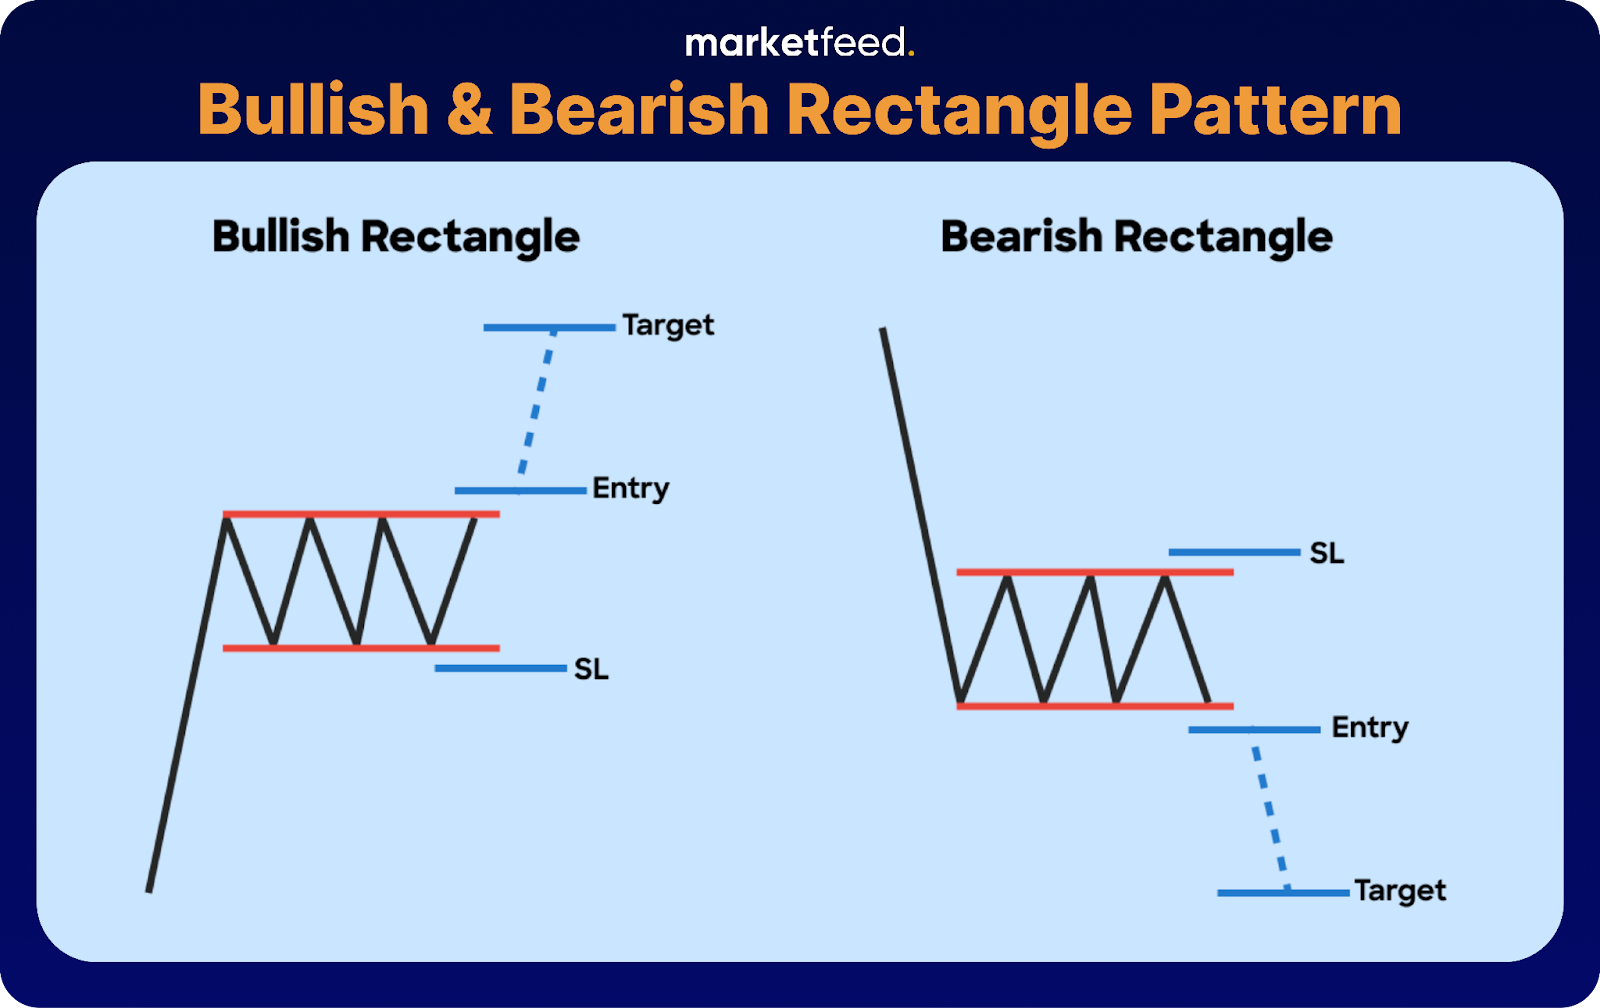
A rectangle pattern usually develops as a continuation pattern and indicates consolidation. However, it can also be a reversal pattern. Two parallel trendlines form this pattern, one connecting the high prices and the other connecting the lows during the period. The trendline on the upper side acts as resistance, and the trendline on the bottom side acts as support.
Bullish Rectangle Pattern
A bullish rectangle pattern forms when the price consolidates in a range and tries to break out of the resistance. The horizontal resistance line that forms the top of the rectangle shows that the investors are repeatedly selling shares at that specific price level, bringing the short bullishness to an end.
If the price breaks out of the resistance, you can consider a long trade with a stop loss (SL) below the support.
Bearish Rectangle Pattern
A bearish rectangle pattern forms when the price consolidates in a range and tries to break down from the support. The horizontal support line formed at the bottom of the rectangle shows that the investors are repeatedly buying shares at that specific price level.
If the price breaks down from the support, you can consider a short trade with an SL above the resistance.
2. Triangle Patterns
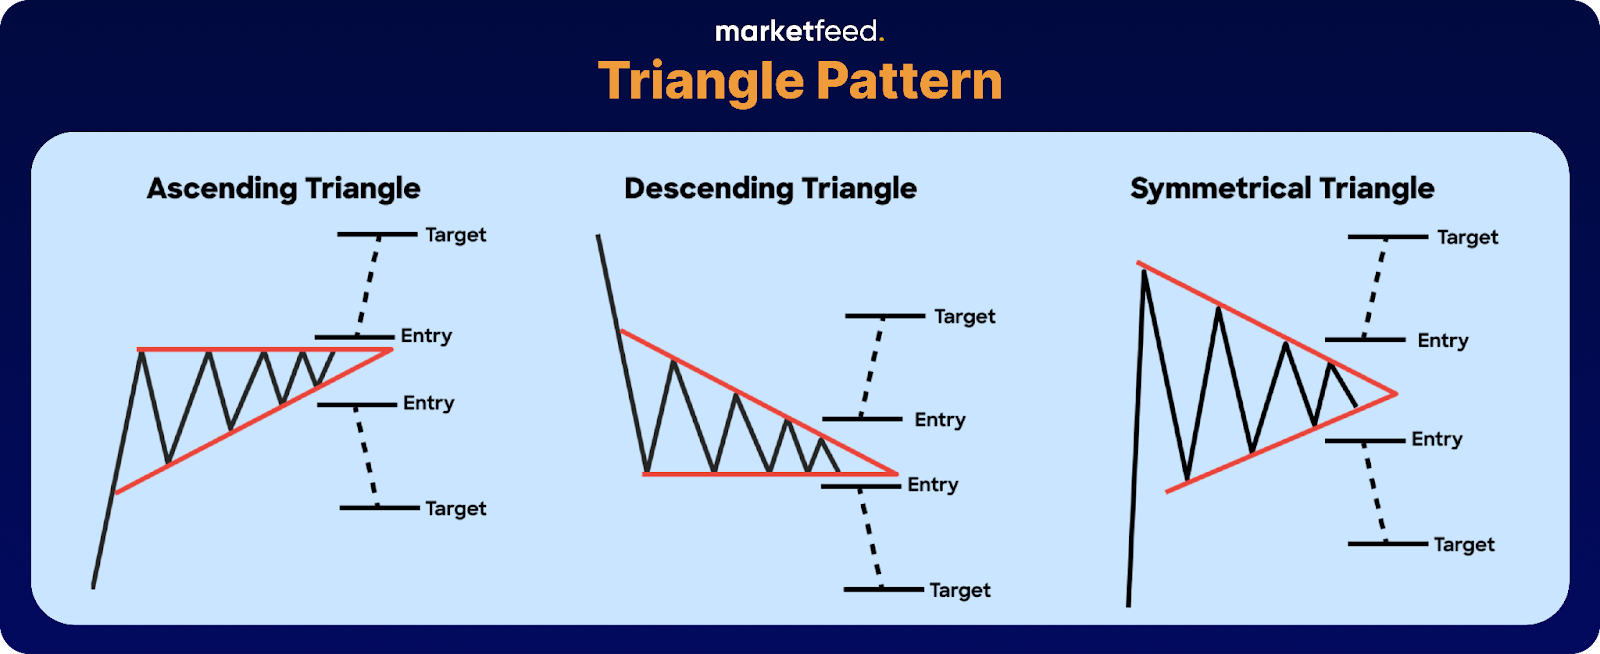
A triangle pattern is a type of continuation pattern. A trendline connecting the highs and another connecting the lows forms this pattern. The upper trendline acts as resistance, and the bottom trendline acts as support. Triangle patterns are of three types:
Ascending Triangle Pattern
An ascending triangle pattern has the same highs and higher lows. The trendline connecting the high prices is horizontal, and the trendline connecting the low prices forms an uptrend.
Descending Triangle Pattern
A descending triangle pattern has the same lows and lower highs. The low prices form a horizontal trendline, and the trendline connecting the high prices forms a downtrend.
Symmetrical Triangle Pattern
A symmetrical triangle pattern has lower highs and higher lows. The trendline formed by the highs slopes down, and the trendline formed by the lows slopes up. Both trendlines slant roughly at the same angle, creating a symmetrical pattern.
- If the price breaks out of the resistance, you can consider a long trade with the SL below the support.
- If the price breaks down from the support, you can consider a short trade with the SL above the resistance.
3. Double Top and Double Bottom
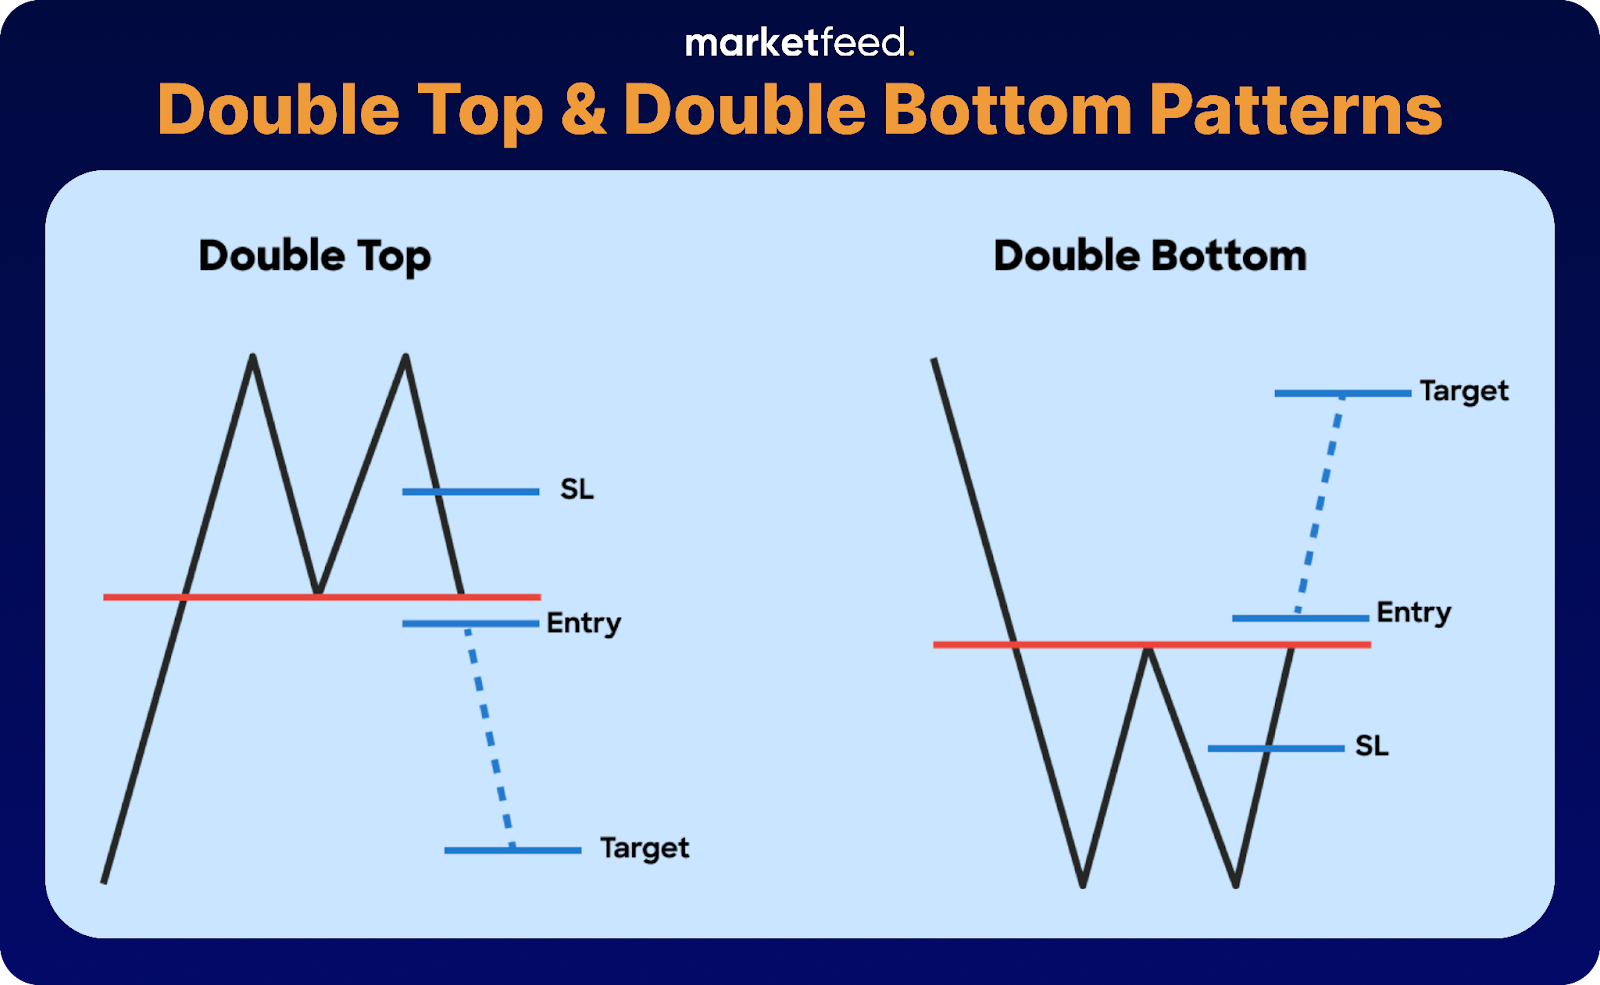
Double Top Pattern
A double-top pattern forms when an uptrend reverses twice at roughly the same high price level. Typically, volume is lower on the second high than on the first, signalling diminishing demand. The neckline for a double top is the horizontal line that touches the low between the two highs.
You can consider a short trade when the price breaks below the neckline, with an SL halfway between the first top and the neckline.
Double Bottom Pattern
A Double bottom pattern forms when the price reaches a low, rebounds, and then declines again to the first low level. The neckline for a double bottom is the horizontal line that touches the minor high between the two troughs.
You can consider a long trade when the price breaks above the neckline, with an SL halfway between the first bottom and the neckline.
4. Head and Shoulder Patterns
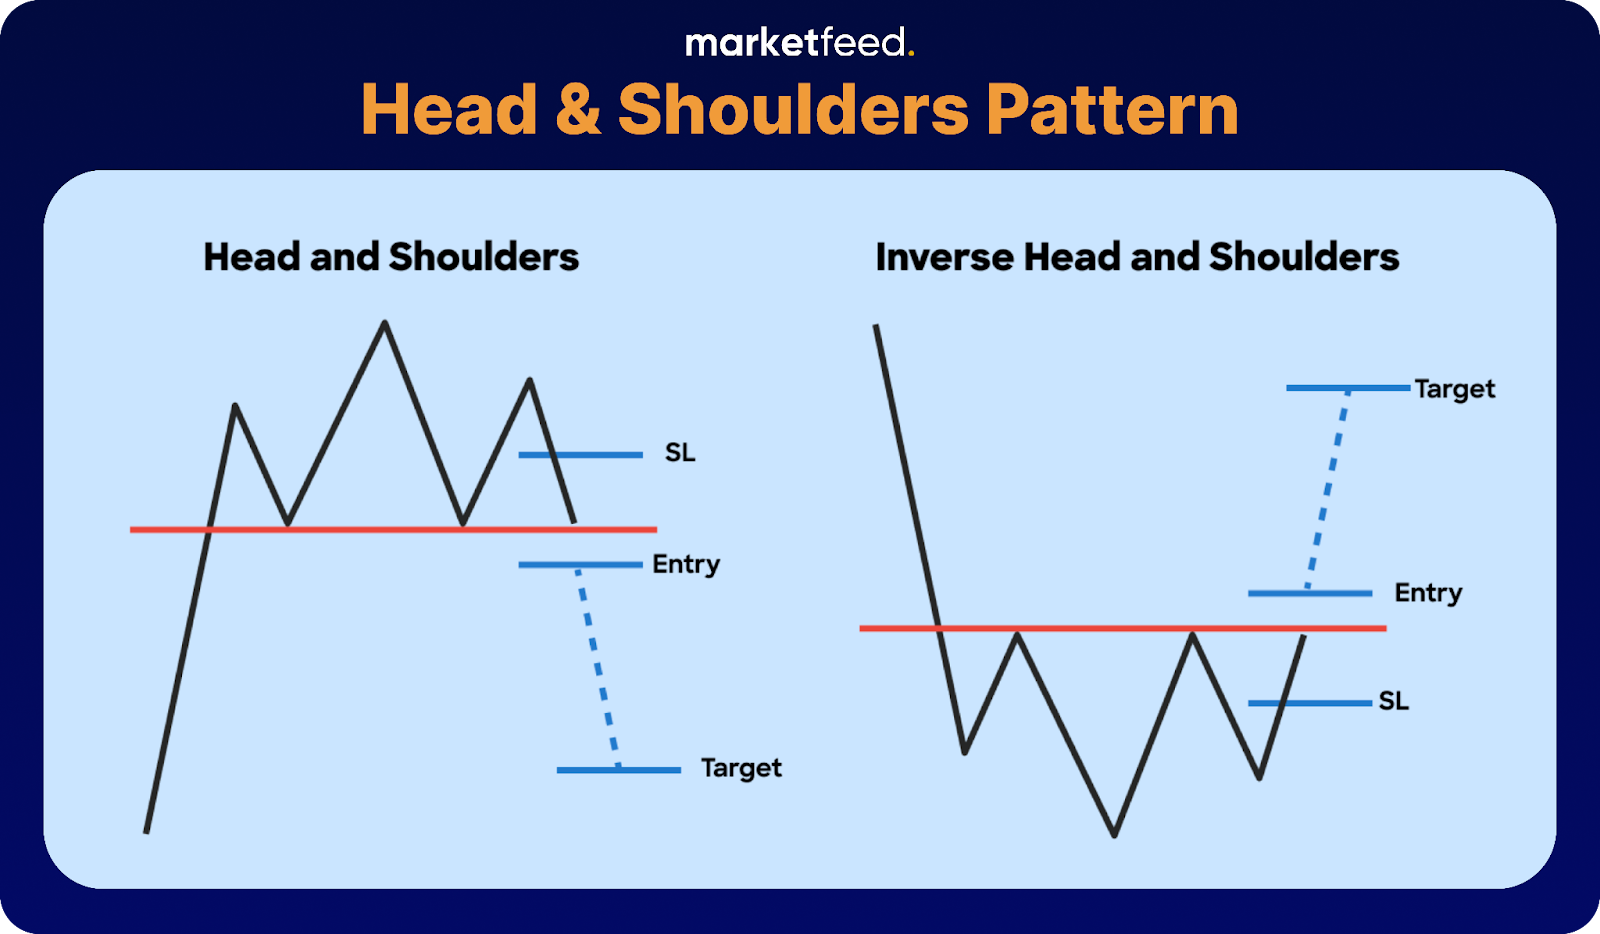
Head and shoulders patterns are reversal patterns and consist of three segments:
- Left Shoulder
- Head
- Right Shoulder
The neckline in this pattern is formed by connecting the beginning of the left shoulder and the end of the right shoulder. It can slope up, down, or be horizontal.
Head and Shoulders Pattern
The Head and Shoulders pattern is a reversal pattern preceded by an uptrend. It is named so because it resembles a human head and shoulders, as the head is at the centre, and the shoulders are at either side.
Volume during the first advance in the left shoulder should ideally be higher than the advance in the head, showing reduced confidence in the bulls. The volume should increase during the fall from the top of the head. Additionally, there should be an increase in volume during the decline from the peak of the right shoulder, indicating a bearish sentiment.
Once the pattern has formed, the market anticipates the price to fall below the neckline.
You can consider a short trade when the price breaks below the neckline with an SL halfway between the top of the right shoulder and the neckline.
Inverse Head and Shoulders Pattern
An inverse head and shoulders pattern is the bullish version of the head and shoulders pattern. It is an upside-down head and shoulders pattern, preceded by a downtrend, and signals a possible reversal.
You can consider a long trade when the price breaks above the neckline with an SL halfway between the bottom of the right shoulder and the neckline.
5. Flag Continuation Pattern

A flag continuation or a pennant pattern is formed by downward-slopping parallel trendlines. It is typically a short-term pattern. The market expects the price to continue the trend that it was before the pattern formation.
You can consider a long trade when the price breaks above the resistance line with an SL at the centre of the parallel channel.
6. Cup and Handle Pattern
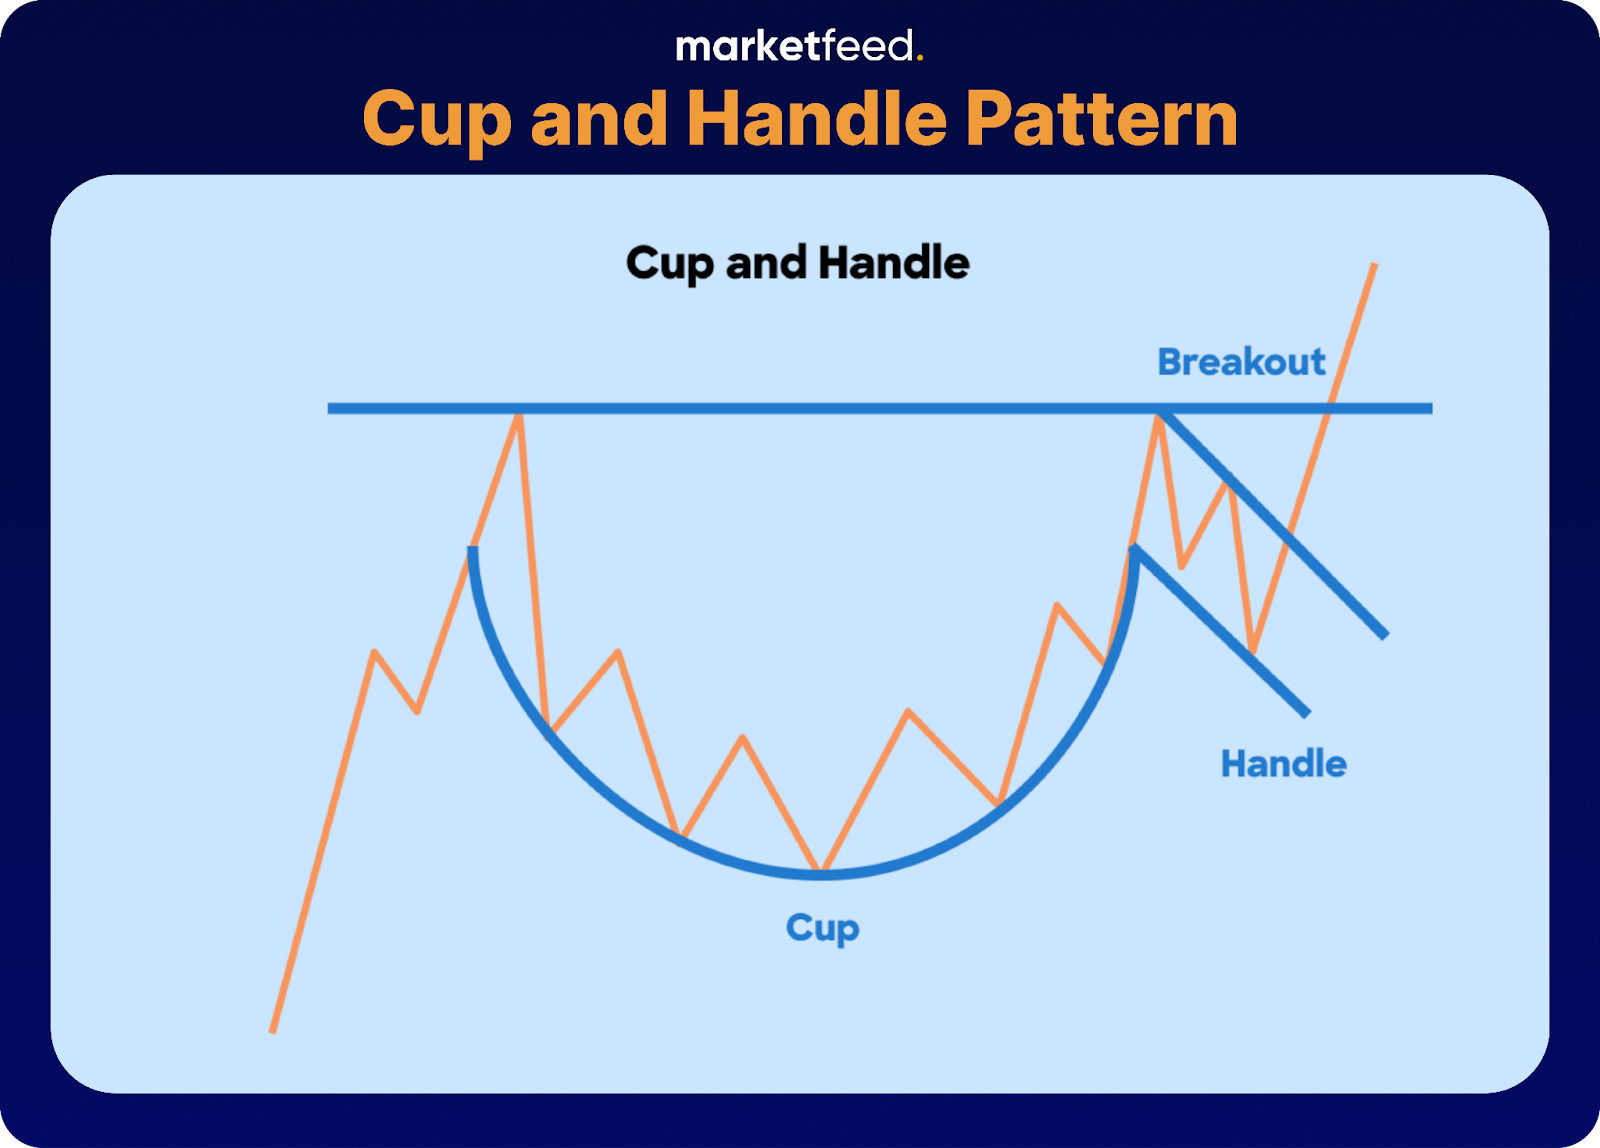
A cup and handle pattern resembles a cup and its handle. The price is bullish and creates a high, falls, recovers slowly over time, and climbs back up to the previously created high.
Then the price forms a small down-sloped rectangular pattern, breaks out of it, and finally breaks out of the previous high.
You can consider a long trade when the price breaks out of the high made after the pattern forms.
Pro Tips for Chart Pattern Analysis
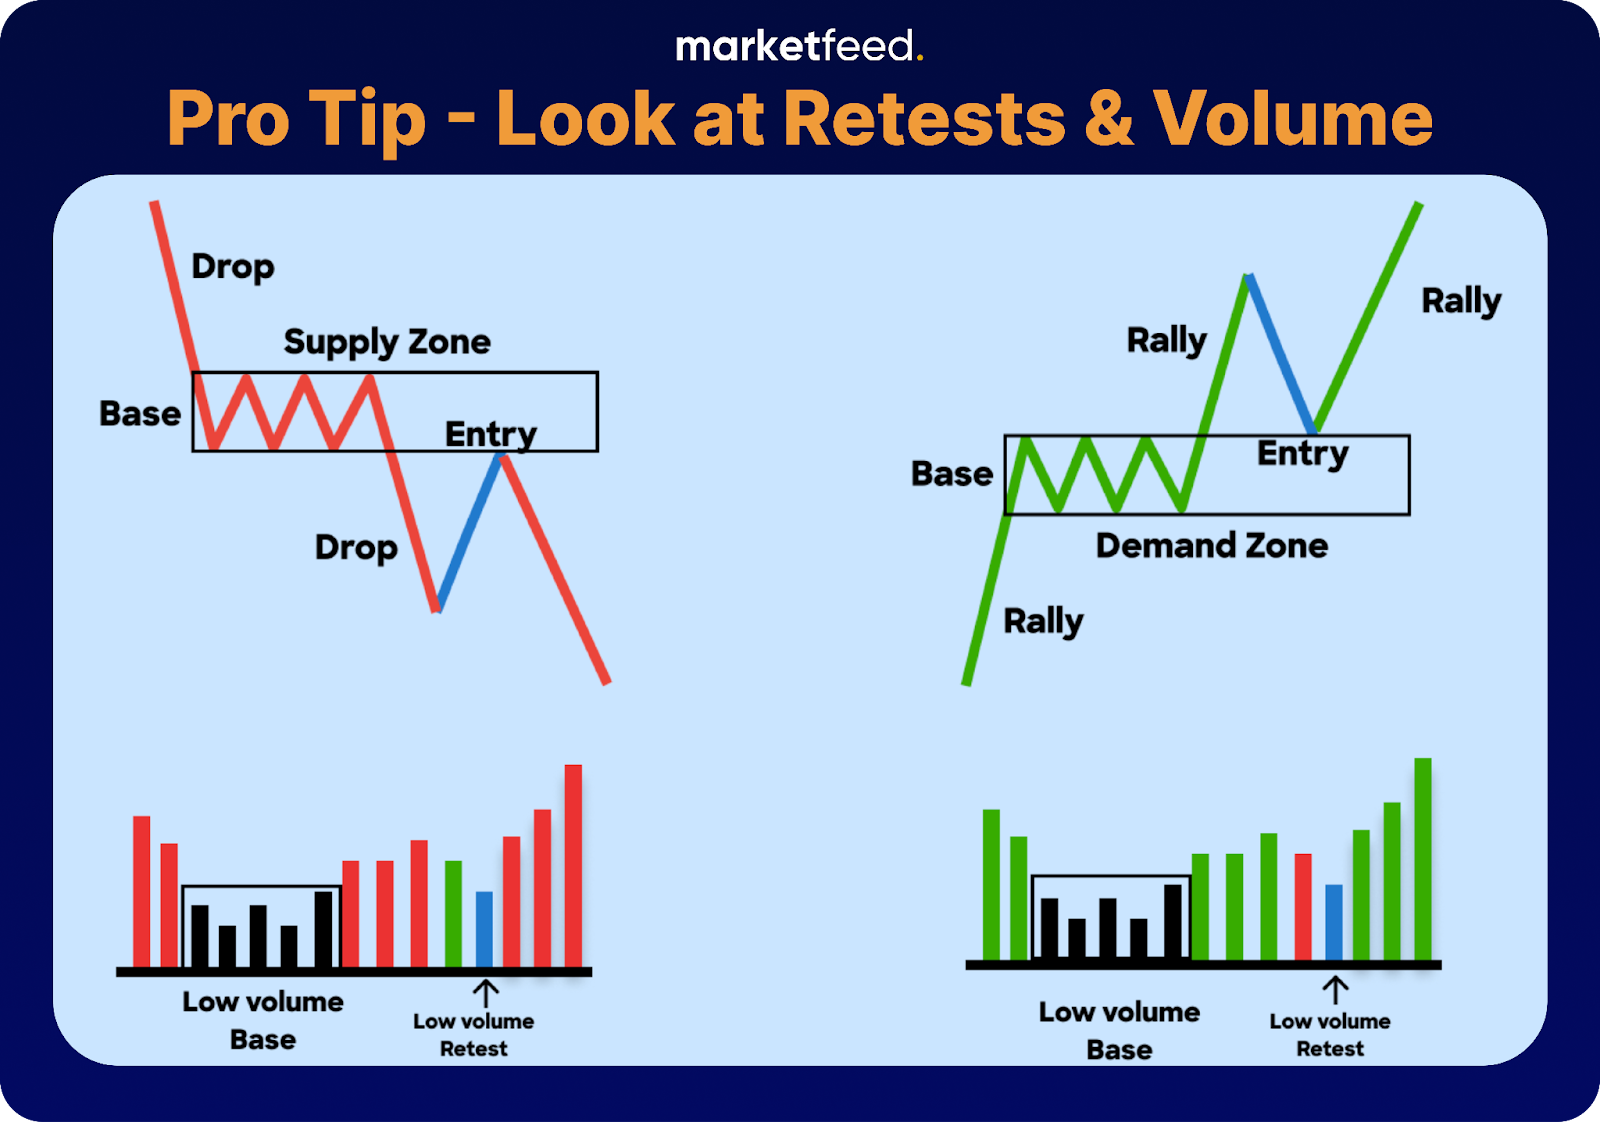
- Pattern-based trading can yield better results when you combine volume analysis with retests of supports and resistances.
- In the above bearish rectangle pattern, the volume during the consolidation is comparatively low. But it increases when the price breaks down from the lower support.
- Most of the time, the price retests the broken support or resistance. It means that the price returns to the breakout/breakout levels.
- The volume when the price returns for a retest should be low.
- If the retest fails, the price moves in the direction of the breakout/breakdown with an even higher volume.
- Traders often prefer to wait for the retest to be completed before entering a trade, as it helps decrease the probability of stop-loss (SL) being triggered by false breakouts or breakdowns.
Practical Application in Trading
- Chart patterns can form in any timeframes. However, patterns formed over a higher timeframe tend to be stronger than in lower timeframes.
- Before entering a trade, you should always confirm the volume during breakouts or breakdowns.
- Technical analysis is a subjective process. Therefore chart patterns won’t always be textbook accurate. It depends on how the trader interprets the information.
- Understanding the underlying sentiment and psychology is crucial as you gain deeper insights beyond theoretical knowledge.
These patterns are used daily by traders to find high-probability setups for trading. Practice is a must to identify patterns accurately and quickly. As an assignment, go through different charts and try to identify various patterns. Once you practice enough, you will be ready for action!
Also read: What are Candlestick Charts & How to Read Them?
Disclaimer: The information provided in this article is purely for educational purposes. Do your own research before using your hard-earned money to trade in the stock market.