Becoming an amazing trader requires mastering price action and technical indicators. This article provides a basic understanding of technical indicators, including what they are, how to plot them, the different types available, and some tips on how to use them effectively.
When it comes to trading, there are three different groups of traders with different approaches to trading. The first group uses only price action, the second group uses only technical indicators and the last group uses both price action and technical indicators.
The debate of price action vs indicators has been going on for a really long time. However, you must find your balance between the two of them to find high-probability trades and make money.
What is a Technical Indicator?
Technical indicators are mathematical tools or calculations derived from a security’s historical price and volume data. It includes intelligent analysis of the historical price and volume data to predict future price movement, which can be done in two ways: price action-based method and through technical indicators.
Technical indicators are more advanced than price action methods as they use mathematical calculations to make predictions about a stock’s future movement. For example, using the average of a player’s historical performance to predict their future performance is similar to using technical indicators to predict future price movements.
Types of Technical Indicators
Technical indicators can be classified into three main categories based on:
(1) Where they are plotted
Indicators are categorised into two groups based on their placement on a chart:
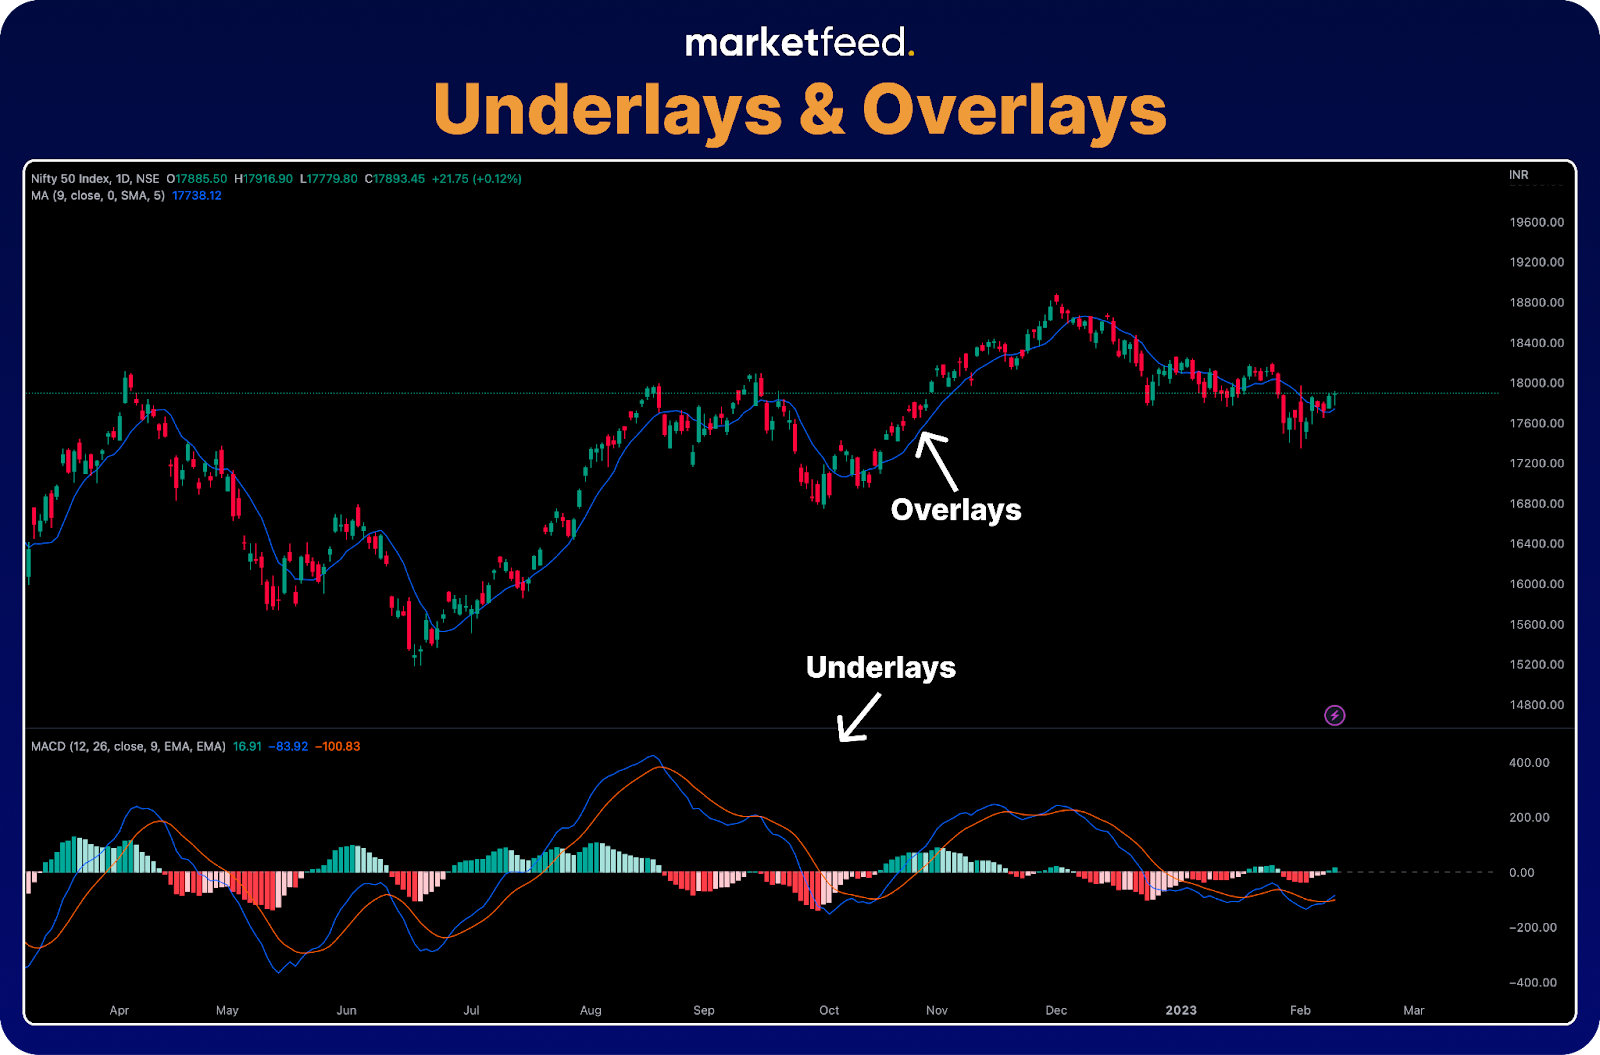
Overlays are plotted over the price in a chart. For example, Moving averages and Bollinger bands are overlays.
Underlays are plotted below the price in a chart. For example, RSI and Stochastics are underlays.
In the above chart,
The moving average indicator has been plotted on the price, thus making it an overlay.
The MACD indicator has been plotted under the price chart, thus making it an underlay.
(2) When do they indicate
Indicators are separated into two groups based on when they indicate:
Lagging indicators give signals after a trend or reversal has started. They follow the price action and are used for confirming trends or reversals. For example, Moving averages and Bollinger bands are lagging indicators.
Leading indicators give signals even before the trend/movement has begun. For example, RSI and Stochastics are leading indicators.
(3) What do they indicate?
Indicators are separated into four groups based on when they indicate:
Trendindicators are used to confirm the trend and measure the direction and strength of the trend. For example, Moving averages and MACD.
Momentum indicators are used to determine the strength or weakness of the price movement. For example, Stochastics and RSI.
Volatility indicators measure the price range and the periods of high and low volatility. For example, ATR and Bollinger bands.
Volume indicators measure trend strength & confirm it with the help of volume. Trends are stronger when volume indicators give confirmation. For example, volume chart and OBV.
Click on the indicators menu on the top panel to open the indicators search bar.
Search the required indicator and select it.
The indicator will be plotted on the chart.
You can also hide/unhide indicators by clicking on the eye button next to the indicator name on the top left side of the chart under the scrip name. This is helpful as you can hide/unhide indicators depending on your trading setup and don’t have to remove and add an indicator every time you need it.
Things to Keep in Mind While Using Technical Indicators
In reality, there are no perfect indicators when it comes to trading.
Traders need to find a combination of technical indicators that work for them in their analysis.
Overusing indicators and relying solely on them can lead to a cluttered chart and inaccurate analysis.
Different indicators may work well for different stocks or indices, so it’s important to understand what works best for each security and situation.
It’s crucial to understand that indicators will not give a true understanding of the market and that price action analysis should also be incorporated.
In this article, we covered the basics of technical indicators! These indicators act as insightful guides for traders, helping them navigate the dynamic landscape of market trends and potential reversals. As you venture into the world of stocks, let these tools be your allies, providing valuable signals to enhance your trading strategy. Happy trading!
Volume analysis is a crucial aspect of technical analysis that traders often overlook and misunderstand. In this article, we aim to clarify various misconceptions about volume in the stock market and provide a comprehensive overview of its use. We will discuss what volume is, its purpose, and how it can be used for trend confirmation. Additionally, we will explore the volume profile indicator, a powerful tool for understanding the behaviour of institutional traders.
What is Volume?
Volume is the total number of shares bought and sold over a specific period.However, people mistake volume for the number of trades that happen. If there are 10 buyers and 10 sellers, and each buyer and seller exchange 10 shares, then the volume is 100. So volume is the number of shares exchanged and not the number of trades, transactions, buyers, or sellers.
The number of sellers and buyers does not matter because for a trade to take place or a share to be transferred, there must be both a buyer and a seller, as they are the counterparties required for the transaction to occur.
Volumes can be of any time frame as it is measured over a period of time. The 5-minute volume indicates the number of shares exchanged within the 5 minutes. Similarly, a 1-month timeframe shows the number of shares transferred within the month.
The volume indicates the level of interest in a particular security. For example, if there is a huge increase in the volume of security in the 5-minute timeframe, it means that the interest in the particular security at that time has increased.
How to See Volume?
You can see the volume of a stock on your broker’s terminal and charts. The volume indicator displays the volume.
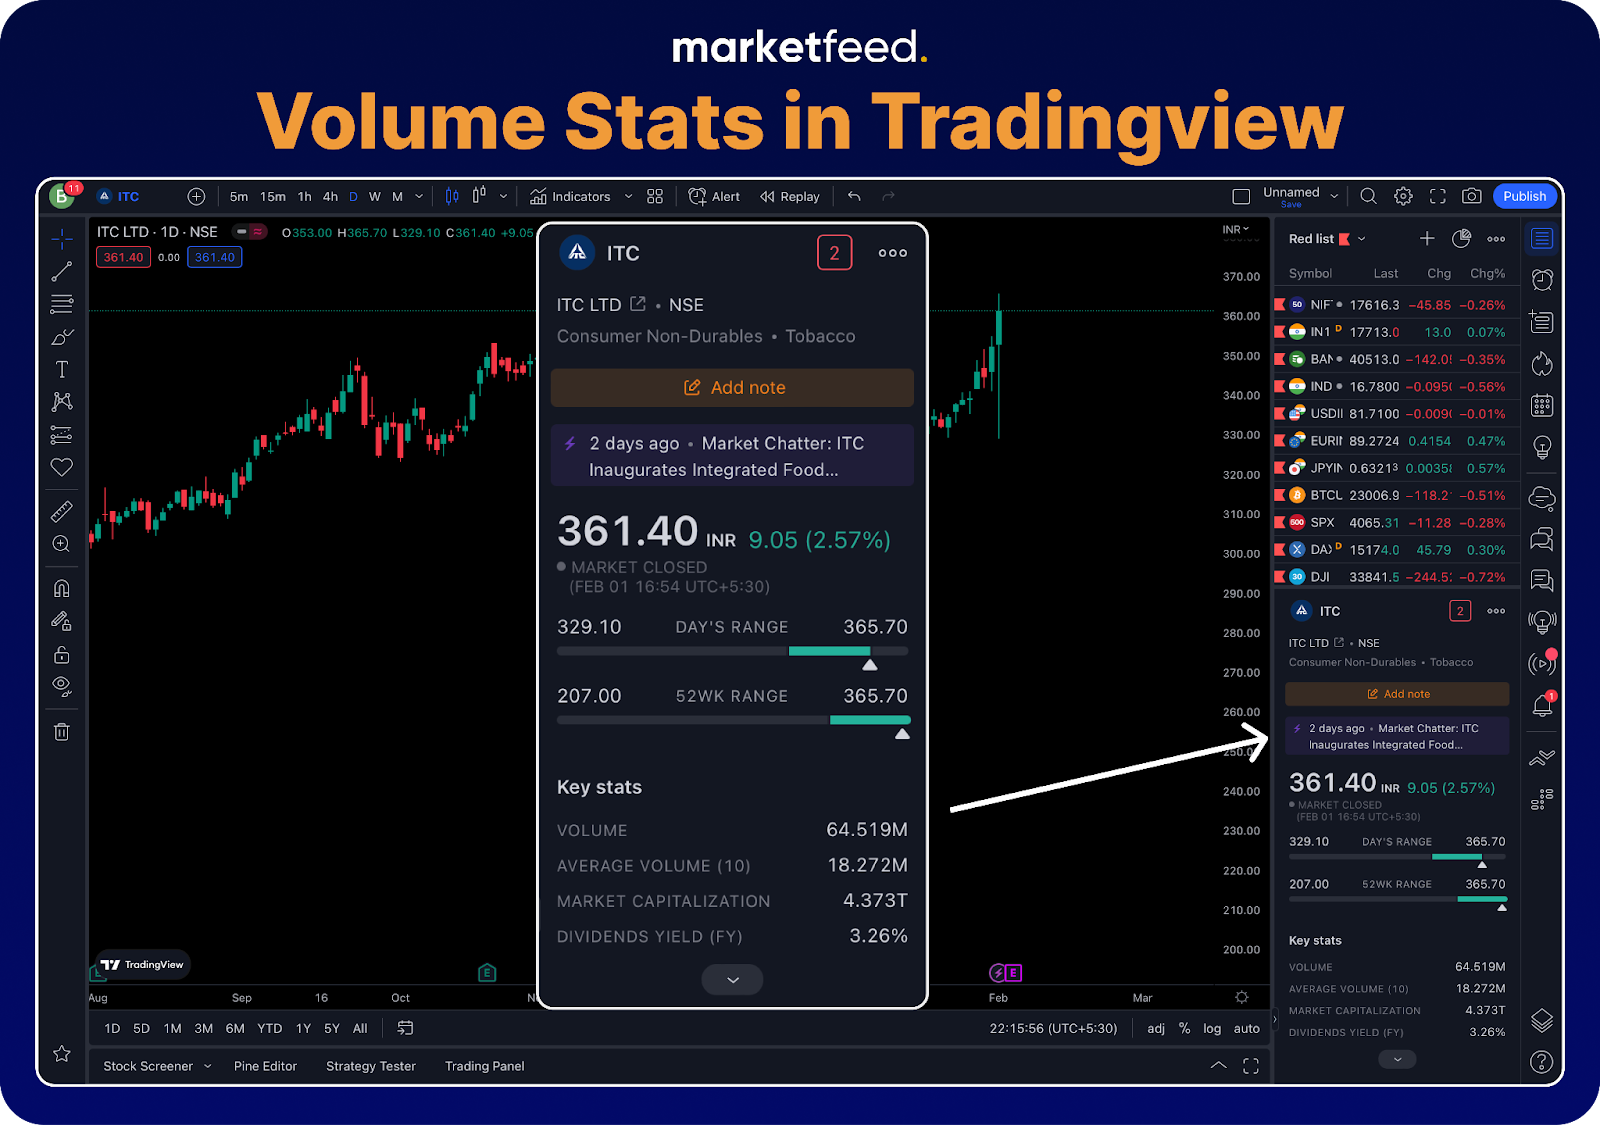
If you go to the key stats section on the right side of the TradingView terminal, it shows the volume of the day and the average volume over the past 10 days.
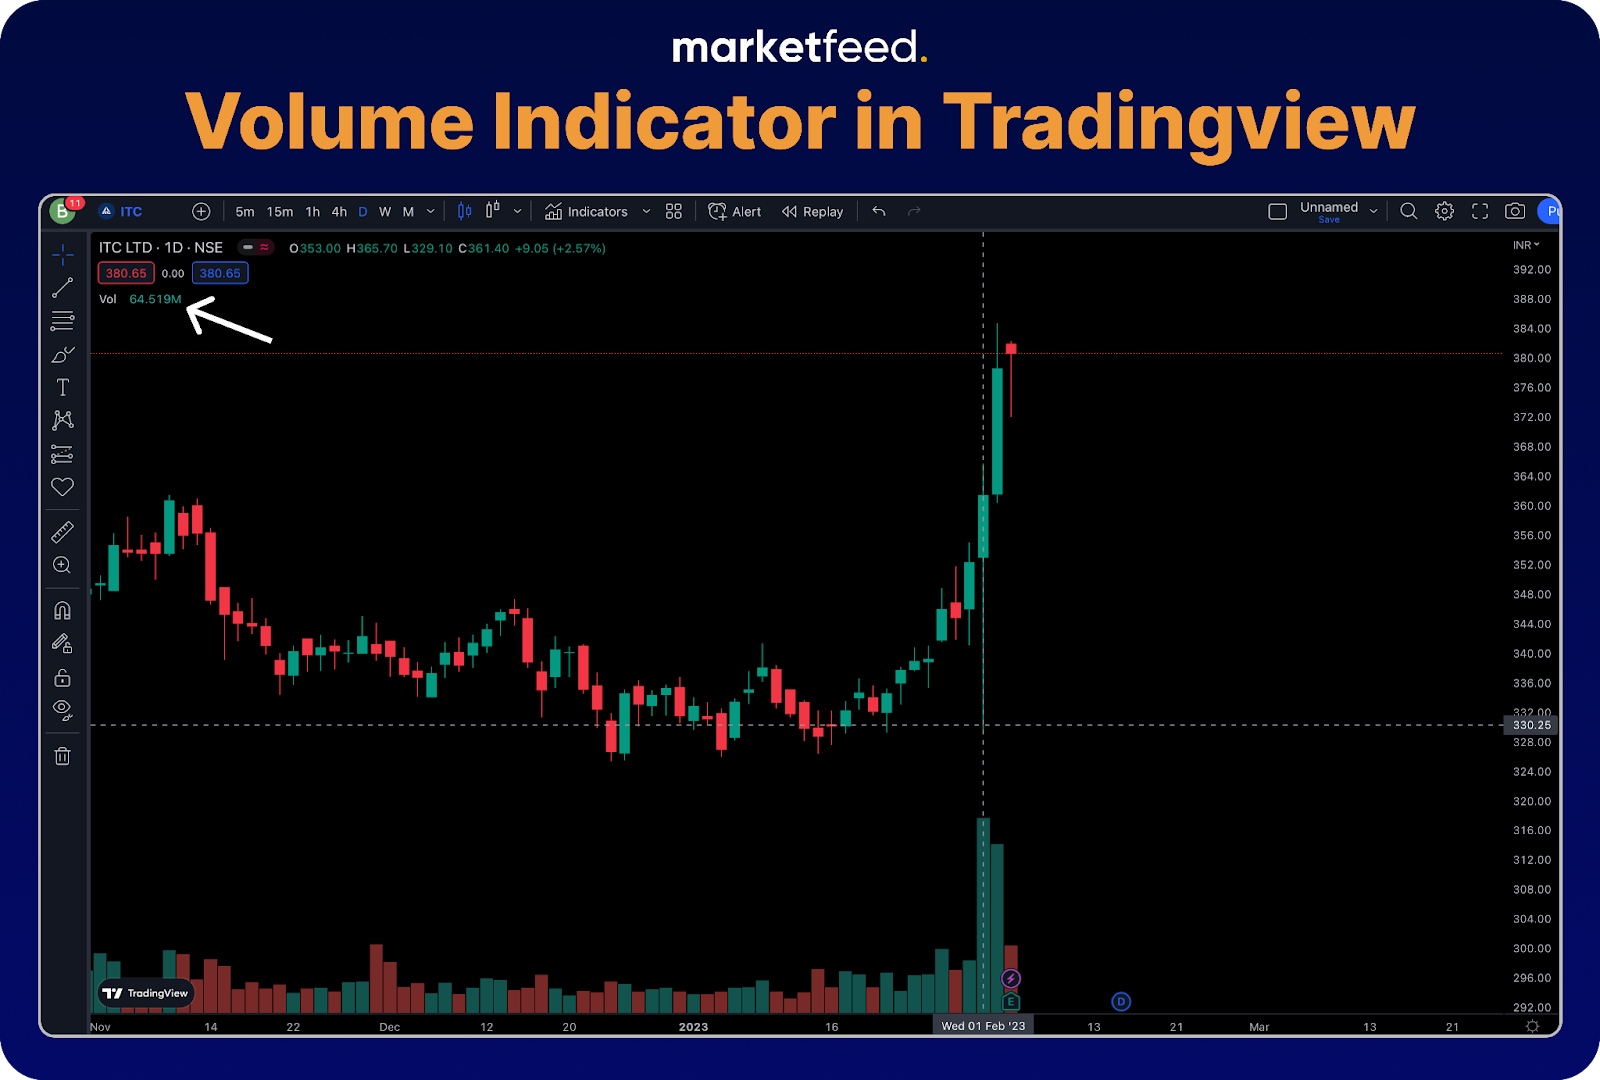
To add the volume indicator to your chart in TradingView, go to the indicators menu on the top bar and add volume by searching on the search bar.
Once you add the volume indicator, the volume bars will be displayed at the bottom of the chart, like in the below image.
If you hover the crosshair over any candle, the volume during that time period will be displayed on the top left side of the chart. Each volume bar corresponds to the candlestick above it. In the above example, each candle is of a 1-day timeframe and therefore each volume bar represents daily volume. If you change the timeframe to, say 5 minutes, each volume bar represents volume during 5-minute periods.
Why are Volume Bars Red & Green?
The colour of the volume bar depends on the colour of the candlestick. If the candlestick is red, then the corresponding volume bar will also be red.
A common misconception among beginners is that red volume bars indicate more sellers. A red volume bar only indicates that sellers are more active than buyers and as a result the price gets pushed down, making the candle red or bearish.
Uses of Volume in Stock Market
Volume is one of the ‘fundamental truths’ about the market because it indicates the interest in the stock. A higher volume indicates a higher interest.
Volume helps us confirm if trends and patterns are backed by the interest of the majority of market participants. For example, If a breakout is happening without volume, it could be seen as market participants not ‘believing’ in that move.
Active traders generally prefer high volume when trading an instrument. When you are considering entering a trade, always check if there is enough volume in that security. If it is illiquid, you will face liquidity issues.
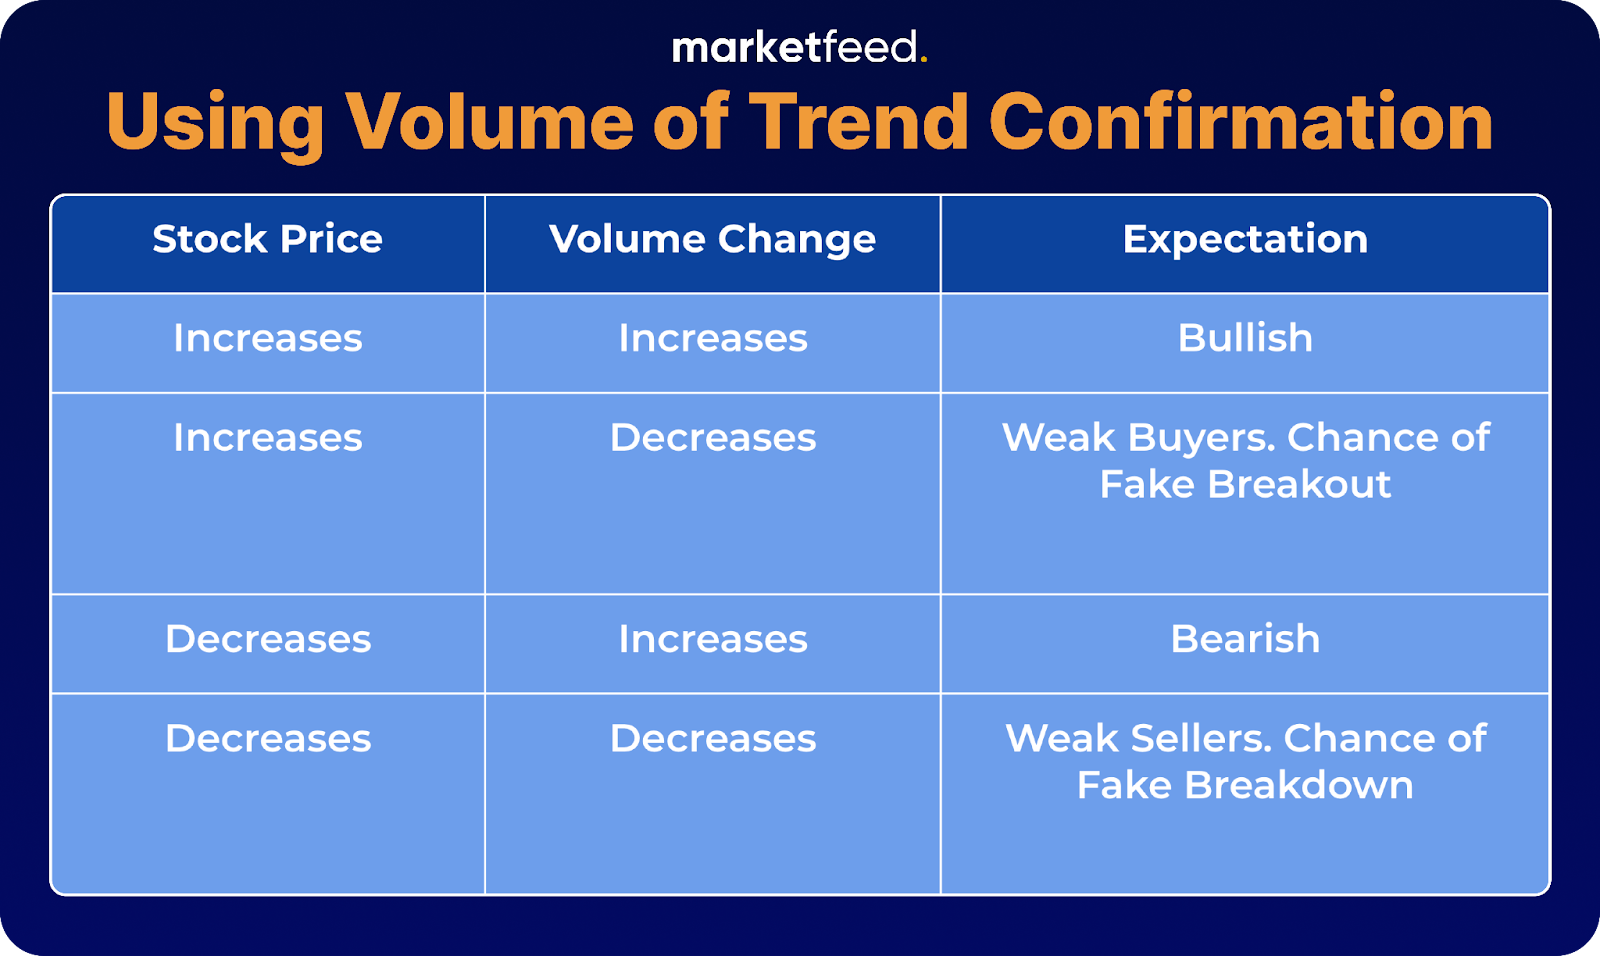
Using Volume for Trend Confirmation
Traders can use the above cheatsheet to confirm trends and patterns by incorporating volume analysis. To understand if the volume is increasing or decreasing, you can observe the volume bars and their size over a specific period. If the size of the current volume bar is higher than the previous bar.
Practical Application of Volume for Trading
1. You can use volume to confirm breakouts/breakdowns
Helps to enter, exit, or remain in a trade.
For example, if a breakout happens and there is an increase in volume, you can consider entering a long trade.
2. Use volume shocker screeners to find good stock trading opportunities.
You can use platforms like Chartink to filter out stocks with high volume to find trading opportunities.
Search volume shocker in the search bar to find screeners that filter stocks with unusual volume.
You can select stocks from the screened list to identify stocks with potential trading opportunities.
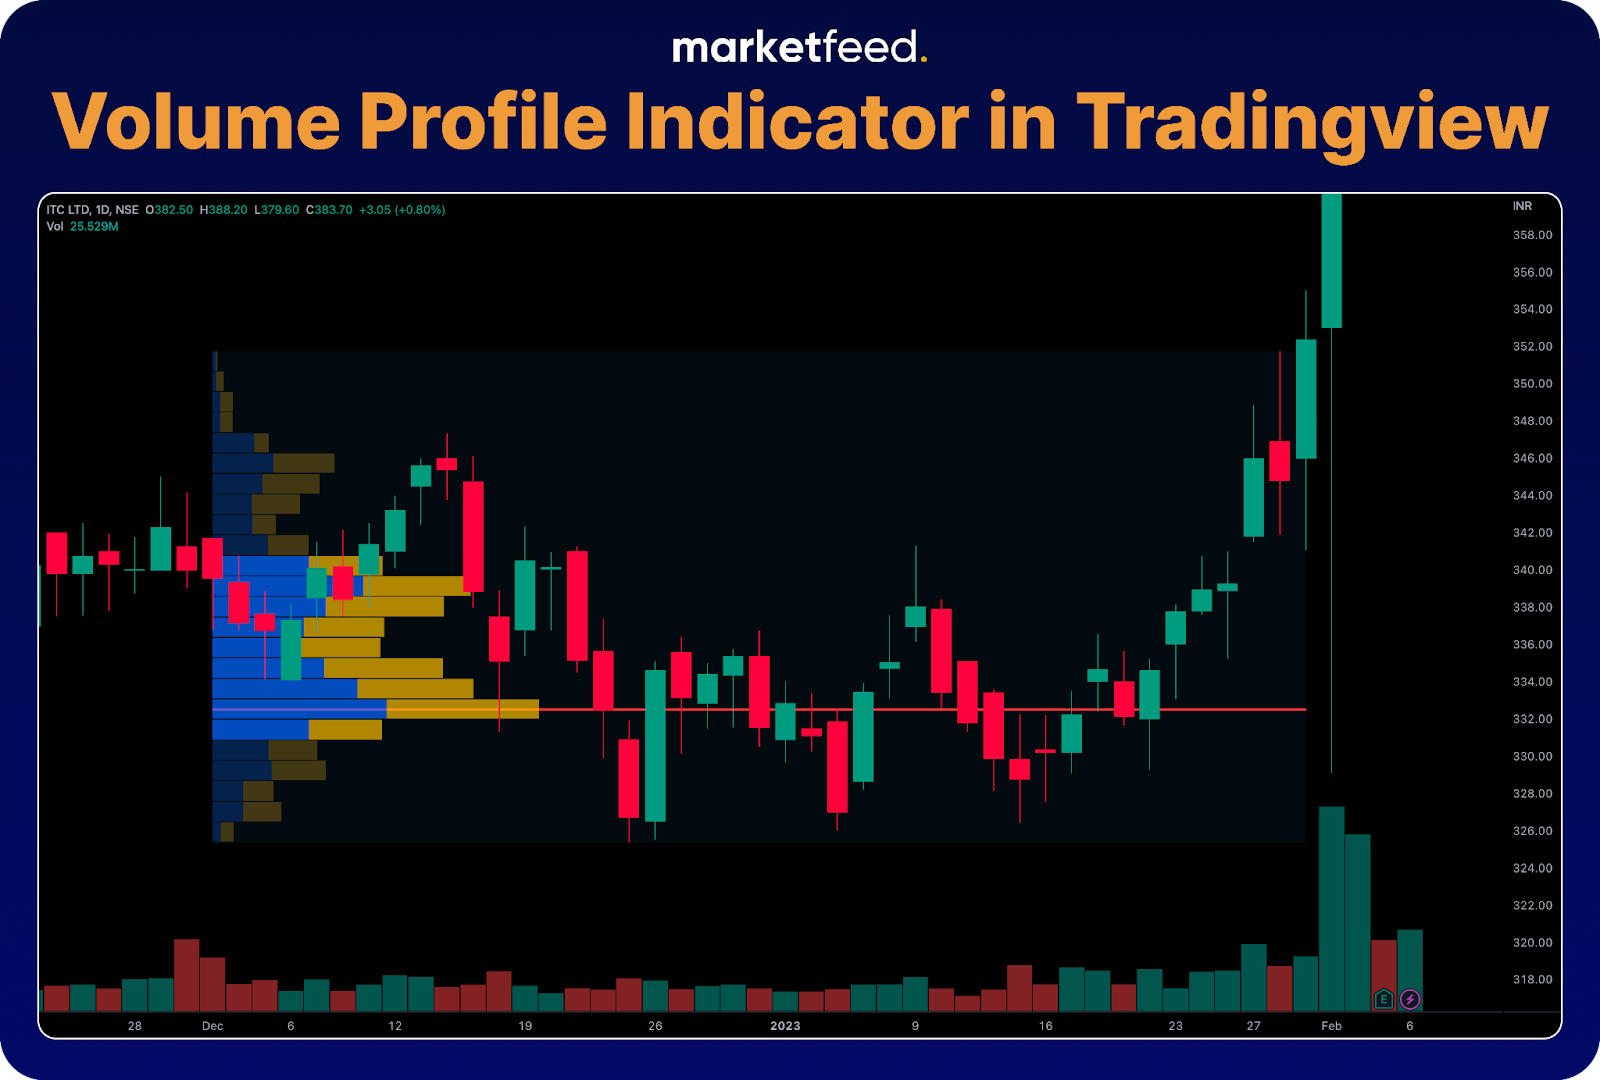
Volume Profile Indicator
A volume profile indicator shows the trading activity at different price levels over a period of time.
It reveals the significant price levels on the chart by showing the total volume traded at different price levels.
A red line indicates the zone with the highest trading volume.
Helps to gain an understanding of where significant volumes are being traded, giving them a clearer perspective on market activity and sentiment.
How to Access the Volume Profile Indicator?
Select the fixed range volume profile tool from the prediction and measurement tools under the tools panel on the left side of the chart.
Since this indicator calculates data over a time period, we need to set a start and end time. This can be done by clicking on the chart to define the starting time and clicking again to define the ending time.
Once the start and end time is set, the indicator will display the data in the form of a histogram based on the volume at the particular price levels.
In the above example, the data is measured from December 1, 2022 to January 31, 2023.
The red line indicates that the highest number of transactions took place at ₹333.
The histogram indicates the number of transactions at different price levels.
In conclusion, volume can help you assess the strength or conviction of buyers and sellers in determining a security’s price and thus volume analysis is one of the most useful tools in technical analysis. Always make sure to use volume analysis in combination with other analyses for better results!
Constructing a well-balanced and diversified stock portfolio is an essential strategy for investors seeking long-term success. To ensure optimal returns and reduce risk, it’s important to understand the complexities involving diversifying your investments. In this article, we explore what a portfolio is and how you can diversify your investment portfolio with the best framework
What is a Portfolio?
A portfolio can be defined as a collection or basket of securities. It’s vital we invest in multiple assets from different asset classes and sectors. A portfolio of assets can help you build wealth over the long term. We target a portfolio return of 15-25% CAGR over a long investment horizon, which is more than enough to achieve financial freedom.
Why Should You Diversify?
Apart from not staying invested for the long term, another common mistake that beginners make while starting long-term investing is that they invest in just 2-3 stocks. Beginners follow tips from social media channels that claim multi-bagger returns if they invest in these 2-3 stocks. But what would happen if any 2 out of these 3 stocks start performing poorly? You are going to lose most of your money. Therefore, the first and most important objective of a portfolio is to diversify and provide downside protection.
Portfolio: Not Necessarily Downside Protection
Apart from downside protection, a portfolio can reduce risk by combining securities whose returns do not correlate. Sometimes, an asset class or a sector might go down in value while another sector or asset class goes up in value. Combining assets that have a negative correlation helps to offset each other.
The Modern Portfolio Theory (MPT) states that investors should not only hold portfolios but should focus on how individual securities in the portfolios are related to one another. Although this theory has many limitations, the principles of this concept continue to be the foundation of knowledge for portfolio managers.
You Only Live Once (YOLO)?
We always preach investing in a portfolio of stocks rather than just 3-4 stocks that could be the next multibagger. But should you do it? It is absolutely possible to invest in just one stock and reap 10x returns. However, we would not recommend this for a consistent long-term wealth-building strategy.
By investing in just 3-4 stocks, you are potentially harming your way to financial freedom. What would happen if your strategy fails? You lose your money, your financial freedom, your mental peace, and a lot more. But by choosing the safer path and investing in a diversified portfolio, you can achieve your retirement goals and financial freedom.
The win-win solution to this problem is to consistently invest the amount you need to achieve financial freedom by retirement, and any sum of money over that amount, you can use for doing YOLO investments and potentially become the next Rakesh Jhunjhunwala. This way, you can make concentrated investments into potentially multibagger stocks without a trade-off on your financial freedom.
Asset Class Diversification
An asset class is a group of assets or investments that have similar characteristics. There are two types of investments: traditional and alternative. Traditional investments consist of publicly traded investments in stocks, bonds, and cash. Alternative investments are broadly classified into: private capital, real assets, and hedge funds. The alternative investment asset that we will be investing in is gold, which falls under real assets.
1. Equity will contribute to growth – High ROI but higher risk
You can directly invest in equity directly or indirectly by investing in equity mutual funds.
2. Debt & Gold will contribute to safety – Low ROI but lower risk
You can invest in debt mutual funds or liquid bees ETF
You can gain exposure to gold by investing in gold ETFs, digital gold, and sovereign gold bonds (SGBs).
3. The minimum recommended equity-debt allocation is 80-20. As your age increases, you can invest more into debt than equity.
Why invest in debt and gold?
Debt instruments give fixed returns as compared to equity. Therefore, even when the market is in bad shape, debt instruments can give you returns. Gold belongs to real assets under alternative investments. Traditional investments and alternative investments have a negative correlation and thus offset the negative returns that the equity in your portfolio might make.
Market Cap Diversification
Market capitalization refers to the total value of all of the company’s issued shares. It’s the valuation of a company.
Market Cap = Current Share Price x Total Outstanding Shares.
Market cap diversification refers to the diversification of equity based on the market capitalization of stocks. The three different market cap divisions are:
1. Large-cap – Stocks that have a market cap of more than ₹20,000 crores. The top 100 companies with the highest market capitalization fall under large-cap. These are also known as blue chip stocks.
2. Mid-cap – Stocks that have a market cap of fewer than ₹20,000 crores but higher than ₹5,000 crores.
3. Small-cap and micro-cap – Stocks that have a market cap of fewer than ₹5,000 crores.
Moderately Aggressive Portfolio
Large-cap – 50%
Midcap – 30%
Smallcap – 10% (first 250 small-caps)
Microcap or Bluechips – 10%
You can invest the final 10% of your portfolio into small caps or blue chips depending on your risk appetite.
As a thumb rule, your portfolio should comprise 50-70% large-cap stocks, 20-40% midcap stocks, and 10-20% small-cap stocks.
Sectoral Diversification
A sector refers to a group of companies from the same industry. Given below are the major sectors in the Indian stock market:
Automobile
Bank
Consumer durables
Financial services
FMCG
Health
IT
Media
Metal
Oil and Gas
Pharma
Realty
Another common mistake beginner investors make is investing in just 1-2 sectors, which is equally disastrous as investing in 2 or 3 stocks. If the industry or sector starts performing poorly, the whole portfolio might go down.
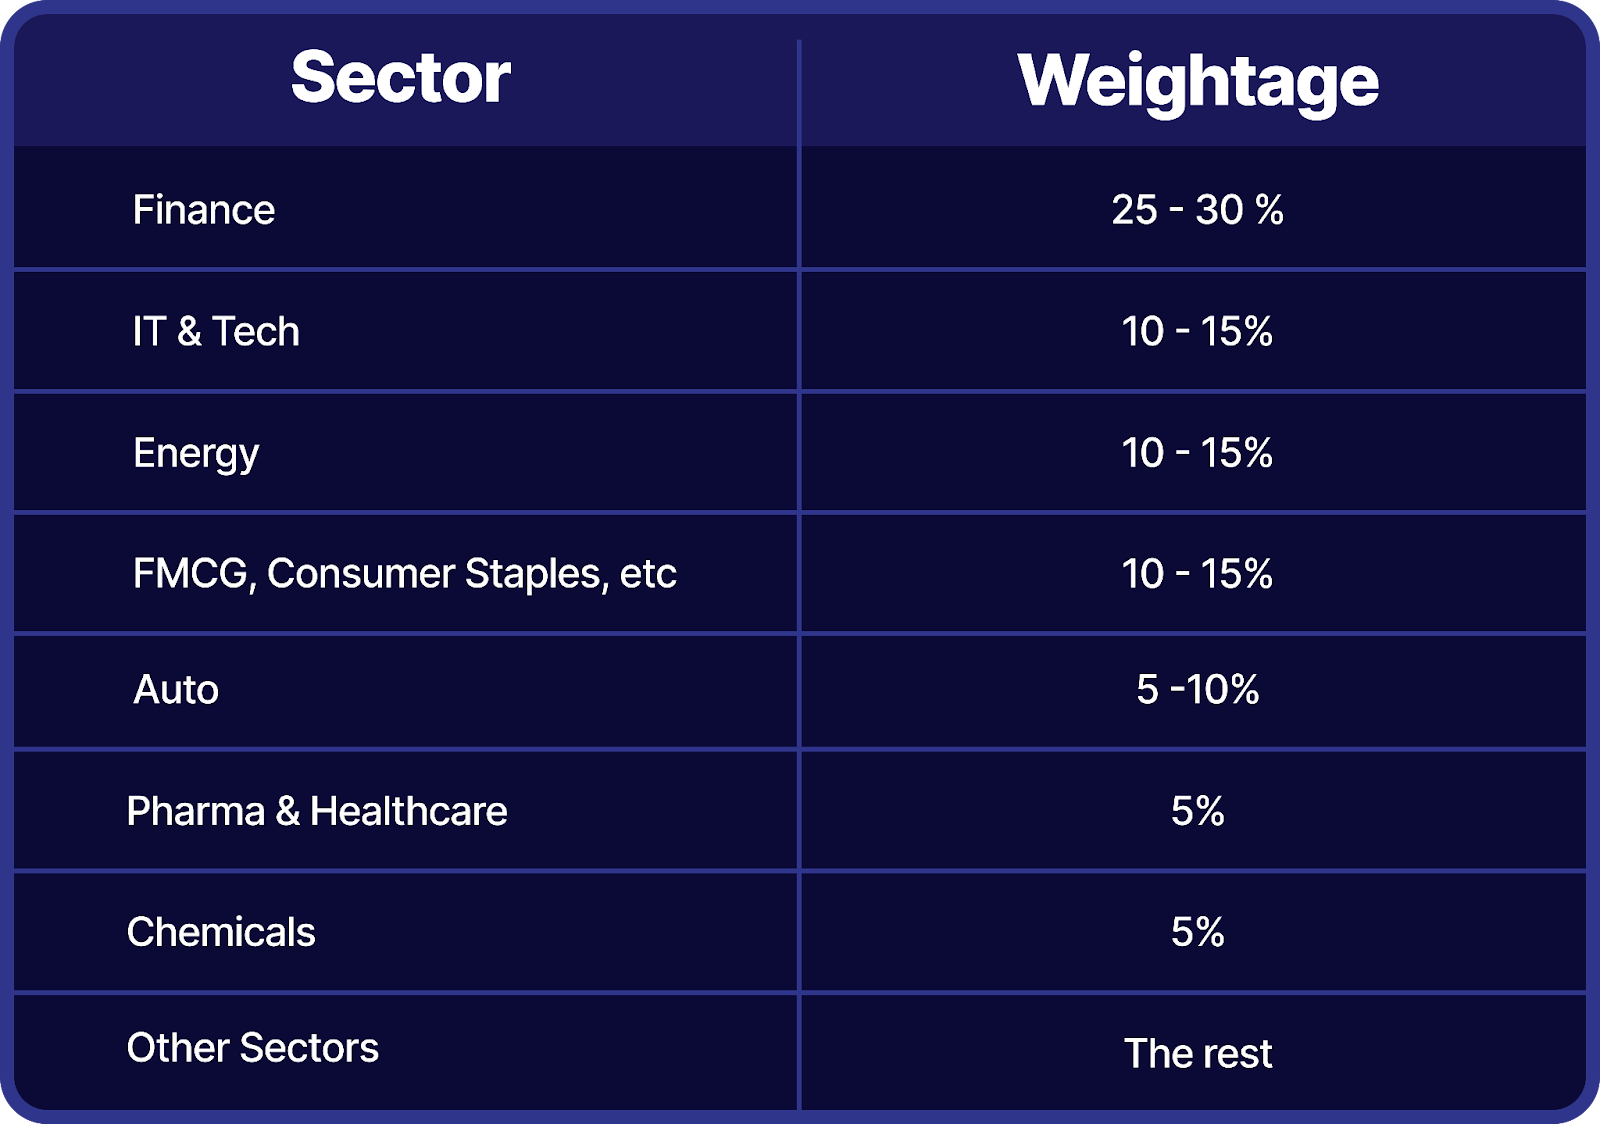
We should give exposure to at least 4-5 sectors and generally align with the market when we invest for the long term. But what does aligning with the market mean? It means that we should take NIFTY’s sectoral diversification as a reference:
We can follow a similar sectoral diversification while creating a portfolio.
Rules to Follow
1. Do not invest more than 20% of your capital into a single stock.
2. Do not invest more than 40% of your capital into a single industry.
3. Do not invest more than 15% of capital in small caps.
4. Always diversify.
5. Review your exposure frequently.
6. Don’t fall under peer pressure.
7. Always keep some cash available to invest if the market falls. Remember that every fall is an opportunity to invest more.
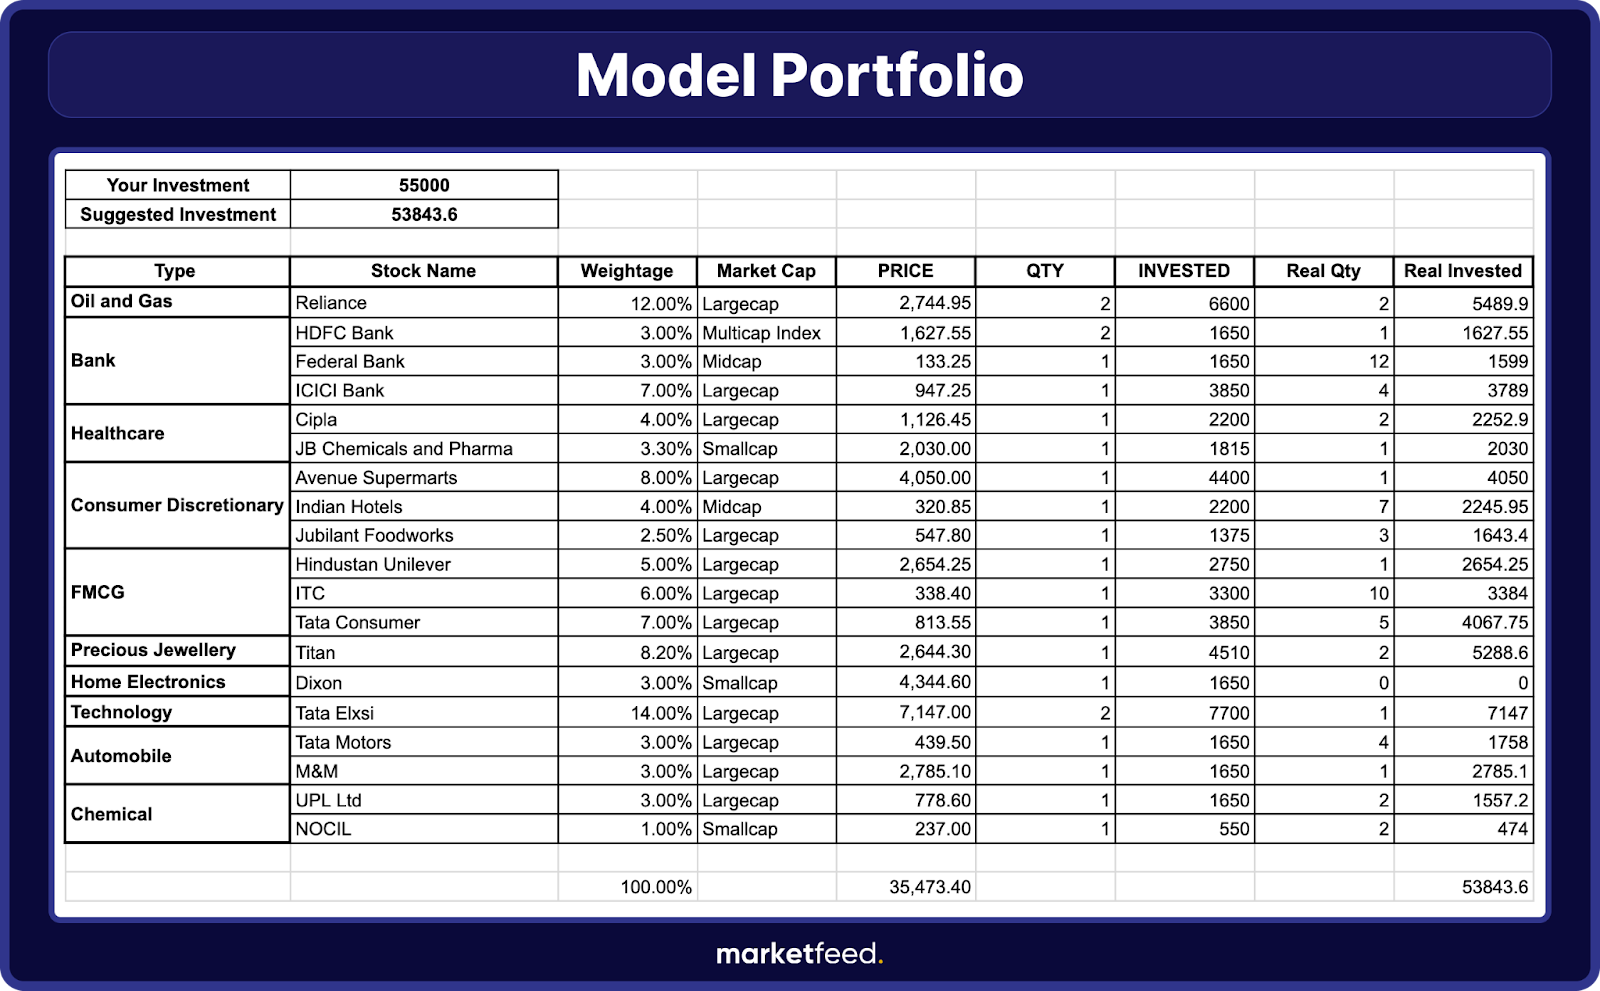
Model Portfolio
A model portfolio has been created by us for reference in collaboration with industry experts. This portfolio is well diversified and contains 19 stocks across 10 sectors. Even if a few of the stocks start doing badly, the overall portfolio won’t be affected much.
How to Create a Diversified Portfolio – The Flow
Let’s summarize and structure what we learned:
1. Find potential quality stocks to invest in
2. Perform fundamental analysis
Read and analyze annual reports
Read and analyze financial statements
Perform ratio analysis
Find valuation
Decide on value or growth investment strategy
3. Make a list of stocks that you find investment-worthy and classify them based on market cap and sector.
4. Decide on capital allocation to each sector and market cap.
5. Compile a portfolio of 15-20 stocks
6. Start investing!
Throughout this article, we have learned how to create a well-diversified portfolio for your long-term investment journey! Happy Investing!
Ever wondered how to figure out what a company is really worth? That’s where valuation comes in – it’s like a magic trick for understanding a business’s true value. Whether you’re new to investing or a pro, getting the hang of valuation basics is key to making smart money moves. In this article, we dive into the basics of valuation and how a company is valued to help you make better investment decisions.
What is Valuation?
In finance, valuation simply means finding the real worth of a company. Valuation is used to determine the price that market participants are willing to pay or receive while selling a business. Thus, value investing is based on the true value of a business compared to its market value. Let us understand what market value and intrinsic value is.
Market Value vs Intrinsic Value
The market value of a business is the worth that the market assigns to it. You can calculate the market value of any publicly traded company by multiplying the share price by the number of outstanding shares. However, the market value may not be the actual value of the business. Sometimes, the market may overvalue a company for reasons such as high demand for its stocks, future plans, market sentiments for that stock, etc.
Although the market value is what the market thinks a company is worth, the firm also has an intrinsic value. Intrinsic value is the true and accurate worth of a company. If the market value of a company is higher than its intrinsic value, then the stock is currently overpriced or overvalued. On the other hand, if the intrinsic value of a company is lower than its market value, then the company is undervalued.
How to Find the Intrinsic Value of a Company?
Finding the actual valuation of a company is a very complex, intensive, and lengthy process. Investment banks put together a team and take multiple days to find the true value of a company. Experts use different methods like Dividend Discount Models (DDM), Residual Income Models, Discounted Cash Flow Models, etc. However, for the purpose of our learning series, we will learn a simplified form of Discounted Cash Flow Analysis.
What is Discounted Cash Flow Analysis?
Discounted Cash Flow (DCF) models work on the concept of the time value of money. It is a concept that says that the value of a certain sum of money is worth more in the future than the same amount of money today because of the potential earning capacity of money. If you had the choice to receive ₹100 today or 1 year later, the choice should be today. This is because, if you receive ₹100 today and you invest that amount in an instrument giving you 5% returns per annum, then by the end of the year, you would have ₹105 with you. Having ₹105 over ₹100 is better at the end of the year.
Discounted cash flow analysis finds the present value of expected future cash flows using a discount rate. From the above example, 5% is the discount rate. A discount rate is the expected return over a period. If you think that the company will grow by 10% for the next 5 years, then the discount rate should be 10%. As the discount rate increases, the intrinsic value will decrease. So, we should take reasonable care while assigning a discount rate and make sure that the rate is fair and realistic.
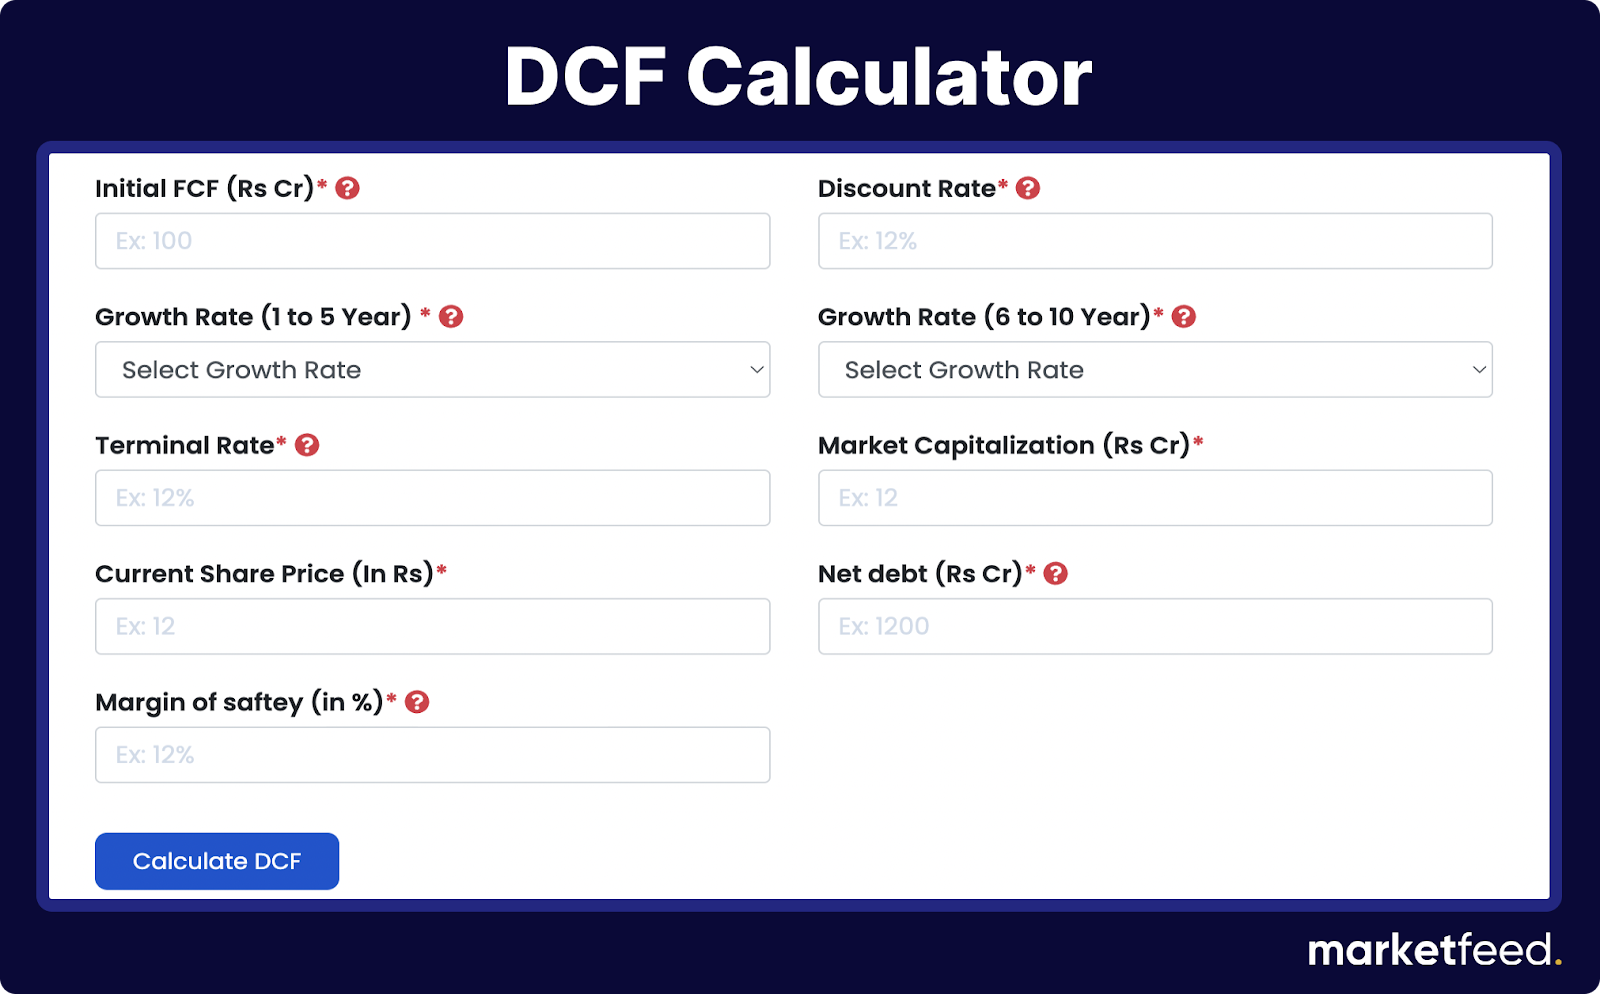
DCF Calculator
To find the intrinsic value of a company, we will be using a Discounted Cash Flow (DCF) calculator. Click here to use the calculator.
(Source: Finology)
Steps to Calculate Intrinsic Value
Step 1: Enter the initial FCF
FCF stands for free cash flow. Free cash flow = Net Cash flow from operating activities – Capital expenditure. Enter the three-year average FCF of a company.
Step 2: Enter the Discount Rate
The discount rate refers to the required rate of return. It is the return rate that you are expecting from a similar alternative investment.
Step 3: Enter Growth Rate (1 to 5 years)
It is the rate at which the company might grow in the next 1 to 5 years. Large and well-established companies will have relatively low growth rates. You can also use the average growth rate of revenue or profit for the past 5 years and use that rate here.
Step 4: Enter Growth Rate (6 to 10 years)
It is the rate at which the company might grow in the next 6-10 years after the initial period.
Step 5: Enter the Terminal Rate
It is the rate at which the company is expected to grow 10 years from now. It is calculated by assuming the constant growth of a company beyond a certain period. 5% and below is a fair terminal rate.
Step 6: Enter the Market capitalization
The market capitalization can be calculated by multiplying the total number of outstanding shares by its current share price. It can be easily found from screener.in, Tickertape, etc.
Step 7: Enter the Current Stock Price
Step 8: Enter the Net Debt
Net debt can be calculated by deducting cash and cash equivalents from a company’s total debt/liabilities. This data can be calculated from the balance sheet.
Step 9: Enter the Margin of Safety (MoS)
The margin of Safety provides discounts for uncertainties in the business.
Step 10: Click ‘Calculate’
The calculator gives two values:
DCF value per share shows the estimated intrinsic value.
Fair value shows the intrinsic value per share after deducting the margin of safety.
If the intrinsic value derived is higher than the market price, then the stock is undervalued and if the intrinsic value is lower than the current market price, then the stock is overpriced.
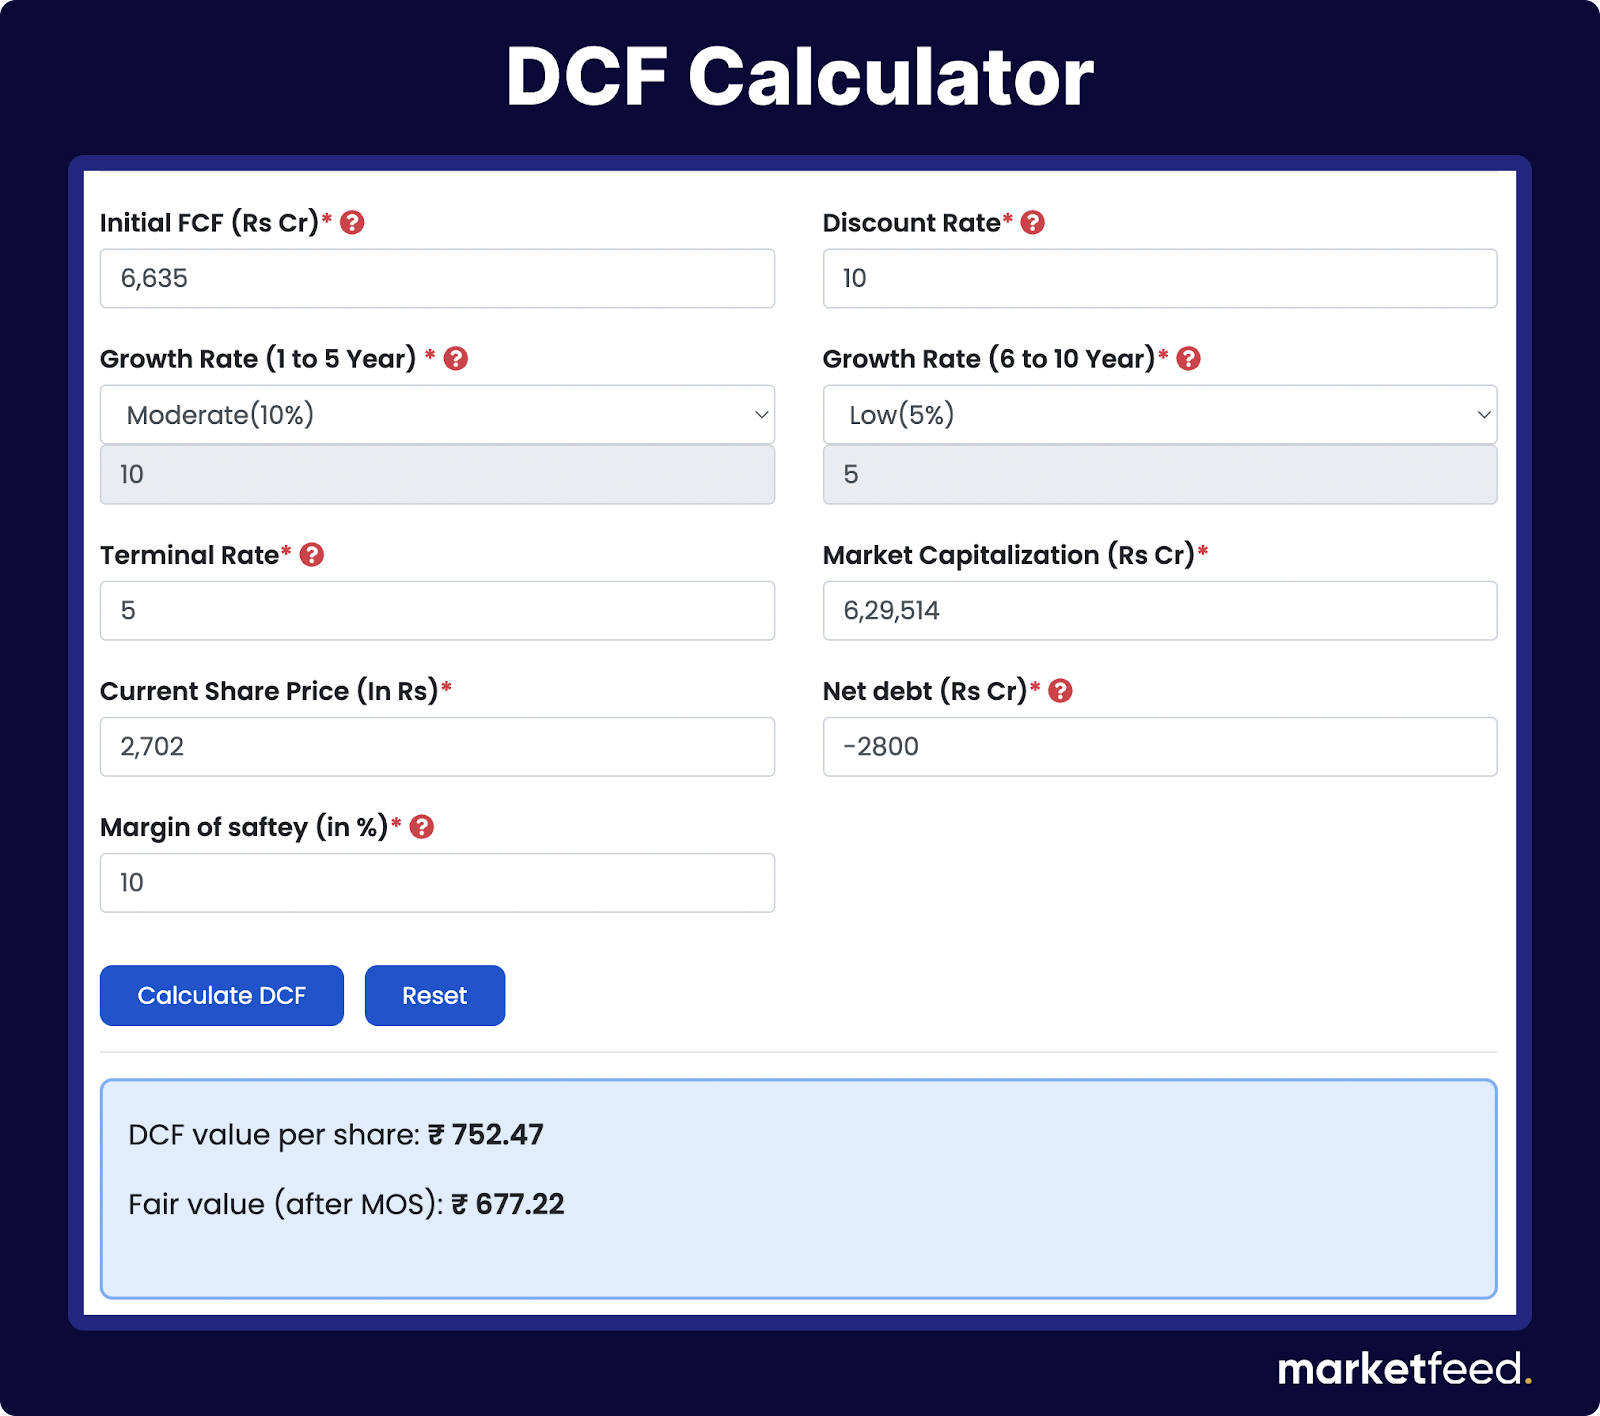
An Illustration
Let us use the calculator to find the intrinsic value of Hindustan Unilever (HUL). The values are entered as per the above instructions:
(Source: Finology)
Assuming that the current share price of HUL is ₹2702, the DCF value or intrinsic value per share is ₹752.47. The fair value or intrinsic value after the margin of safety is ₹677.22. The stock price of HUL is 3 times more overpriced than its estimated intrinsic value.
We have learned now how to find the intrinsic value of a company. This value can be used while making decisions when it comes to value investing. However, we don’t give much importance to intrinsic value in the case of growth investing.
In conclusion, valuation is not just about numbers; it’s about unlocking the potential of a company’s true value. So, as you navigate the world of finance, use these insights to guide your journey and make informed choices!
Most financial experts or ‘finfluencers’ teach people everything about long-term investing but miss out on one important topic: How much to invest? It might be because the answer to the question is highly subjective. The amount of money we invest every month varies according to different factors such as age, lifestyle, financial goals, etc. Even though this topic is highly subjective, we have created a financial planning calculator to answer the question “How much should you invest?”
The 50-30-20 Rule
As we discussed in the last chapter, we can use the 50-30-20 rule as a thumb rule to know how much to invest every month. This rule says that we should spend 50% of our total income on basic needs, 30% on our wants, and 20% on investments. However, not everyone can use this rule because income, expenses, lifestyle, and financial goals differ from person to person. To address this issue, our financial planning calculator provides a tailor-made solution for each individual.
How Can Our Excel Calculator Help You?
1. Retirement Goal Planning
It determines the corpus amount that you would need to retire comfortably, and how much to invest every month to achieve the goal. You have to input details like current age, retirement age, pre and post-retirement expenses, etc.
2. Marriage Goal Planning
You can calculate how much to invest every month to build a corpus to take care of your marriage expenses. Input how much it would cost in total if you were to marry today, your current age, and the age at which you expect to marry.
3. Car Goal Planning
You can also plan how much to save and invest every month to achieve the corpus needed to buy your dream car. You have to input how much your dream car will cost if you were to buy it today, your current age, and the age at which you plan to buy the car.
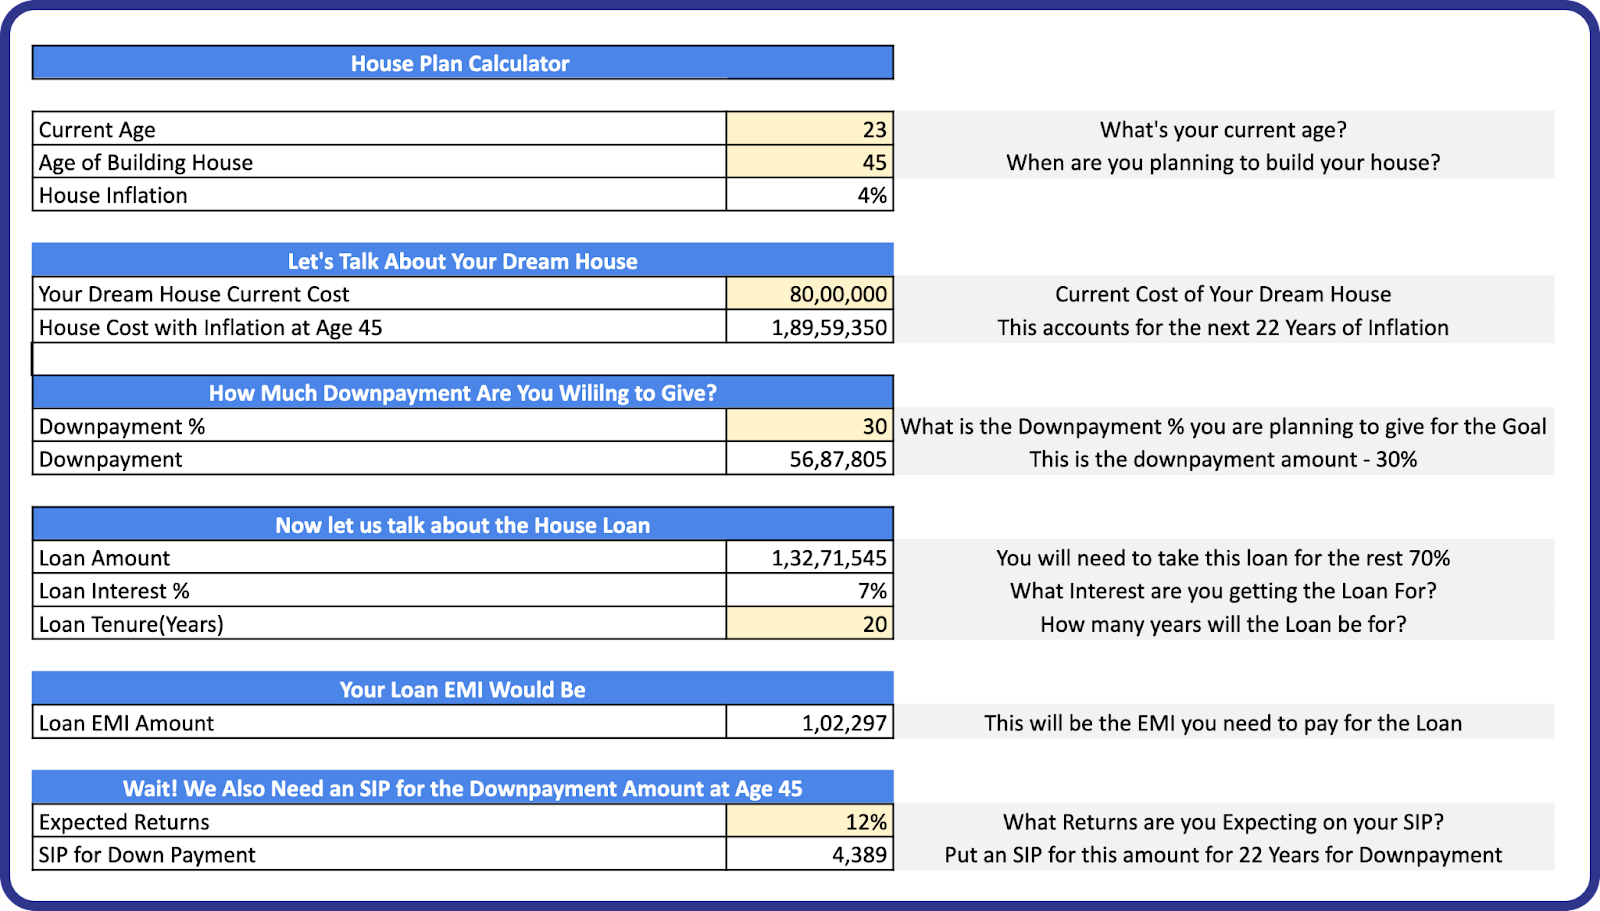
4. House Planning
You can plan to fund the dream home you wish to buy. You have to input how much it will cost to buy or build your dream home today, at what age you would like to buy it, how much you wish to pay as a down payment (in percentage), the tenure of the loan you would take out, and the expected returns on the SIP you’ll do to create the downpayment corpus.
5. Custom Goal Planning
Other than the goals mentioned above, you can also plan for any other financial goals using the custom goal sheet in the calculator.
It’s a READ-ONLY VERSION. You have to make a copy of the document to edit it.
Instructions to Use the Calculator
1. The link will take you to the read-only version of our Financial Calculator. Click on ‘Make a Copy’ under the File tab to create a copy of the calculator for you to edit. You can also download the file as .xslx to use the calculator on Microsoft Excel.
2. Edit or enter figures in the yellow cells only.
3. Do not edit any cells other than those in yellow as it will interfere with the preset formulas.
4. The calculator has 8 sheets:
Input data here: Input the data asked in the sheet.
Marriage goal planning
Car goal planning
Pre-marriage contribution to retirement: Input the amount you are willing to invest every month until your marriage and the expected return on the investment. Input goal age and goal amount as 0 if you do not wish to marry. If you are already married, only input the current age and input the rest as 0.
Post-marriage monthly expense: Input the expenses that you would incur every month assuming that you were married already. If you do not wish to marry, input your current expenses here.
Retirement planning
House Planning
Custom goal planning: you can plan any other financial goals not included in the calculator.
Retirement Goal Planning
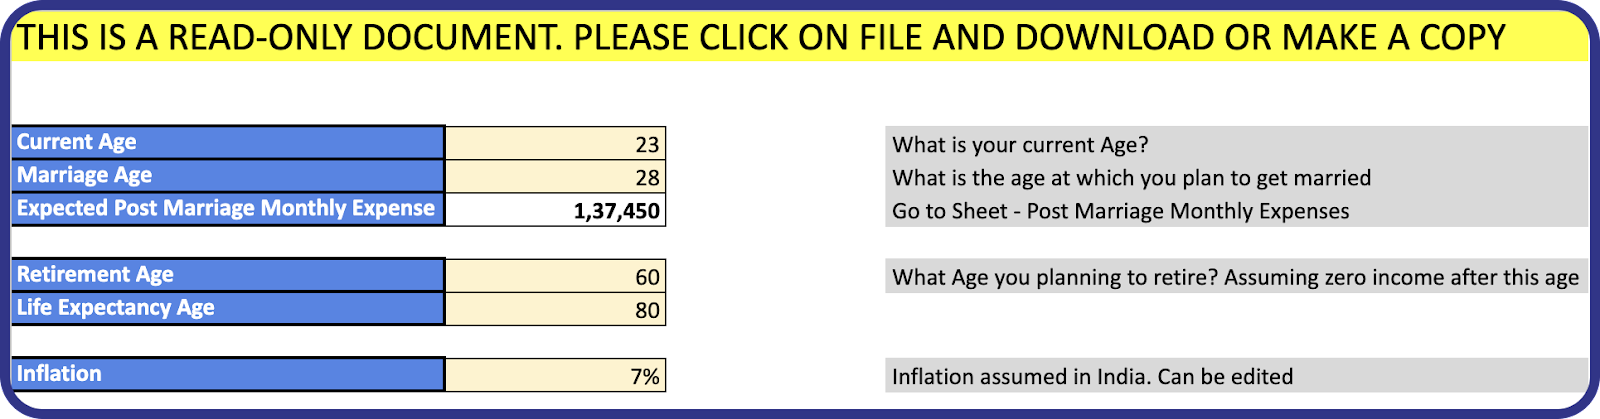
Step 1: Input data here
Add current age, marriage age, retirement age, and life expectancy age in the datasheet.
Input marriage age as current age if already married or if you do not wish to get married.
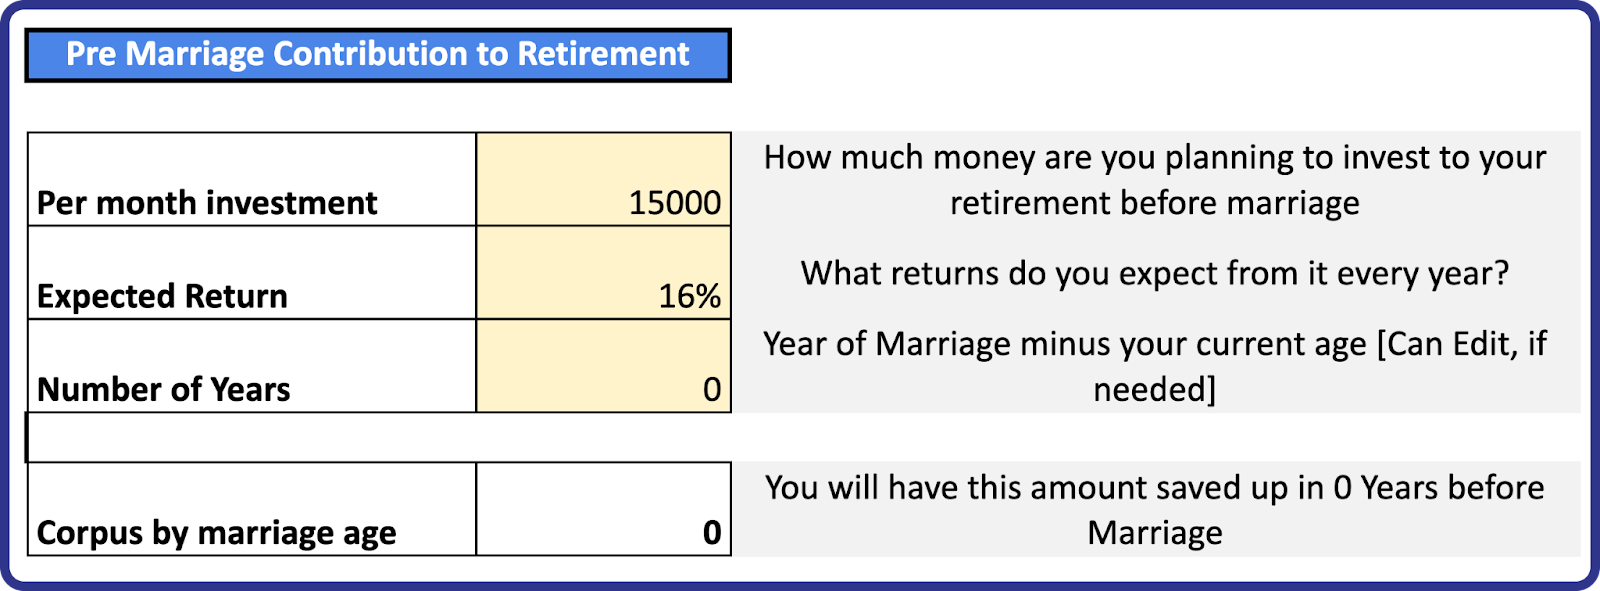
Step 2: Pre-marriage contribution to retirement
Enter the amount you’re willing to invest every month towards your retirement before you get married and the expected return on that investment.
The system will automatically calculate the number of years.
If you do not wish to get married or if you’re already married, enter the amount as 0.
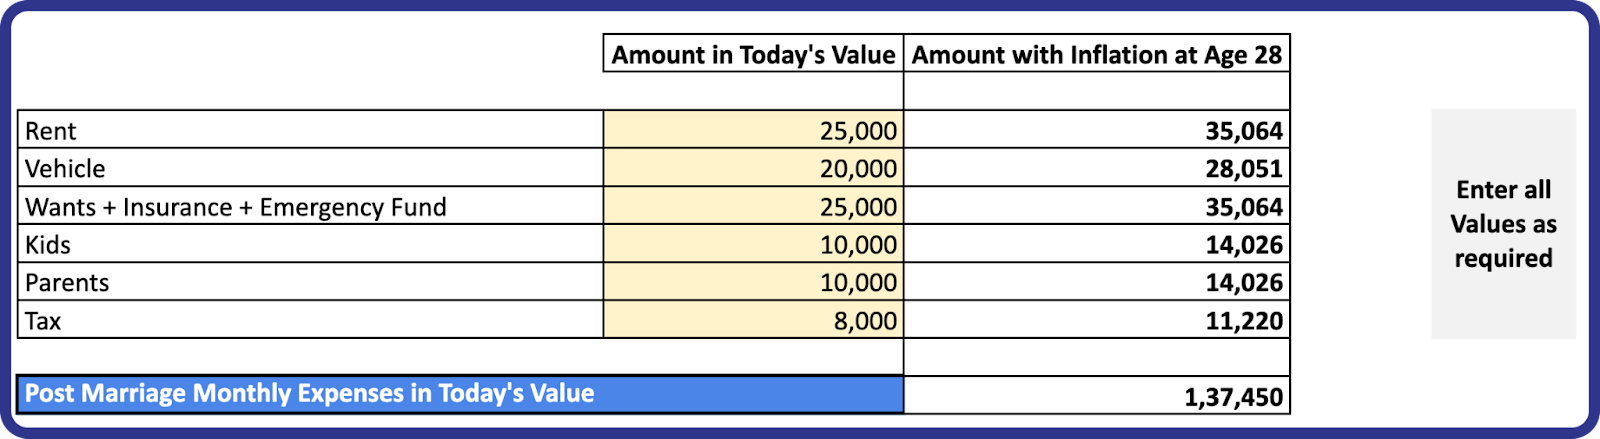
Step 3: Post-marriage monthly expense
Calculate and enter the various expenses that you would incur if you were married today. If you are already married, input your current total monthly expenses or your current monthly expenses if you do not wish to get married.
When you enter your wants, make sure that it is a monthly average of the money that you spend on your wants such as movies, trips, new electronics, etc.
The planner works best only if you’re brutally honest with your answers.
Step 4: Retirement planning
Enter what percentage of your expected expenses can be your retirement expenses.
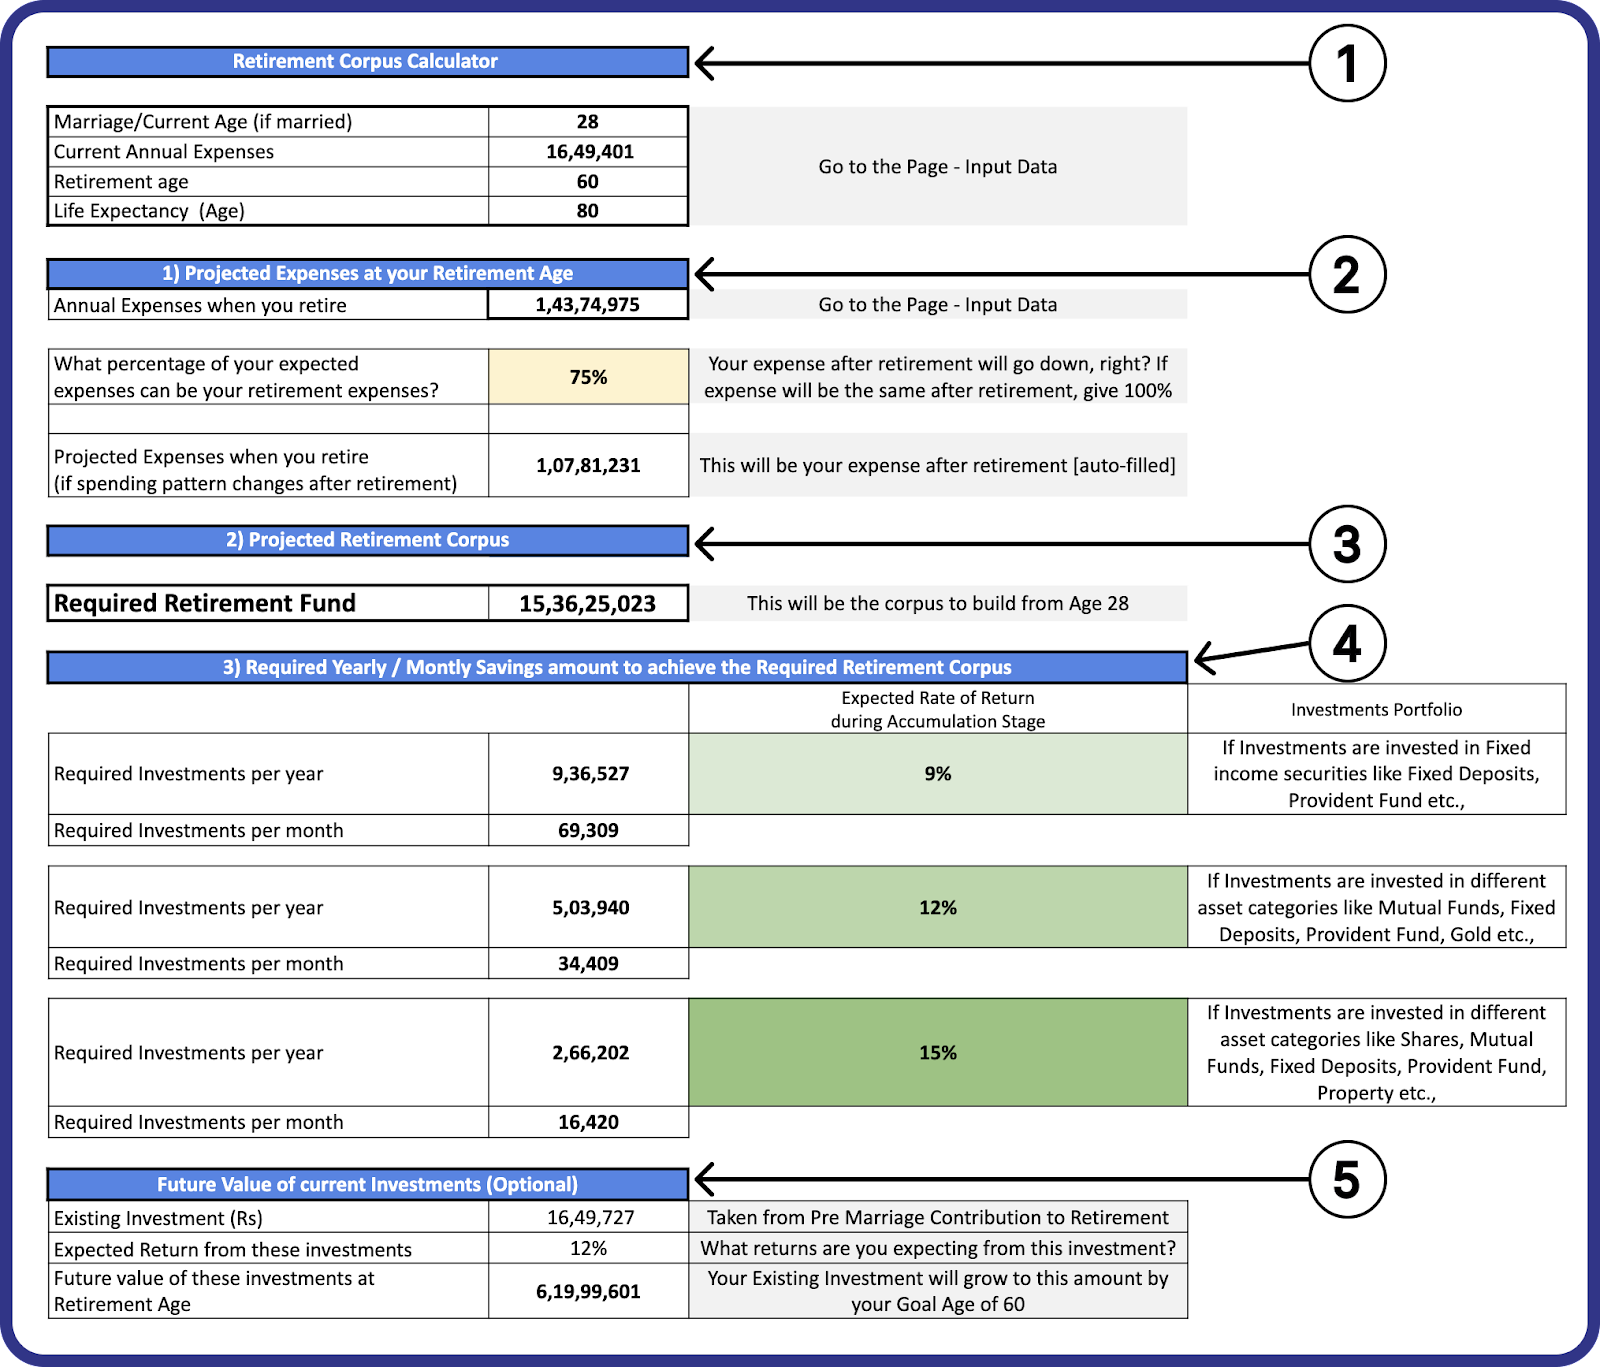
1. The data already added in previous sheets will be displayed here.
2. The system will recall data from the input sheet and display your annual expenses at the time of your retirement adjusted for inflation. You also need to enter what percentage of your expenses you expect to incur after you retire.
3. The projected retirement corpus is the amount of money you will need to comfortably retire according to your projected expenses.
4. It’ll show three different investment portfolios with different returns that you can invest in according to your risk appetite. The required investment per month/year is given adjacent to each investment portfolio. The higher the portfolio return, the lower the SIP amount.
5. The future value of current investments is the value of the investment you made in pre-marriage contribution to retirement when you retire.
So, to build a retirement corpus of ₹15 crore that can be used to fund your life’s expenses, you need to invest ₹16,420/month in a portfolio giving 15% CAGR from age 28 till you turn 60. If you build this retirement fund, you can continue to live off of it as you live currently, without having to do any job whatsoever after you retire!
Step 5: Start Investing!
As soon as you’ve selected a suitable investment portfolio, you can initiate an SIP!
Marriage Goal Planning
Step 1: Input data
Enter your current age.
Input the amount of money that you would need if you were to marry today.
Enter the age at which you plan to get married.
Step 2: Input existing investments
If you have any existing investments or savings that you have been saving up for your marriage, add them to the sheet. If you don’t, enter 0.
Enter the expected returns from your existing investments.
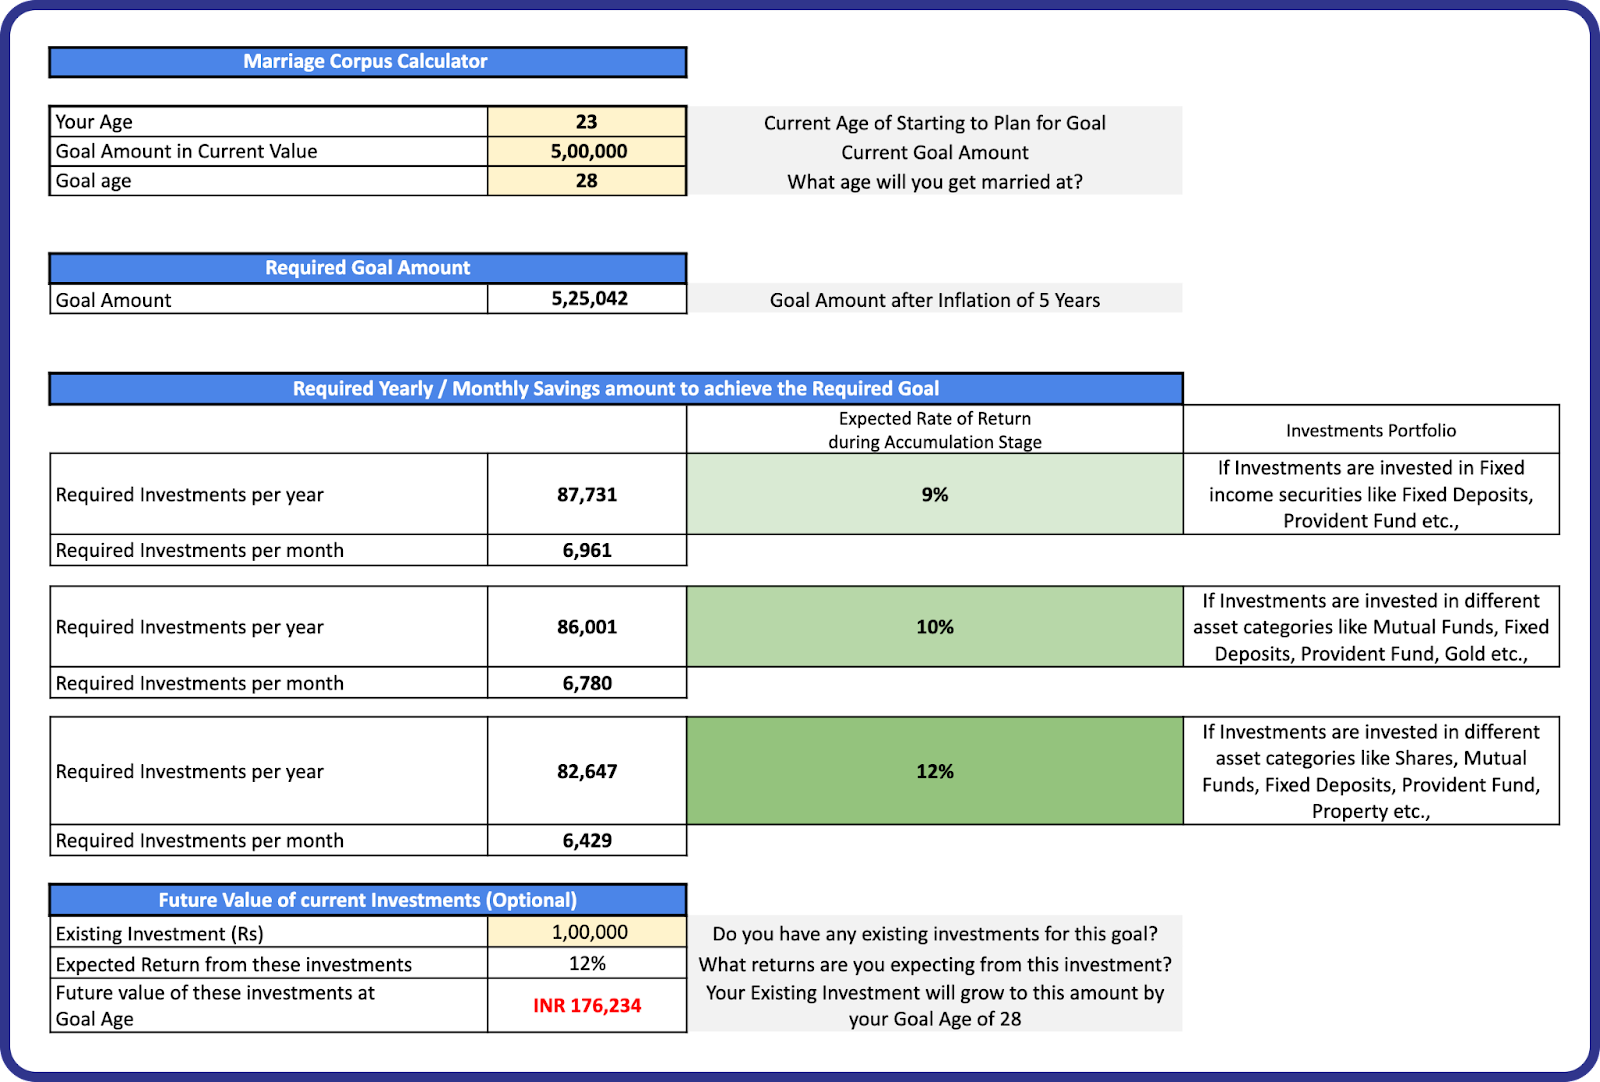
Step 3: Decide on the investment Portfolio
Once you enter all the data, the money you would need for your marriage when you get married will be displayed under the required goal amount.
Choose from one of the three portfolios depending on your risk tolerance.
Step 4: Start your SIP!
After choosing the investment portfolio that suits you best, feel free to kick off a SIP!
Car Goal Planning
Step 1: Input data
Enter your current age.
Input the amount that you would need if you were to buy your dream car today.
Enter the age at which you plan to buy your car.
Step 2: Input existing investments
If you have any existing investments or savings that you have been saving up for buying a car, add them to the sheet. If you don’t, enter 0.
Enter the expected returns from your existing investments.
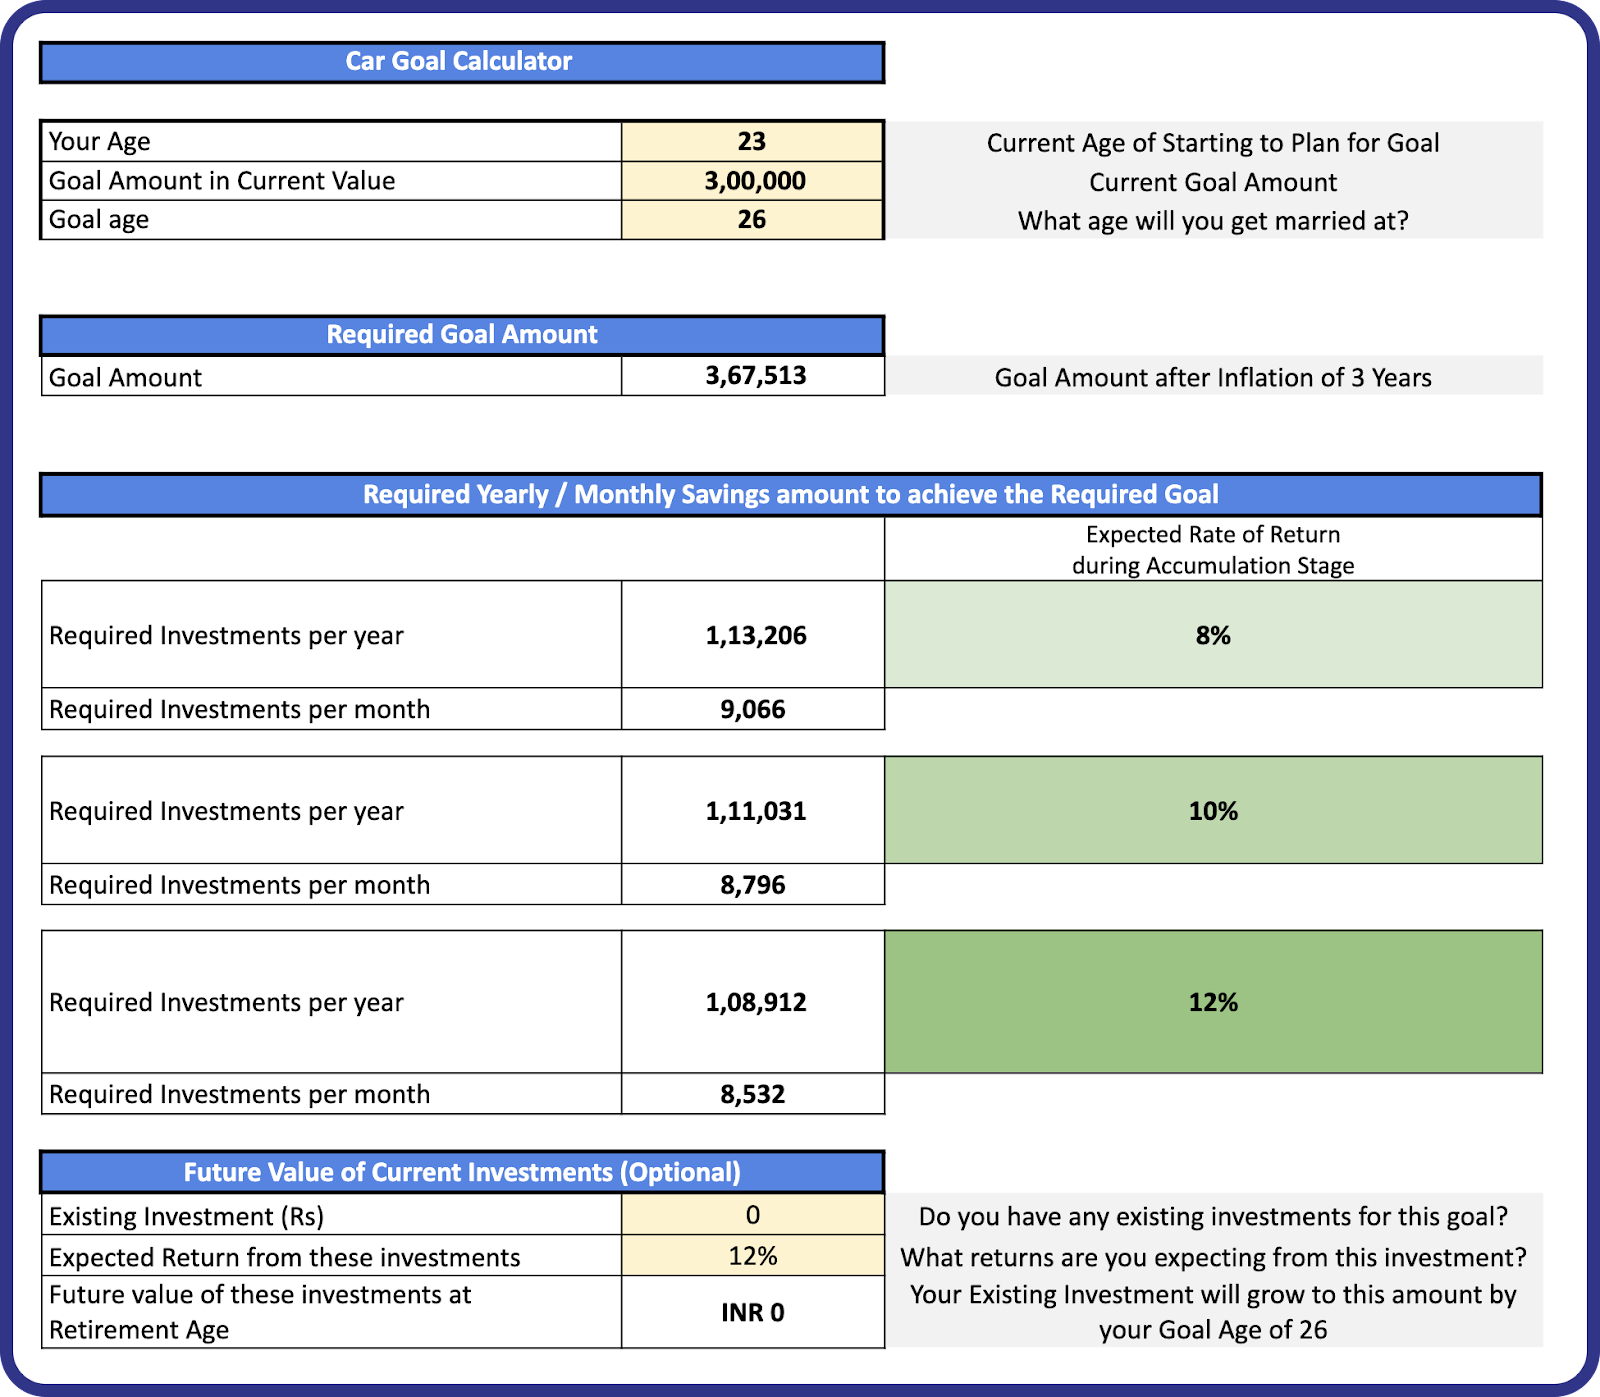
Step 3: Decide on the investment portfolio
Once you enter all the data, the amount you would need to buy the car when you reach your goal age will be displayed under the required goal amount.
Choose from one of the three portfolios depending on your risk tolerance.
Step 4: Start your SIP!
Once you’ve picked the investment portfolio you like, you’re ready to start your SIP.
House Goal Planning
The house goal planner assumes that you will make a down payment for the house and take the remaining amount as a loan. If you wish to pay the entire cost of the house in a lump sum, then input the downpayment amount as 100%.
Step 1: Input data
Enter your current age.
Enter the age at which you plan to build or buy a home.
Housing inflation in India has already been added.
Enter the amount that would cost if you were to buy your home today.
Enter the percentage of the amount that you are willing to pay as a down payment.
The amount after deducting the down payment will be taken out as a loan. Enter the tenure of the loan you are going to take.
Step 2: Input existing investments
If you have any existing investments or savings that you have been saving up for buying/building your house, add them to the sheet. If you don’t, enter 0.
Enter the expected returns from your existing investments.
Step 3: Analyze the calculations
Once you enter all the data, the calculations will be presented.
Analyze how much each of the calculations amounts to.
Analyze the EMI amount for the loan.
Step 4: Decide on the investment portfolio
Once you analyze the down payment amount you would need, select a portfolio that falls within your risk appetite to do an SIP. Thus, you would be able to build the corpus needed for the down payment.
Step 5: Start your SIP!
Once you’ve found the investment portfolio that suits you, go ahead and start your SIP!
Custom Goal Planning
You can use the custom goal planner sheet to plan any of your financial goals.
In this article, we discussed how to use marketfeed’s Excel calculator to plan your financial goals. You now know how much to invest every month to achieve your financial goals!
We have discussed the basics of long-term investing in one of our previous articles, which is buying and holding shares for a long period (>1 year). In this article, we will learn how to identify good quality stocks to invest in, when to invest, and how much to invest. Discover how to evaluate a company’s financial health, assess its growth potential, and make wise investment choices!
Long-Term Investing in Stocks vs Fixed Deposits
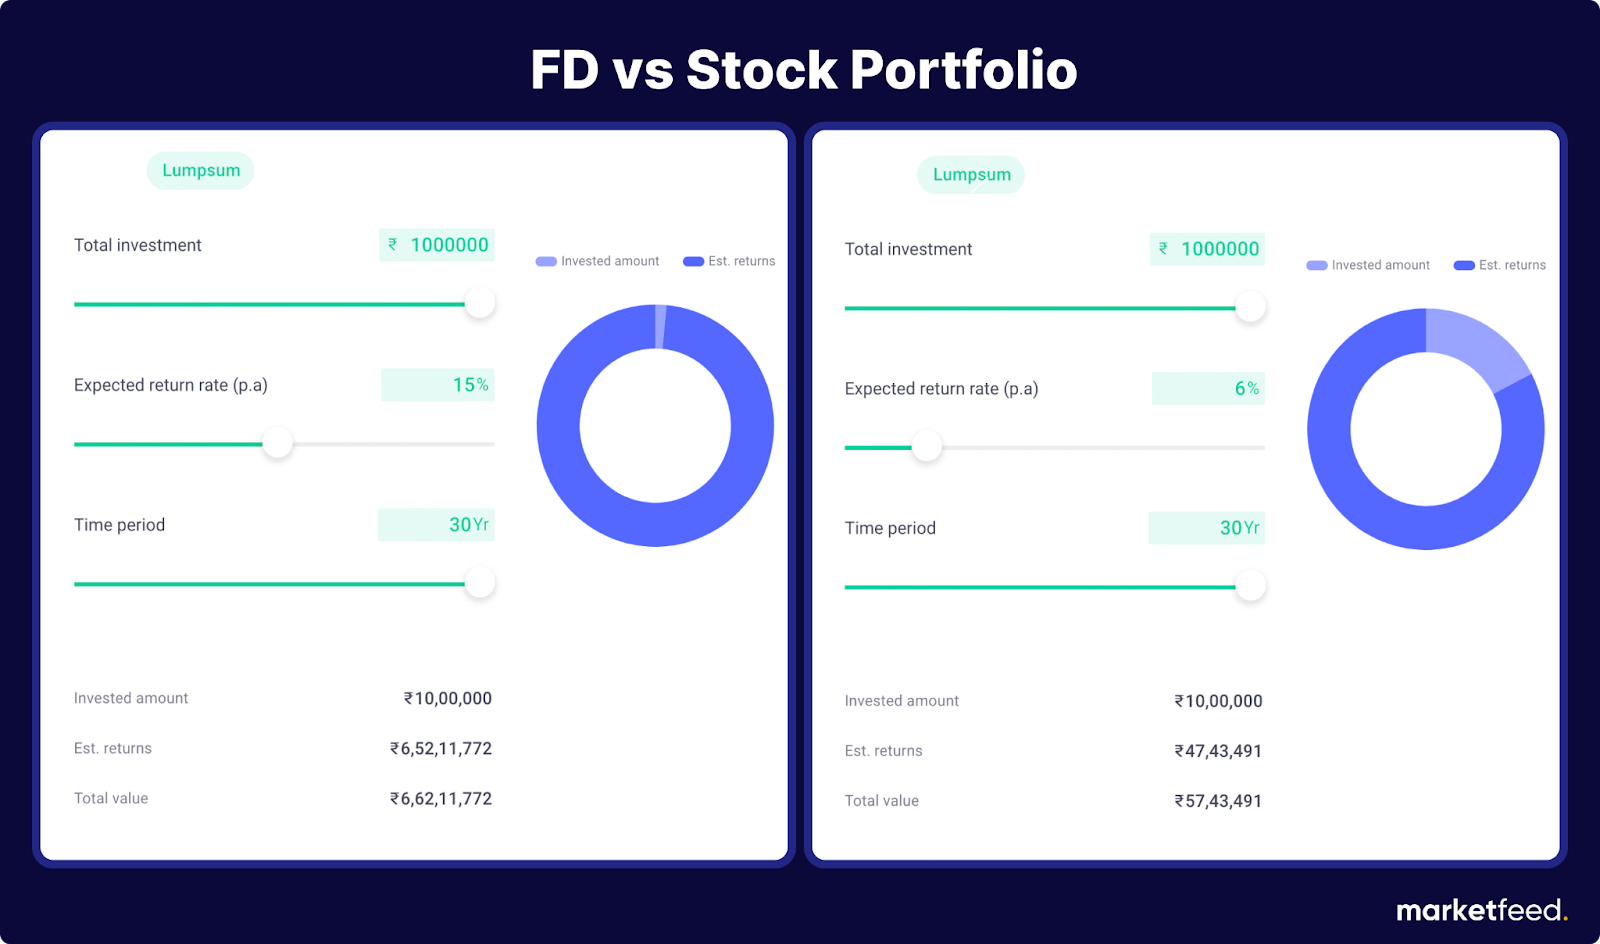
Investing in high-quality stocks will allow your hard-earned money to grow at a fast pace and become a sizable corpus over time. With this money, you can meet your financial goals can be met later in life. In contrast, if you simply deposit your money in a fixed deposit, it will only grow at a rate of 5-6% annually. However, investing in a good portfolio of stocks will grow at a rate of 15-18% or even higher each year. The returns between an FD and a stock portfolio differ wildly:
(Stock Portfolio on the left side, FD on the right)
The lump sum invested in a stock portfolio giving a 15% CAGR grew to ₹6.62 crores, while the amount invested in a fixed deposit giving a return of 6% every year grew to just ₹57 lakhs. The difference in the corpus is wildly different. This is why you should invest in a stock portfolio instead of traditional methods like fixed deposits or bank savings accounts.
How to Find Good Quality Stocks to Invest in?
The direct answer to the question is: carefully analyze companies thoroughly. To find high-quality stocks, we should deeply study the overall business and financials of various companies across sectors. We must understand and analyze a company’s business model, its financial performance and position, its market, its competitors, its management, and even the economic factors that could affect the future growth and prospects of the business. This type of study is known as fundamental analysis. Fundamental analysis is a method of determining a stock’s real or “fair market” value. We will learn how to do fundamental analysis in the upcoming modules.
You can do fundamental analysis to understand if a company can be invested in. However, when it comes to picking companies for long-term investments, there are two schools of thought in the market. They are:
1. Value Investing
By doing a fundamental analysis, we will arrive at the intrinsic or true value of a company. In value investing, if the intrinsic value of the company is lower than the current market value, then that company is a buy candidate. We will buy the stock and eventually make a profit when the current value increases to the intrinsic value. Veteran investors like Warren Buffet and the late Rakesh Jhunjhunwala are renowned value investors.
2. Growth Investing
In growth investing, investors do not give much importance to the true valuation of a company. Suppose the fundamentals of a company are good and its business is growing. In that case, the investor buys the stock even though the current market value is higher than the true value, assuming that the company will keep growing in the future and hence profit from it.
What to Study in Fundamental Analysis?
While doing fundamental analysis, there are three things we should study:
1. Management
We should study the management of a company. Efficient and effective management is the key to the success of a business. If the management is poor, then the business is on a path to failure. While analyzing the management, we must study the executives who run the business, what their strengths and weaknesses are, their background, their potential, their past, and current performance, etc. We must also see if the management is drawing a high salary even though the business is doing poorly.
2. Business
We must study the business model of a company and its current & future relevance. Find out if the business excites you as well.
3. Valuation
While studying a business, we must look into its financials such as revenue, expenses, profits, etc. We can also look into the dividends the company distributes to its shareholders. We can judge a company from a purely financial perspective based on its future prospects and potential.
The three main areas of study can be called MBV, which stands for Management, Business, and Valuation.
Factors to Consider in Fundamental Analysis
The two factors to be considered when doing fundamental analysis are:
Qualitative Factors
1. Business Model – A business model is an outline of how a company plans to make money. Understanding the business model is an important factor to consider while doing fundamental analysis. You should only consider a company for investments if its business model excites you.
2. Management Background – A strong idea of who runs the business is an important element of fundamental analysis. We need to analyze if the management is capable of running the business and taking it to new heights.
3. Ethics – All businesses need to be ethical in all their activities. It also has to be ethical toward all its stakeholders.
4. Corporate Governance – It refers to the corporate structure of a company. The efficiency and productivity of a business depend on its corporate governance.
5. MOAT – A MOAT is a company’s competitive edge over its competitors. It’s a feature that makes the company highly resistant to competition from other firms. For example, Fevicol (produced by Pidilite Industries) has a moat advantage because it is extremely difficult for another company to reach its level of brand value and sales.
6. Industry – It is also important to analyze the industry in which a company operates. Even if a company is performing well now, it may not be in the future due to a lack of opportunities for the company to grow.
Quantitative Factors
1. Earnings & Growth – We should analyze the earnings or revenue of a company to understand how much money it’s making. An analysis of the trend of revenue over different years should also be considered to understand if a company is growing or not.
2. Expenses – We should be aware of how much money a company is spending and where those expenses are going. Excessive spending is not favourable. However, if the money is allocated toward activities for business expansion and development, it will lay the foundation for future growth.
3. Profit & Margin – The profit that a company makes helps us to understand if its business is growing.
4. Assets & Liabilities – A thorough analysis of the assets and liabilities of a company is a must.
5. Debt – If a company has too much debt burden, it’s unfavourable as there is a high chance of falling into a debt trap.
Where to Find Qualitative & Quantitative Data of Listed Companies?
The annual report of a company contains all the necessary information from which we can collect quantitative and qualitative data. An annual report is a company’s yearly report to shareholders, documenting its activities and finances of the previous financial year. It is a 300-400 page document containing all vital information about a company.
The qualitative factors of a company can be found in its annual report across various sections.
The quantitative factors of a company can be found in the financial statements section of its annual report.
In addition to the annual report, other sources such as videos related to the company, interviews with the founders and management, business magazines, articles, etc., can be used to collect data.
When to Buy Stocks?
The two ways in which people invest in stocks are:
1. Lump Sum Investment
When we invest a large amount into stocks all at once, it is called a lump sum investment. People usually do this when they receive bonuses or any other large sum of money. However, the drawback of this method is that we cannot maintain a better average price. If we do a lumpsum investment and the stock keeps on falling, we cannot take advantage of this price discount as all the money was invested in a single go previously.
2. Systematic Investment Plan (SIP)
SIP is a method of investing a fixed sum regularly into a portfolio. Most salaried people have a regular income every month. Out of this, they invest a certain percentage as SIP. A better average price can be maintained in this method as the purchase price will be lower and higher sometimes.
When to do SIP?
The two approaches to SIP investments are:
1. Fixed Date/Time
The most common method is to invest on a particular date or time. Some people invest every month, while others invest every week. People buy stocks blindly on a specified date or maybe the first working day of every month.
2. At low prices using technical analysis
Some people also do technical analysis to find if the stock prices are low or high and invest if the prices are low. If technical analysis implies that the stock is overpriced now, the investor waits until the stock price is low. We will discuss Technical analysis in detail in the upcoming module.
The first method, i.e., investing regularly on a fixed date/time is the most convenient. As our aim is to meet the benchmark, it is not necessary to take the extra effort of technical analysis for doing SIPs in the long term.
How Much to Invest For the Long Term?
The most commonly used method of investing is the 50-30-20 rule, which suggests that 50% of your income should cover your basic needs, 30% should go towards your wants, and the remaining 20% should be invested. However, this method cannot be used by people with low incomes as most of the amount will be used for basic needs. Also, if our income increases, our expenses will more or less be similar so that we will be able to invest. So our aim should be to invest as much as possible. However, it is a very subjective question as needs and financial goals vary from person to person.
The best way to determine how much you should invest is to calculate how much money you will need during retirement. To reach that number, you should consider your current lifestyle and what your lifestyle will be after retirement, among other things.
In one of our next articles, we will learn how to calculate the corpus you’ll need when you retire, how much to invest to reach that corpus and plan long-term & short-term financial goals using an Excel calculator.
Whether you’re a seasoned investor or a curious newbie, navigating the world of buying and selling stocks can feel like deciphering an ancient code. But fear not! Our comprehensive guide offers step-by-step instructions and expert tips to help you buy and sell stocks.
For this tutorial, we will be using Zerodha’s mobile app— Kite.
How to Buy a Stock?
Step 1: Add the stock to your watchlist
Once you perform the necessary analysis, add stocks you want to buy to a watchlist.
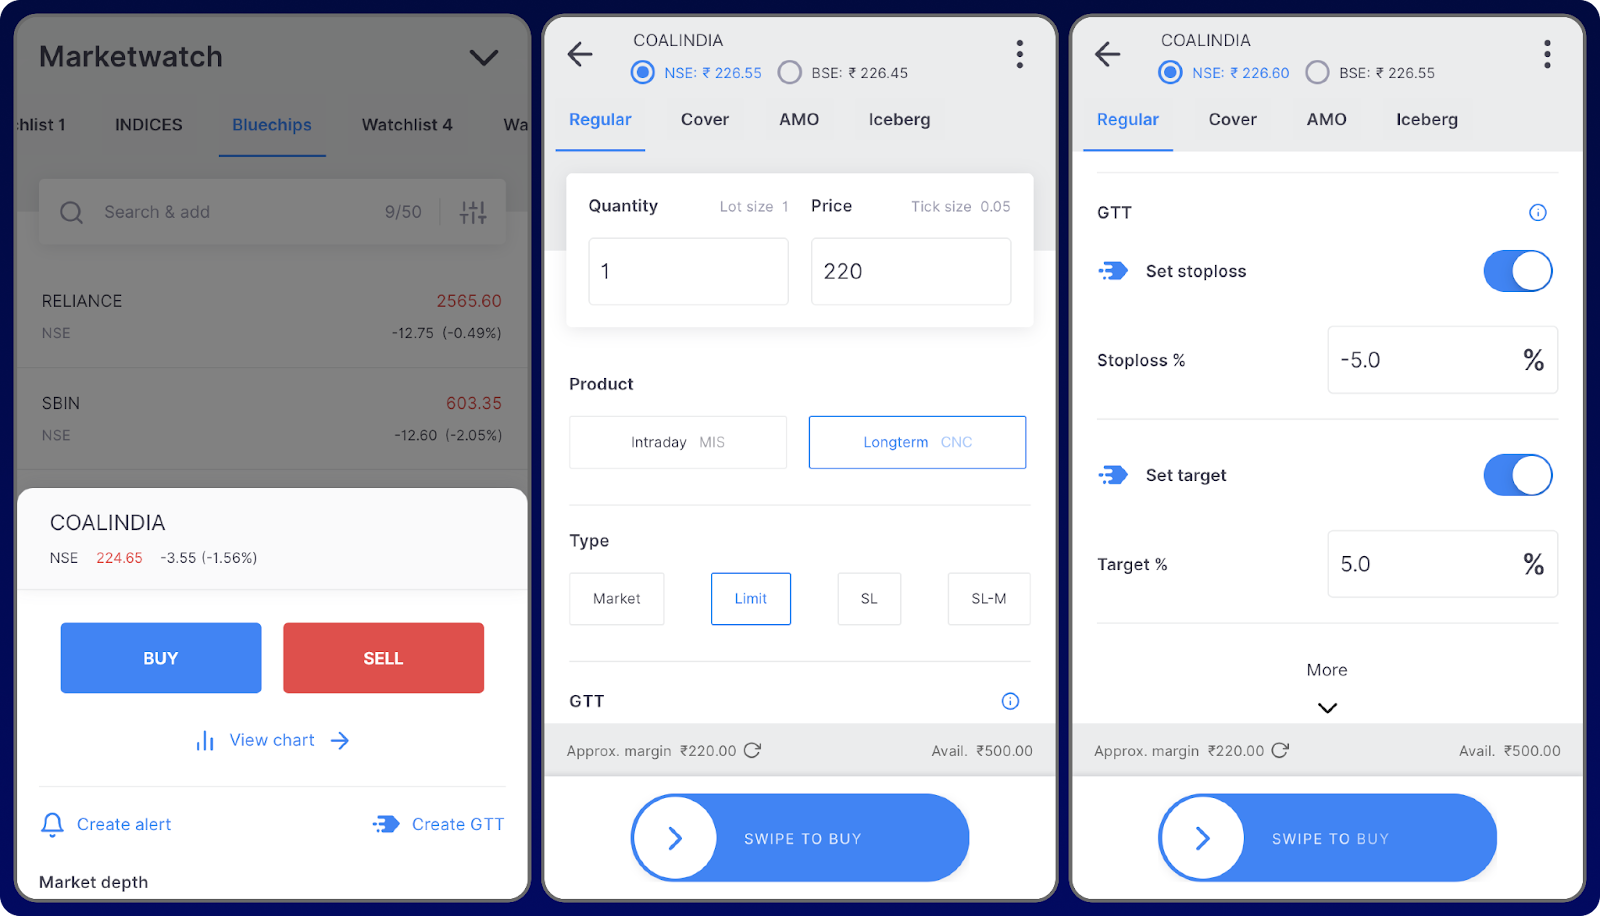
Step 2: Invoke the order placement window
Click on the name of the stock you want to buy and press the buy button to invoke the order placement window.
Step 3: Select the order mode
Use regular orders for now.
Step 4: Input the quantity
Enter the quantity of the stock that you want to buy.
Step 5: Select the product type
Select Longterm or CNC (Cash and Carry) product type to take delivery of the stock to your Demat account. Use MIS (Margin Intraday Square-off) for intraday order placements.
Step 6: Select the order type
To make things simple, we will select market order.
Step 7: Enter the limit price
Skip this step if you have selected a market order. Enter the price at which you want to buy the stock if you choose a limit order.
Step 8: Set GTT orders if required
Place a GTT stop loss and target order if needed.
GTT in Zerodha stands for “Good Till Triggered.” It is a feature that allows users to place an order that stays active until the trigger condition is met. The validity of the trigger is one year, and an account can have a maximum of 250 active GTTs simultaneously. GTT orders can be placed for buying or selling stocks, and they are triggered and placed only during market hours.
Step 9: Input the order validity instructions
Select day order.
Step 10: Swipe!
Swipe on the ‘Swipe to Buy’ button to place the order. The order will be immediately executed if you have placed a market order. Limit and stop-loss orders will be executed once the conditions are met.
Once the order is executed, it will show up on the positions tab under ‘Portfolio’. It will move to the holdings tab the next day. The sign “T1” will be shown beside the stock on the next day and will disappear on the third day.
How to Sell a Stock?
Follow the below steps to sell stock from your holdings:
Step 1: Invoke the order placement window
Click on the name of the stock you want to sell from your holdings and click on “Exit” to invoke the order placement window.
Step 2: Select the order mode
Use a regular order.
Step 3: Input the quantity
Enter the quantity of the stock you want to sell from your holdings.
Step 4: Select the product type
Select Longterm or CNC (Cash and Carry) product type.
Step 5: Select the order type
We will select market order for the sake of simplicity.
Step 7: Enter the Limit Price
Skip this step if you have selected a market order. Enter the price at which you want to sell the stock if you choose a limit order.
Step 8: Input the order validity instructions
Select day order.
Step 9: Swipe
Swipe on the ‘Swipe to Sell’ button to place the order.
Step 10: Authorise the transaction
CDSL TPIN is a mandatory process required for performing sell transactions online. Click on the “Continue” option. You will be redirected to CDSL’s page, where you are prompted to enter a TPIN. Next, enter the OTP you received and click on “Verify” to complete the authorization process.
Since you have a new account, you will have to generate a new TPIN by following the instructions on the screen. You will receive the TPIN via text message and email, which you should save for future transactions.
The TPIN has to be reentered every day to conduct transactions. You can pre-authorize it by using the “Authorization” option in holdings before the markets open every day.
Step 11: Swipe, again!
Once authorization is completed, swipe the ‘Swipe to Sell’ button to place the sell order.
The order will be immediately executed if you have placed a market order. Limit and stop-loss orders will be executed once the conditions are met.
What is TPIN & How to Skip it?
CDSL is a depository, and it has created a security measure called TPIN Authorization to ensure that the broker doesn’t misuse your holdings. TPIN is a crucial component of the stock trading process. It comes in the form of a six-digit passcode that must be entered to authorise the broker to sell selected stocks from your Demat account. The CDSL TPIN security mechanism enables investors to easily authorize any account-related action online.
Giving a Power of Attorney (PoA) to your broker is the only way to skip this step. Power of Attorney (POA) is a document that gives the stockbroker authorization to debit your shares from your Demat account whenever you sell your holdings. If your POA is mapped to your Zerodha account, you will be able to sell your holdings without a prompt asking you to authorize transactions using TPIN.
To give a POA, go to Zerodha’s website and download the POA form. Fill it up and physically mail it to Zerodha’s office.
In conclusion, buying and selling stocks is a very simple process. However, you have to be focused while placing orders to avoid mistakes that could lead to losses!
Suppose you have a current annual expense of ₹16 lakh. You would need approximately ₹1.43 crore every year to meet your expenses when you retire 32 years from now! You’d need a retirement corpus of ₹15 crores to be financially free.
We also saw investment portfolios that you can invest in to achieve this retirement corpus. But we didn’t discuss where exactly you need to invest to achieve those returns, or rather, where exactly to invest for financial freedom!
Time Horizon-Based Portfolio Selection
You can select portfolios with different returns based on the investment time horizon of your goal. Following are the different investment time horizons:
1. Short-term Goals
These are goals that are to be achieved in the next 1-3 years.
High exposure is to be given to safe asset classes as the goal is relatively closer.
A return of 8% CAGR can be targeted for these goals.
2. Medium-term Goals
These are the goals that are to be achieved in the next 4-7 years.
More exposure is to be given to safe asset classes, while a small exposure can be given to the return-generating asset class, i.e., equity.
A return of 10% CAGR can be targeted for these goals.
3. Long-term Goals
These are goals that are to be achieved in the next 8 years or later.
You should give high exposure to equity as the goal is relatively far away.
A reasonable exposure should also be given to safe asset classes to ensure the stability of the portfolio.
Returns of 16-20%+ CAGR can be targeted for these goals.
We have three different portfolios with conservative, moderately aggressive, and aggressive approaches giving 12%, 15%, and 18% CAGR, respectively.
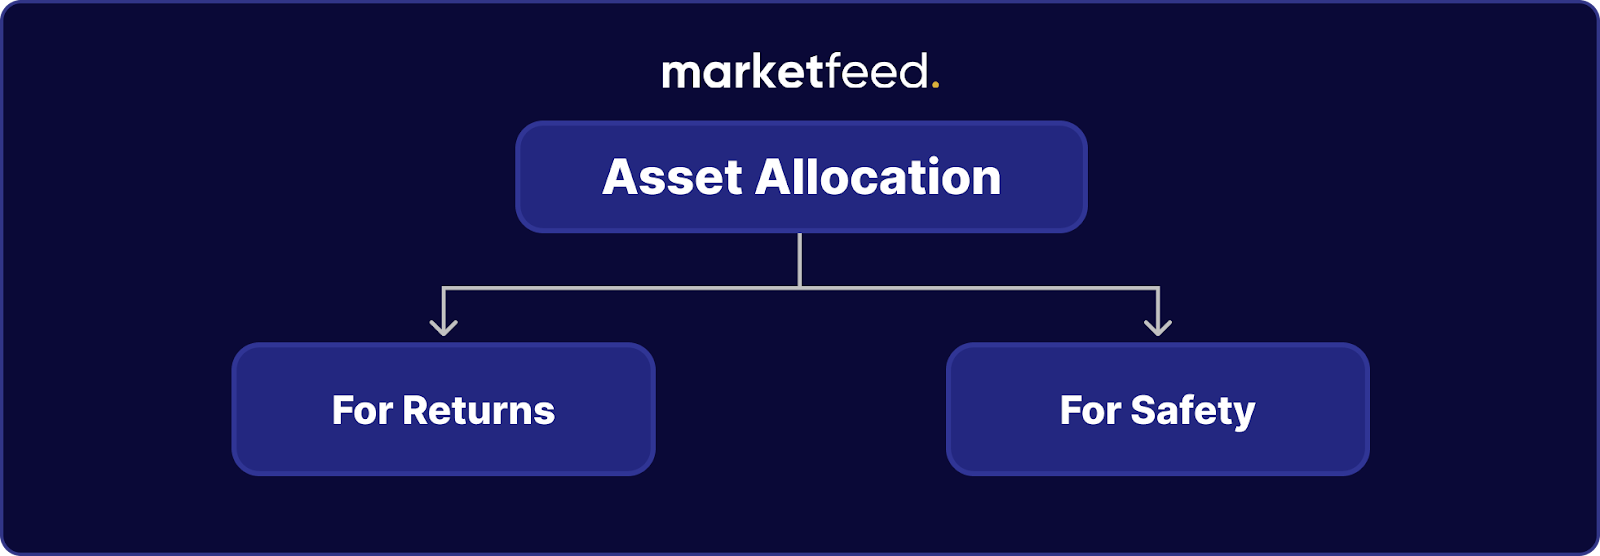
Asset Allocation
We allocate our investments into different asset classes for returns and safety. We will be allocating our investments to three different assets:
1. Equity
Equity refers to the shares of companies.
Returns from equity investments are very high, and so is the risk.
You can expect returns of 12-20% CAGR depending on the stock.
You can invest in equity in two ways:
Direct Stock Investments – buying stocks like Reliance and Tata Motors via a broker (like Zerodha, Groww, and Fyers).
Equity Mutual Funds. Learn about mutual funds here.
2. Debt
Debt refers to the investment made in bonds.
When a company needs capital, it can borrow money from the public in consideration of an interest payment. These payments are fixed.
Returns in debt are moderate but the risk is low.
You can expect returns of approximately 6-8% CAGR from debt investments.
You can invest in debt via debt mutual funds.
3. Gold
Gold has given a very good historical performance.
You can expect returns of 5-6% CAGR by investing in gold.
You can invest in gold via Gold BeES or Sovereign Gold Bonds (SGBs). To learn about Gold BeES and SGBs, click here.
How Much to Invest in Each Asset:
You can click here to access marketfeed’s calculator.
It’s a READ-ONLY VERSION. You have to make a copy of the document to edit it.
Instructions to Use the Calculator
1. The link will take you to the read-only version of our “Where to Invest” Excel Calculator. Click on ‘Make a Copy’ under the File tab to create a copy of the calculator. You could also download the file as .xslx to use the calculator on Microsoft Excel.
2. Edit or enter figures in the yellow cells only. Do not edit any cells other than those in yellow as it will interfere with the preset formulas.
3. The calculator has 8 sheets:
8% Short-Term Goal – To calculate asset allocation for short-term goals with a targeted return of 8% CAGR.
10% Medium-Term Goal – To calculate asset allocation for medium-term goals with a targeted return of 10% CAGR.
12% Conservative Long-Term Goal (No ELSS) – To calculate asset allocation for long-term goals through a conservative approach with a targeted return of 12% CAGR with no allocation to the ELSS category. To learn about Equity Linked Savings Scheme (ELSS), click here.
12% Conservative Long-Term Goal (ELSS) – To calculate asset allocation for long-term goals through a conservative approach with a targeted return of 12% CAGR with allocations to the ELSS category.
15% Moderately Aggressive Long-Term Goal – To calculate asset allocation for long-term goals through a moderately aggressive approach with a targeted return of 15% CAGR with allocations to the ELSS category.
16-20% + Aggressive Long-Term Goal – To calculate asset allocation for long-term goals through an aggressive approach with a targeted return of 16-20%+ CAGR with allocations to the ELSS category.
8% Short-Term Goal
Here are the steps to find your allocations:
1. Enter the Goal Name.
2. Input how far away your goal is (in years).
3. Input the SIP amount.
The SIP amount adjacent to the 8% portfolio presented by the goal planning calculator should be entered here.
4. Start your SIP!
The calculator will display to you the recommended fund to invest in, along with its respective category and asset class. Additionally, it will also show you the amount to be invested via SIP in different funds. It also shows the allocation-based return and a pie chart representing the allocation weightage.
The SIP amount adjacent to the 10% portfolio presented by the goal planning calculator should be typed here.
4. Start your SIP!
The calculator will show which fund to invest in, what category and asset class it belongs to, and the SIP amount to be invested in different funds. It also shows the allocation-based return and a pie chart representing the allocation weightage.
12% Conservative Long-Term Goal (No ELSS)
Here are the steps to find your allocations:
1. Enter Goal Name
2. Input how far away your goal is (in years).
3. Input the SIP amount
The SIP amount adjacent to the 12% portfolio presented by the goal planning calculator should be entered here.
4. Start your SIP!
The calculator will mention which fund to invest in, what category and asset class it belongs to, and the SIP amount to be invested in different funds. It also shows the allocation-based return and a pie chart representing the allocation weightage.
12% Conservative Long-Term Goal (ELSS)
Here are the steps to find your allocations:
1. Enter Goal Name
2. Input how far away your goal is (in years).
3. Input the SIP amount
The SIP amount adjacent to the 12% portfolio presented by the goal planning calculator should be entered here.
4. Start your SIP!
The calculator will display to you the recommended fund to invest in, along with its respective category and asset class. Additionally, it will also show you the amount to be invested via SIP in different funds. The investment strategy allocates the initial ₹1.5 lakhs of yearly investment to ELSS funds. It also shows the allocation-based return and a pie chart representing the allocation weightage.
15% Moderately Aggressive Long-Term Goal (ELSS)
Here are the steps to find your allocations;
1. Enter Goal Name
2. Input how far away your goal is (in years).
3. Input the SIP amount
The SIP amount adjacent to the 15% portfolio presented by the goal planning calculator should be typed in here.
4. Start your SIP!
The calculator will display to you the recommended fund to invest in, along with its respective category and asset class. Additionally, it will also show you the amount to be invested via SIP in different funds. The investment strategy allocates the initial ₹1.5 lakhs of yearly investment to ELSS funds. It also shows the allocation-based return and a pie chart representing the allocation weightage.
16-20% + Aggressive Long-Term Goal
Here are the steps to find your allocations;
1. Enter Goal Name
2. Input how far away your goal is (in years).
3. Input the SIP amount
The SIP amount adjacent to the 16% portfolio presented by the goal planning calculator should be entered here.
4. Start your SIP!
The calculator will show which fund to invest in, what category and asset class it belongs to, and the SIP amount to be invested in different funds. The investment strategy allocates the initial ₹1.5 lakhs of yearly investment to ELSS funds and allocates a part of the investment to a direct stock portfolio, which will be learned to build in the coming modules. It also shows the allocation-based return and a pie chart representing the allocation weightage.
In conclusion, there is no one-size-fits-all answer to the question of where and how much to invest to achieve financial freedom. The calculators in the previous and current chapters will help you find answers to these questions. In the next module, we will learn how to read and analyze the annual report and financial statements of a company, perform ratio analysis, and build a well-diversified stock portfolio on our own.
At the heart of understanding a company’s financial health lies a crucial tool – financial statements. If you’ve ever found yourself wondering about the numbers and terms thrown around in annual reports or business discussions, you’re not alone. In this article, we’ll unravel the mystery behind each financial statement, breaking down their significance, components, and how they serve as invaluable guides for both seasoned and new investors.
What are Financial Statements?
Financial statements are the vital documents through which a company communicates its financial performance and position to its stakeholders. The role of financial statement analysis is to use the information in a company’s financial statements, along with other relevant information, to make investment decisions.
Investors aren’t the sole users of financial statements; a company’s management also relies on them to guide financial decision-making. Creditors use these statements to check if the company will be able to repay the loan along with interest on time. Investors use them to understand the company’s ability to earn profits and generate cash flow in the future.
How are Financial Statements Prepared?
Financial statements are prepared using financial reporting standards. They provide principles for creating financial reports and determine the types & quantity of information that must be provided to those who use them. Institutions such as the International Accounting Standards Board (IASB) and Financial Accounting Standards Board (FASB) create these standards. These organisations are typically private sector and self-regulated. Their board members include experienced accountants, auditors, users of financial statements, and academicians.
Most countries follow the International Financial Reporting Standards (IFRS) developed by IASB. These standards ensure quality in the financial statements. Relevance, faithful representation, comparability, verifiability, timeliness, and understandability are the primary qualities of financial statements.
Regulatory authorities such as SEBI in India and SEC in the US ensure that these financial statements are prepared properly.
What are the Different Financial Statements?
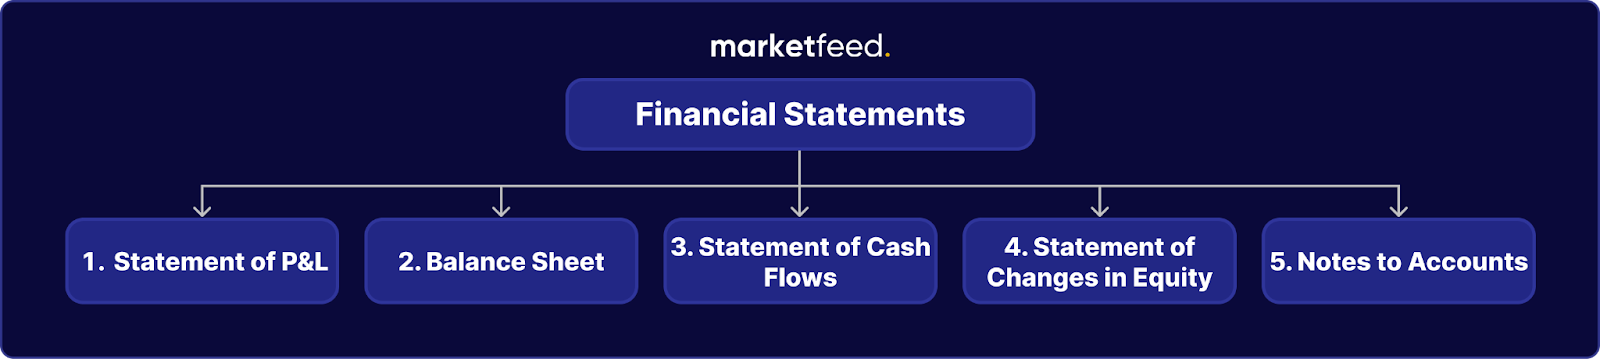
There are five important financial statements for a company. They are:
1. Statement of Profit & Loss
2. Statement of Financial Position (Balance Sheet)
3. Statement of Cash Flows
4. Statement of Changes in Equity
5. Notes to Accounts
Notes to accounts or footnotes are a part of the financial statements which show the details of each item.
Standalone vs Consolidated Financial Statement
Companies with subsidiaries have two sets of financial statements in their annual report: standalone financial statements and consolidated financial statements. Standalone financial statements only include the financials of the company itself and do not include the financials of their subsidiaries. Consolidated financial statements include the financials of the company along with its subsidiaries.
For example, Company B is a subsidiary of Company A. The standalone financial statements of Company A include only the transactions specific to Company A. On the other hand, in consolidated financial statements, the transactions of both Company A and Company B are included.
We always consider the consolidated financial statements because the business transactions of the subsidiary also affect its parent company, as the ownership lies with the company.
In conclusion, financial statements are strategic roadmaps. The numbers might look a bit tricky at first, but once you get the hang of it, you’re in control. Armed with this knowledge, you will be better equipped to navigate the complex landscape of financial decisions. So, as you delve into the world of balance sheets, income statements, and cash flow reports, may your financial wisdom soar, and your decisions stand on solid ground.
Let’s learn how to navigate a broker terminal, explore the various features it offers, learn the different types of orders available, how to fund your account, and finally how to buy & sell a stock.
For this tutorial, we will be using Zerodha’s mobile app— Kite. We recommend you add some funds to your trading account and follow this tutorial so that you can gain first-hand experience with the broker’s trading terminal.
Understanding the Broker’s Terminal
When you first log in to your account on Zerodha’s Kite app, you will be greeted with the watchlist tab by default. The app has five main tabs. The top left corner of the app displays the name of each tab.
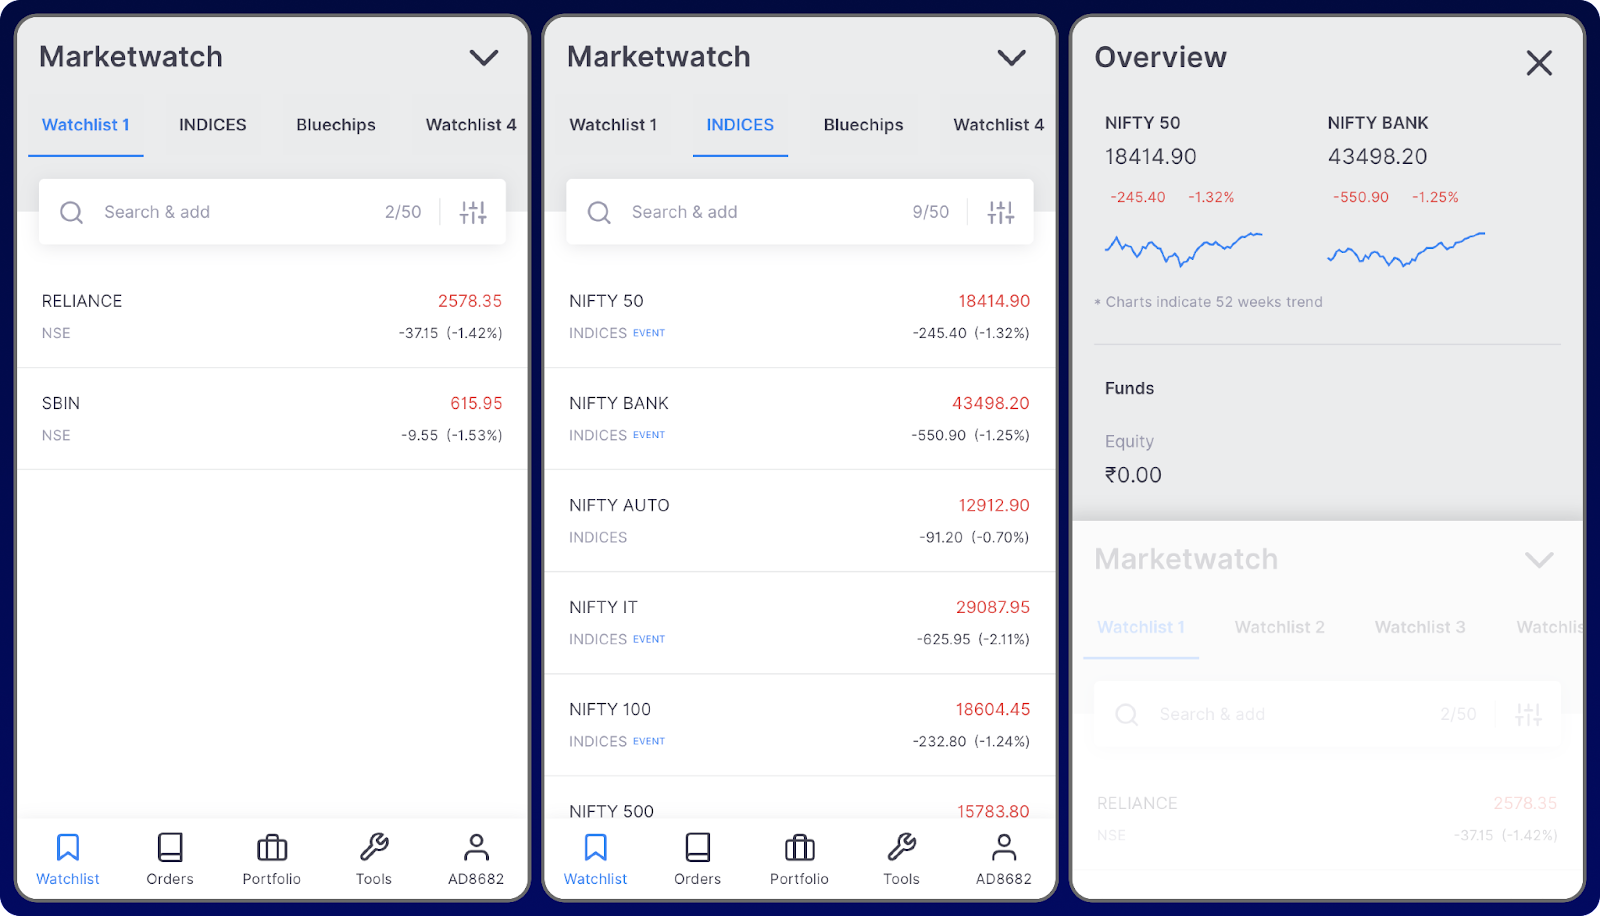
1. Watchlist & Overview
The watchlist tab contains a list of securities to which you can add stocks and other financial instruments and monitor them for potential trading and investing opportunities. You can customize up to seven watchlists based on your needs. The dropdown arrow in the top left of this tab brings down the overview feature, which shows brief data on the prices of NIFTY50 & BankNifty and the funds in your account.
How to Add a Stock to Your Watchlist?
1. Select any watchlist from the tab 2. Click on search & add 3. Type the name of a stock. eg: Reliance 4. Click on the + icon parallel to the stock name 5. Click on < arrow on the top left 6. The watchlist will display the stock you selected
To add stocks to other watchlists, click on any of the watchlists from the top panel and repeat the steps. You can add up to 50 stocks to a watchlist.
How to Rename a Watchlist?
1. Click and hold on the name of the watchlist you want to change
2. Click on the edit icon
3. Type the new name
4. Click on save, and your watchlist will be renamed
How to Remove Stocks From the Watchlist?
1. Click and hold on the watchlist name
2. Click on the delete icon parallel to the stock that you want to delete
3. Click on save
How to Reorder Stocks in Your Watchlist?
1. Click and hold on the name of the watchlist
2. Click on the dots to the left of the stock’s name, and drag up or down to change the order
3. Click on save
How to Filter & Sort Your Watchlist?
1. Click on the configure icon to the right of the search bar 2. Under the filter section, select or unselect NSE & BSE to filter your watchlist according to the stock exchange 3. Under the sort section, there are three parameters:
A-Z Alphabetically – Sorts the watchlist in alphabetical order
% Change – Sorts the watchlist on % change in price
LTP – Sorts the watchlist in ascending or descending order of LTP
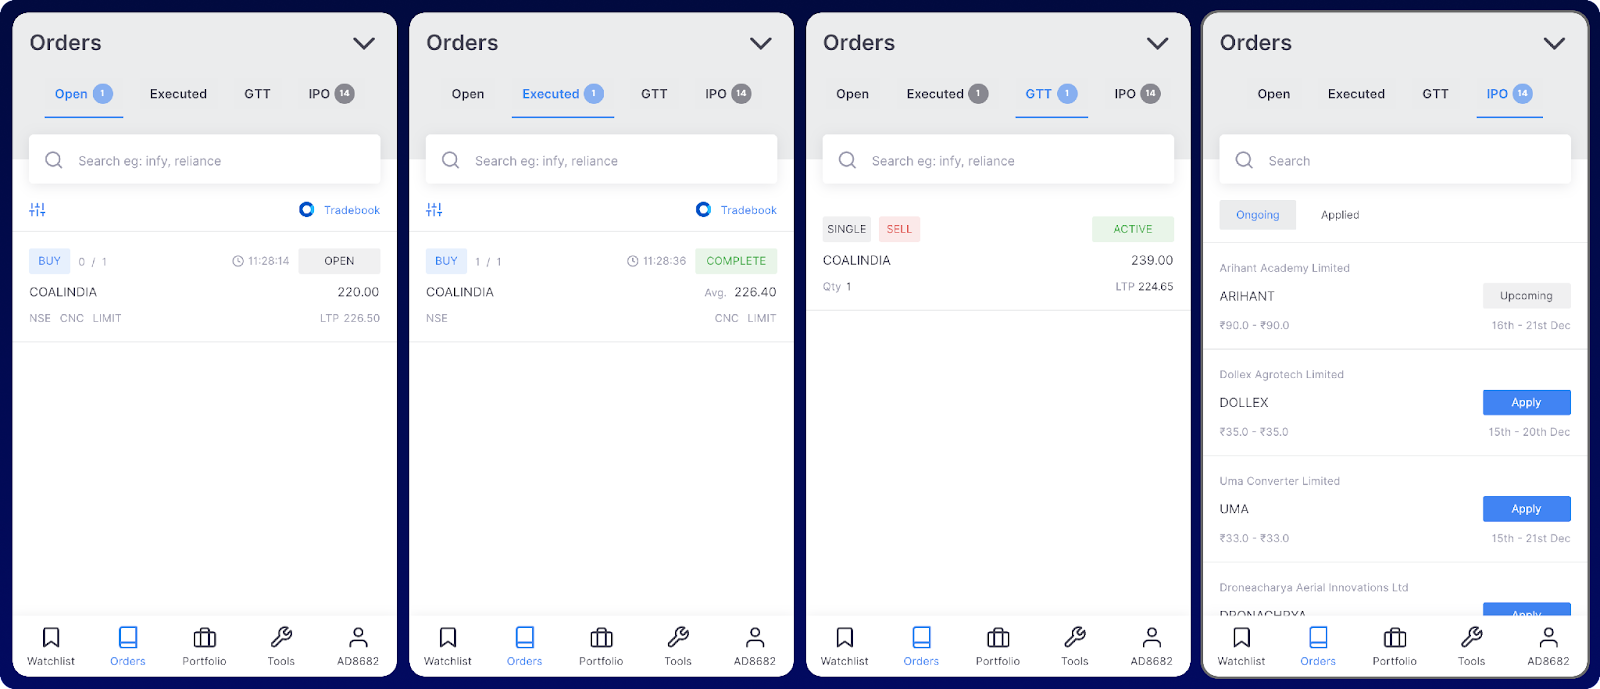
2. Orders
An order is an instruction given to the broker to buy or sell a stock. There are 4 subtabs in the orders tab:
1. Open: When you place an order, it will be shown here until the order gets executed
2. Executed: Once the order is executed and the stock is bought, it will be shown in the executed tab.
The details in open and executed tabs are only valid for a day and clear themselves on the next day.
3. GTT: GTT stands for Good Till Triggered. This tab shows all the GTT orders placed with the broker. We will learn about GTT in the coming sections.
4. IPO: This section contains details about ongoing IPOs and applied ones will be shown here.
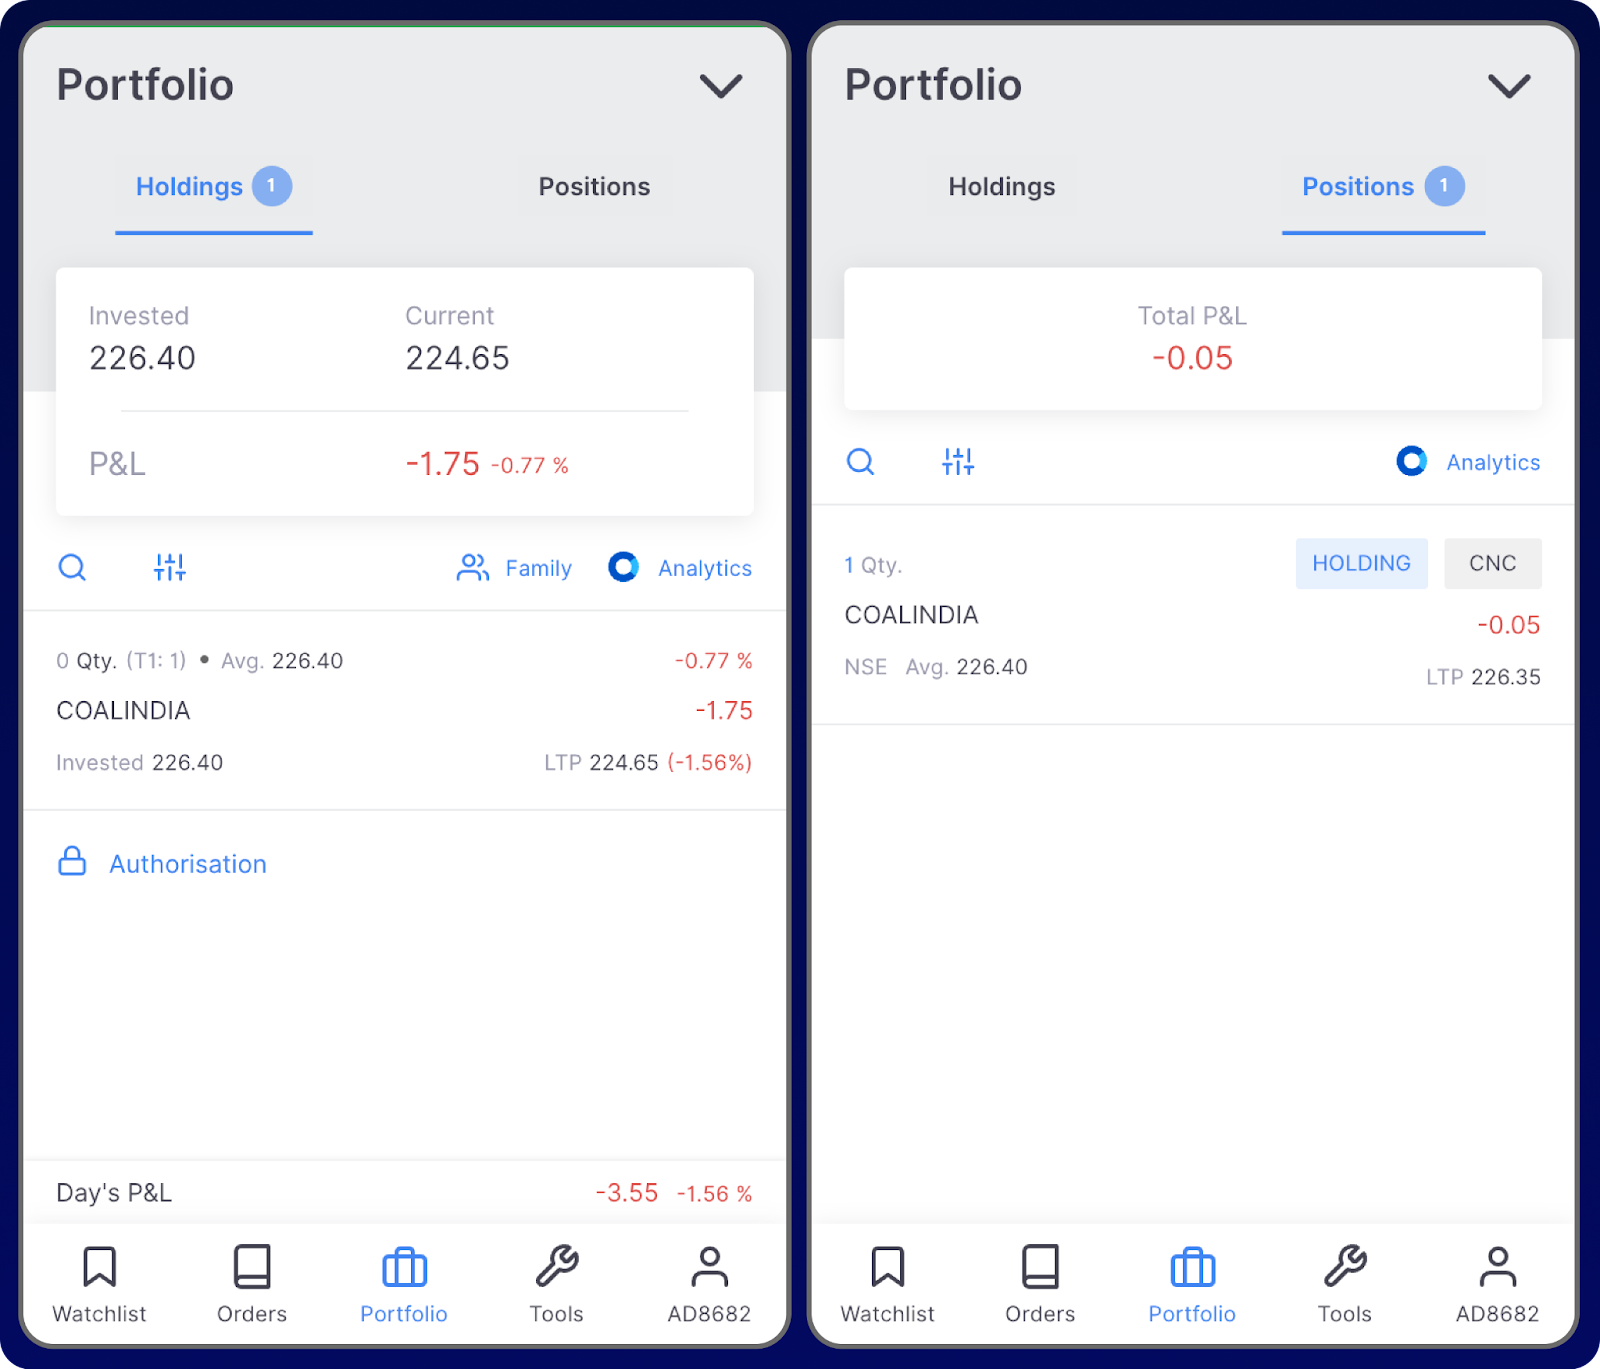
3. Portfolio
There are two subtabs in the portfolio tab:
1. Holdings
This tab displays all the stocks that are in your Demat account. The feature not only presents a summary of the holdings, including the invested amount, current value, and returns generated but also provides details about each individual stock holding.
T1 mark near a stock means that it is a T1 holding. T1 will disappear the next day.
Day’s P&L shows the changes in the profit or loss of the holdings on any given day.
2. Positions
This tab shows all the trades/investments that you took on that particular day.
When you buy a stock, it will be shown in the positions tab on that day and will be shown in the holdings tab the next day.
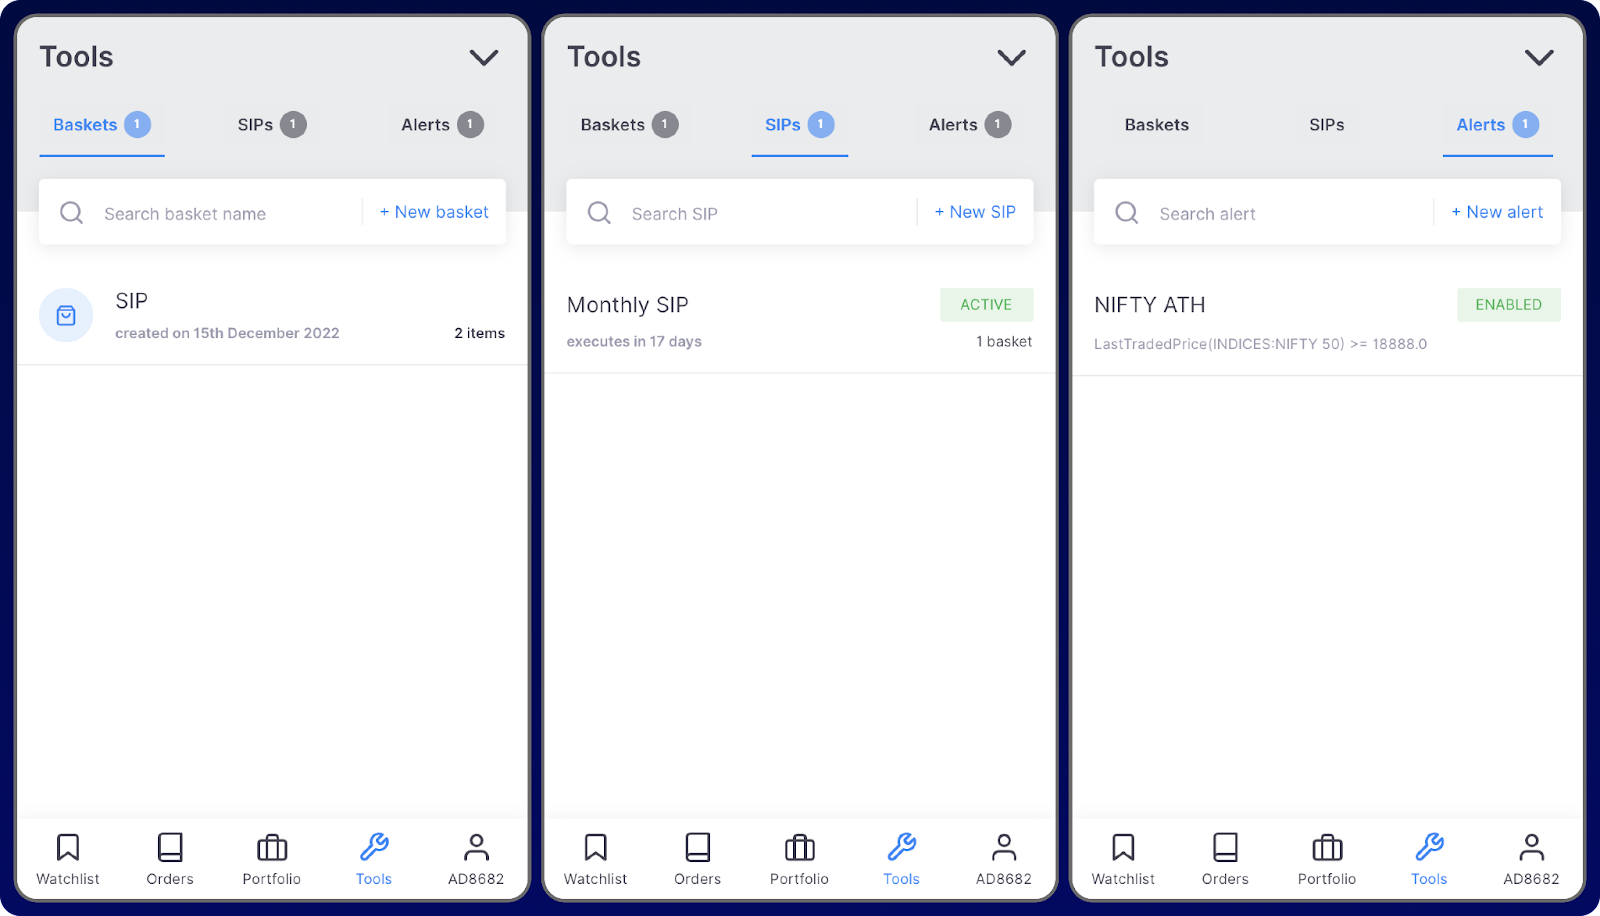
4. Tools
There are 3 subtabs in the tools tab:
1. Baskets
A basket is a feature that allows you to buy a group or portfolio of stocks rather than buying them individually.
2. SIPs
Systematic Investment Plans (SIPs) allow you to invest a certain amount of money into stocks and other securities at regular intervals. Once you create a basket, a SIP can be done on a particular basket.
3. Alerts
This feature allows you to create alerts on stock prices so that you don’t need to monitor them constantly.
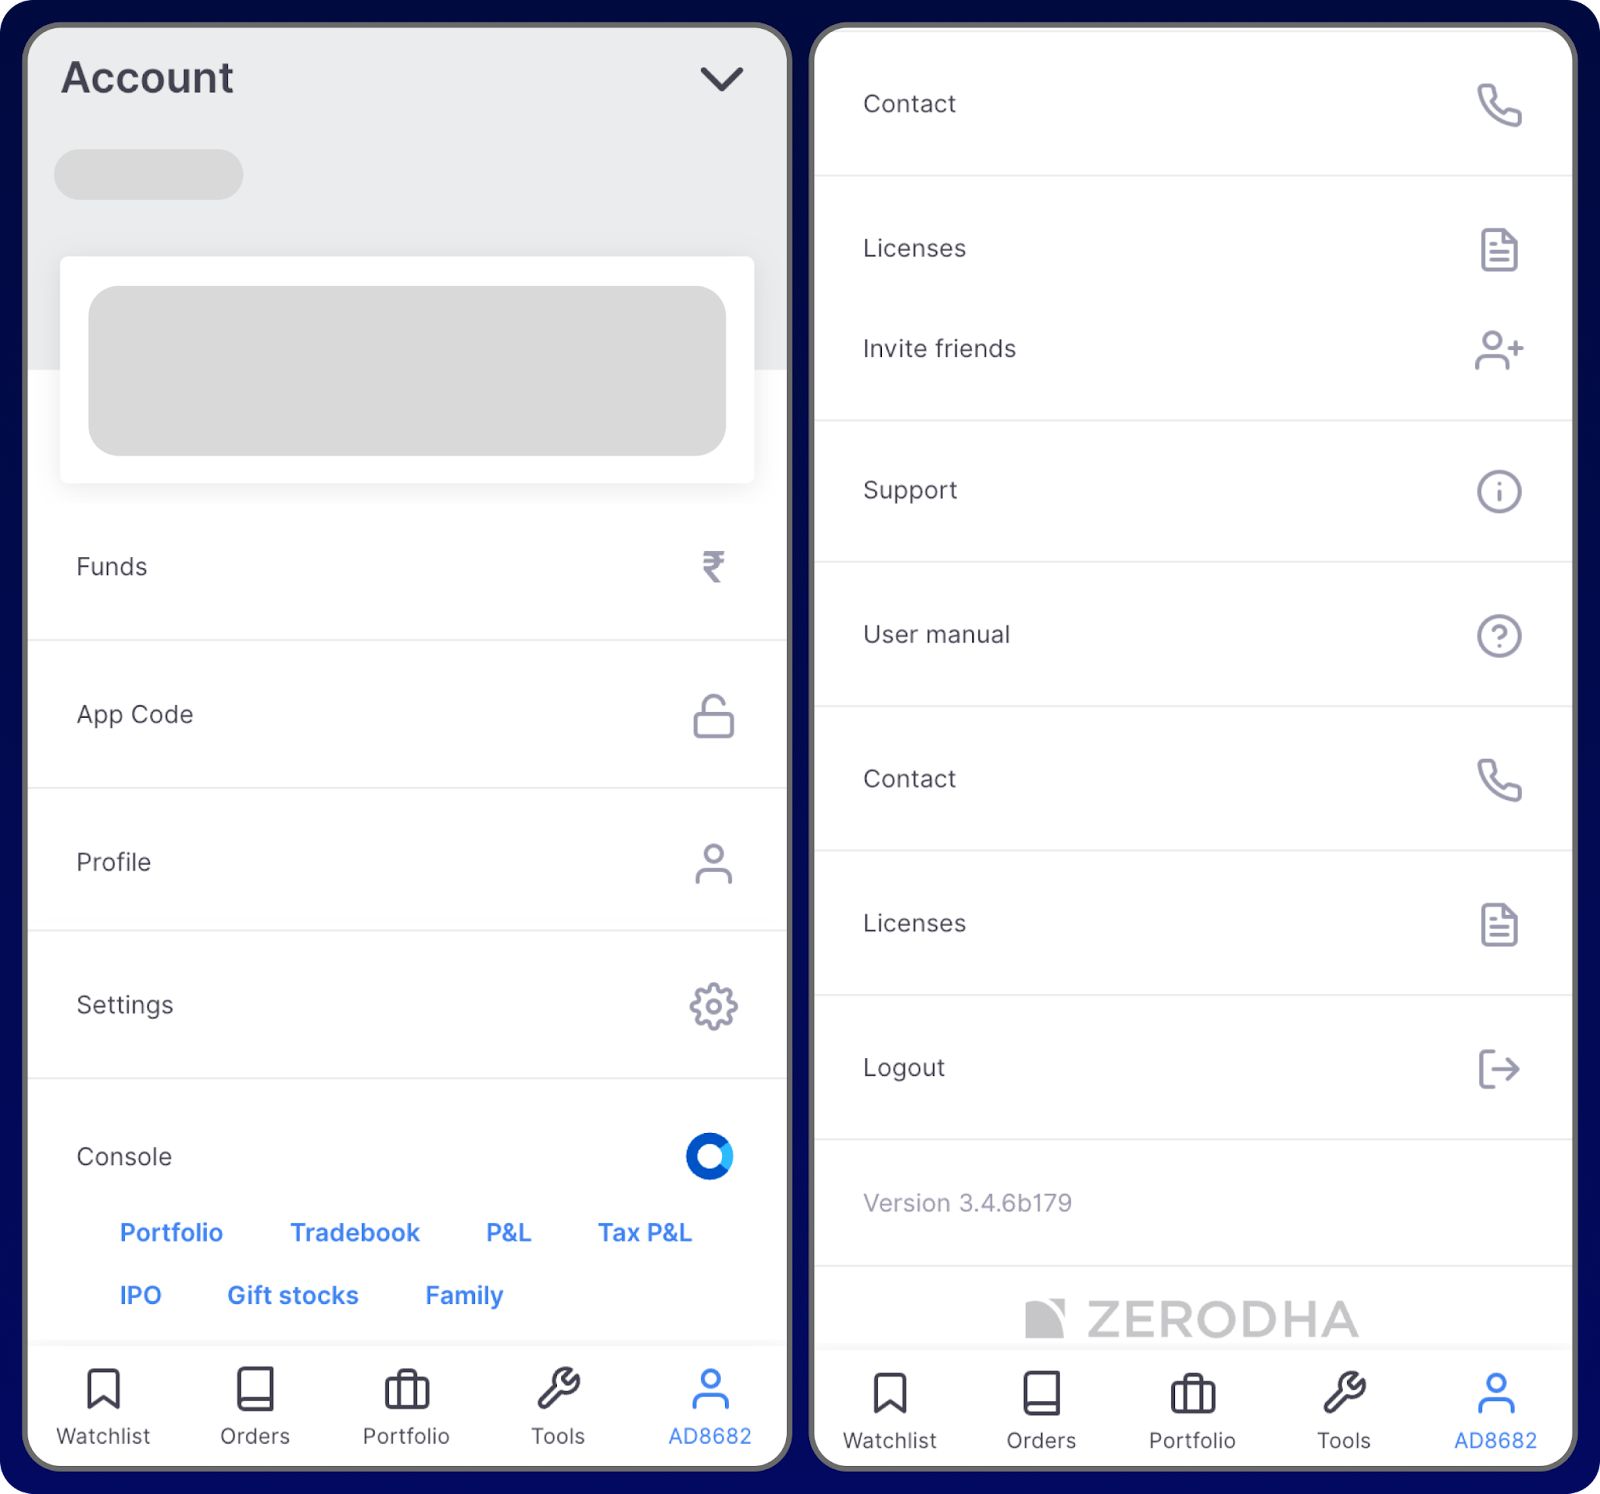
5. Profile
This tab shows all the account settings and profile information:
Funds – This section is where you deposit and withdraw funds into your trading account.
App Code – It displays the code to log in to Kite web.
Profile – Shows all your profile information such as your name, client code, email, phone number, etc
Settings – This option allows you to change various settings within the app.
Console – Console is the back office of your Zerodha account.
Portfolio option shows a detailed view and breakdown of your holdings.
Tradebook shows all the trades you have taken on any particular day or range of days.
P&L shows the total amount of money you gained or lost in a particular period.
Tax P&L displays all the documents required to file tax returns with the Income Tax Department.
IPO displays all the current and upcoming initial public offerings (IPOs). You can also apply for IPOs via Zerodha.
Gift Stocks is a feature that allows you to gift stocks to other Zerodha users.
Family allows you to add up to 10 family member portfolios (Zerodha accounts) and track the consolidated portfolio through one account. Only viewing and tracking are allowed after explicit authorization from the family member’s account.
Apart from these five tabs, there is an overview section in the app that displays two indices, NIFTY and BANKNIFTY, by default. It also shows the funds available in your account to trade. You can access the overview section from the dropdown pin on the top right corner of the screen and is accessible from any tab in the app.
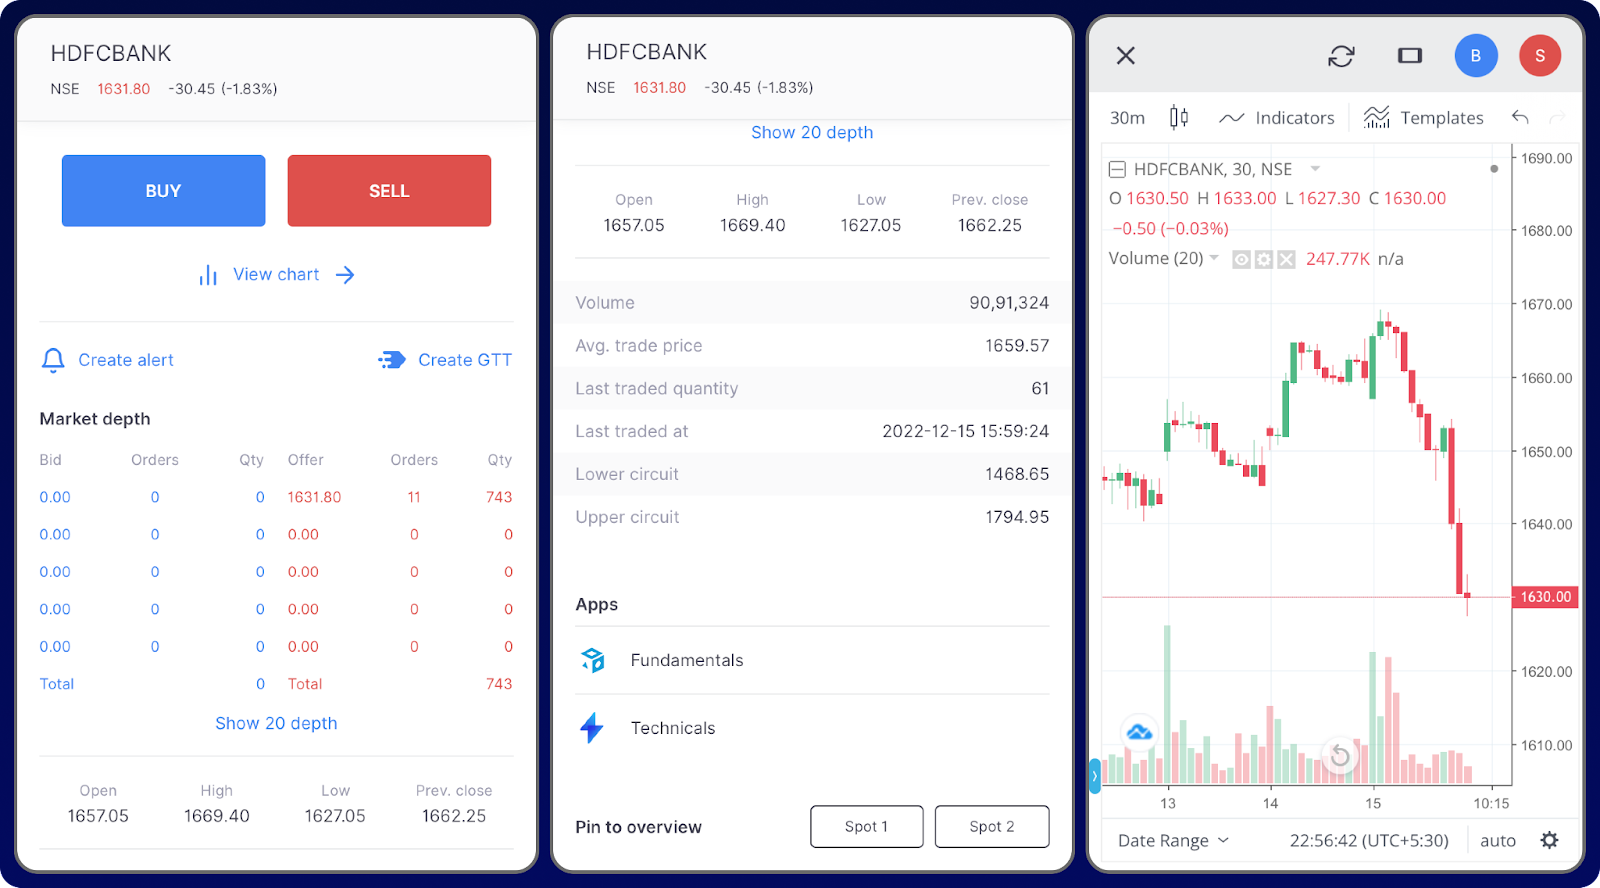
Features in the Order Placement Window
Invoke the order placement window by clicking on any scrip and pulling it up.
1. On the top of the window, the details of the scrips such as the name of the listed exchange, LTP, and price change are displayed.
2. A buy and sell button follows, which you can click to place an order.
3. Option to view the price chart of the scrip. We will learn about charts in the upcoming modules.
4. Option to set a price alert on the stock.
5. Option to create a GTT order for the stock.
6. Market depth is a real-time list displaying the bids and offers for the stock. Buyers place orders called bids, and sellers place orders called offers. It displays the top five bids and offers including their quantity, price, and orders.
7. Shows Open, High, Low, & Previous Close
Open represents the price at which the stock opened today.
High represents the highest price the stock traded at.
Low represents the lowest price the stock traded at.
The previous close shows the closing price of the previous day.
8. Various data such as volume, average trade price, last traded quantity, and last tradedat are shown along with the lower circuit and upper circuit. We will discuss what upper and lower circuits are in the upcoming modules.
9. The fundamentals and technicals of the stock can also be viewed in detail.
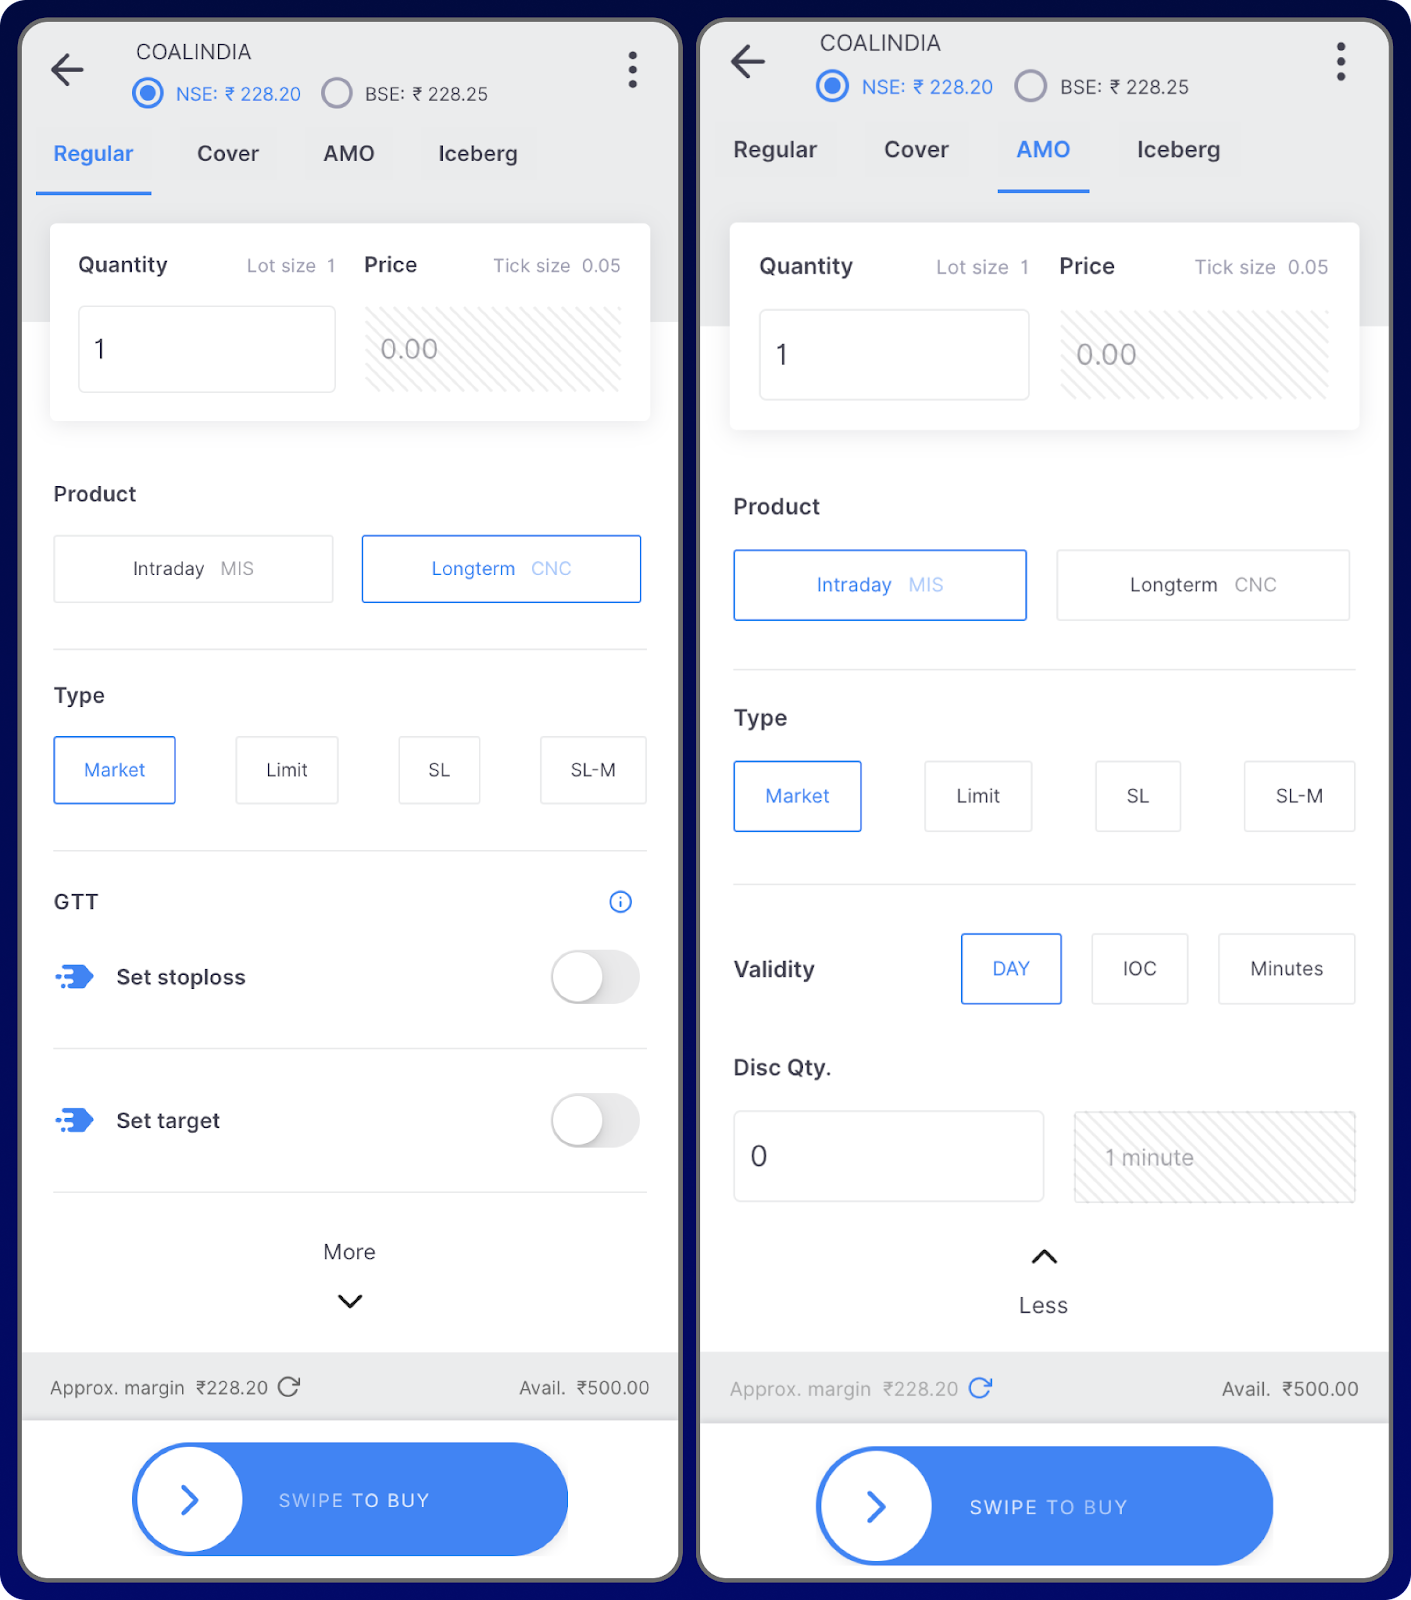
Types of Orders
You can either place a buy order or a sell order. A buy order instructs the broker to buy a stock and a sell order instructs the broker to sell a stock. There are Regular orders, Cover orders, AMO orders, and iceberg orders for buy and sell.
What are Regular, Cover, AMO & Iceberg Orders?
These are different types of buy and sell orders.
Regular orders are normal orders that we place to make trades.
A Cover Order (CO) is an order with an in-built risk mitigation mechanism. Simply put, a cover order is a market order or limit order that is placed along with a stop loss order.
An AMOorder (After Market Order) allows you to place orders for the next trading day This is especially helpful for people who can’t actively track the markets during the live session – 9:15 am to 3:30 pm. AMO orders are allowed for all product types (CNC/MIS/NRML) except for CO.
An Iceberg is an order type that slices orders of larger quantity (or value) into smaller orders, where each small order, or leg, is sent to the exchange only after the previous order is filled. This is only used for orders with huge volumes.
Both buy and sell orders have the following order types, execution, and validity instructions.
Product
Intraday – This order is placed for taking intraday trades. This is how we tell our broker upfront that we will be taking an intraday trade and will exit it on the same day before the market closes.
Longterm – This order is placed for taking delivery of stocks. We place a long-term (CNC) order when we want to buy and hold stocks for the long term.
Execution Instructions
Market Order – To buy a stock at the current market price.
Limit Order – To buy a stock at a specific price. If the limit price is below the current market price, it will effectively act as a market order, and the order will be immediately executed.
Stop-loss order (SL) – To buy a stock above the current market price. Set the trigger price, the price above which you want to buy the stock. Also, set the limit price, the price at which you want to buy the stock when the price reaches the trigger price.
Eg: Suppose the current market price of a stock is ₹98 and you want to buy the stock at ₹102 only when the price crosses ₹100. Then place an SL order with a trigger at ₹100 and a limit price of ₹102.
Stop-loss Market order (SL-M) – This is a type of SL order in which the stock will be bought at the current market price when the price is triggered. Only a trigger price has to be entered.
Validity Instructions
Day Order – The order will be valid till the end of the day if the day order is placed, which means that it will be open until the end of the day.
Good-Till-Triggered – A GTT order will be valid for one year. If the order is not executed today, it will be open for 1 year.
Immediate or Cancel Orders – The order if not executed right after placing, will be canceled.
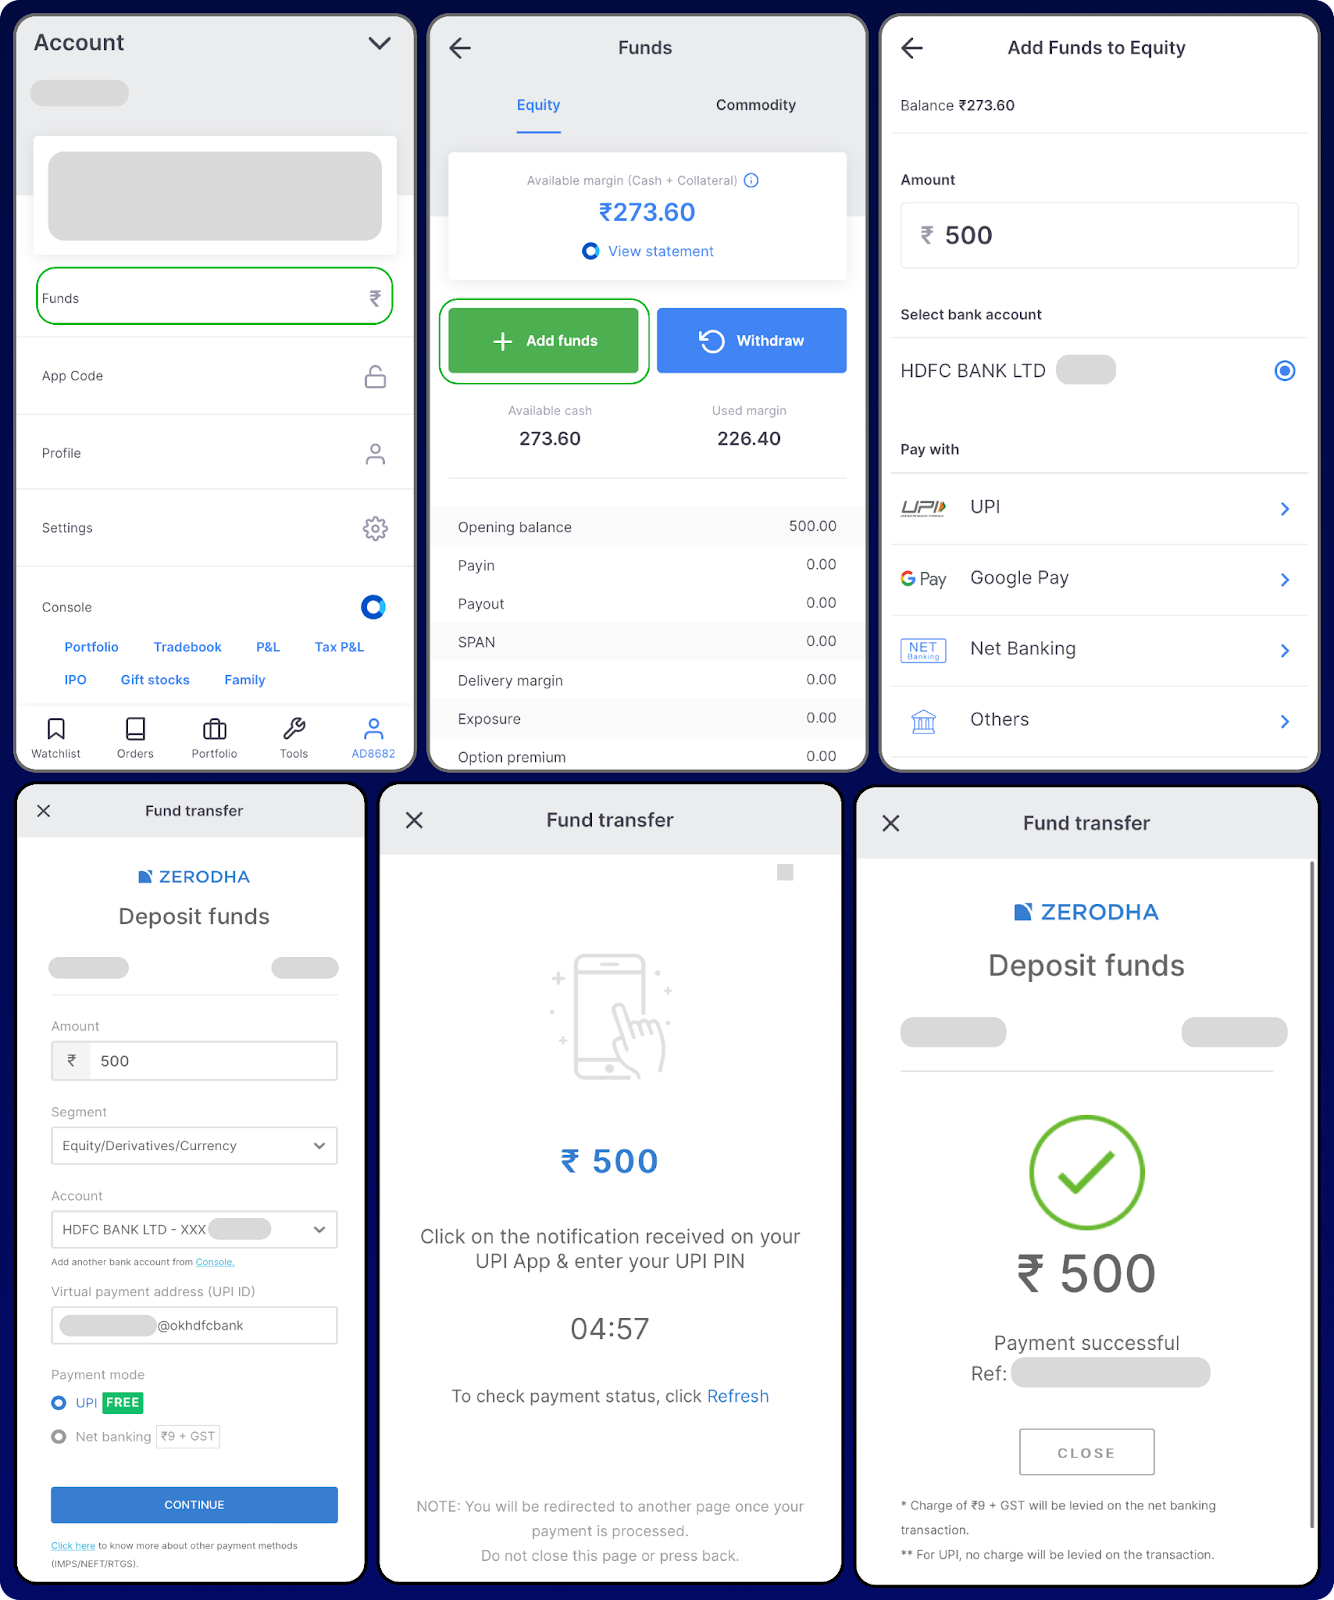
How to Add Funds to Your Account?
You can fund your account using various payment methods including UPI and net banking. There will be zero charges if you fund your account via UPI.
Here are the steps to add funds to your account:
1: Go to Profile and Click on Funds
2: Click on Add funds
3: Enter the amount that you want to deposit
4: Select the payment method
We will select UPI as the payment method here.
4: Complete the payment
Voila! You’re done.
You’ve now learnt how to navigate the broker’s app and the different types of orders and their use cases in this chapter. We also discussed the steps to add funds!
Have you ever wondered what the stock market is and how it works? If yes, you’re not alone. The stock market can seem confusing and intimidating for people who don’t know how it works. But don’t worry! In this article, we shall learn what the stock market is, how it works, and who market participants are.
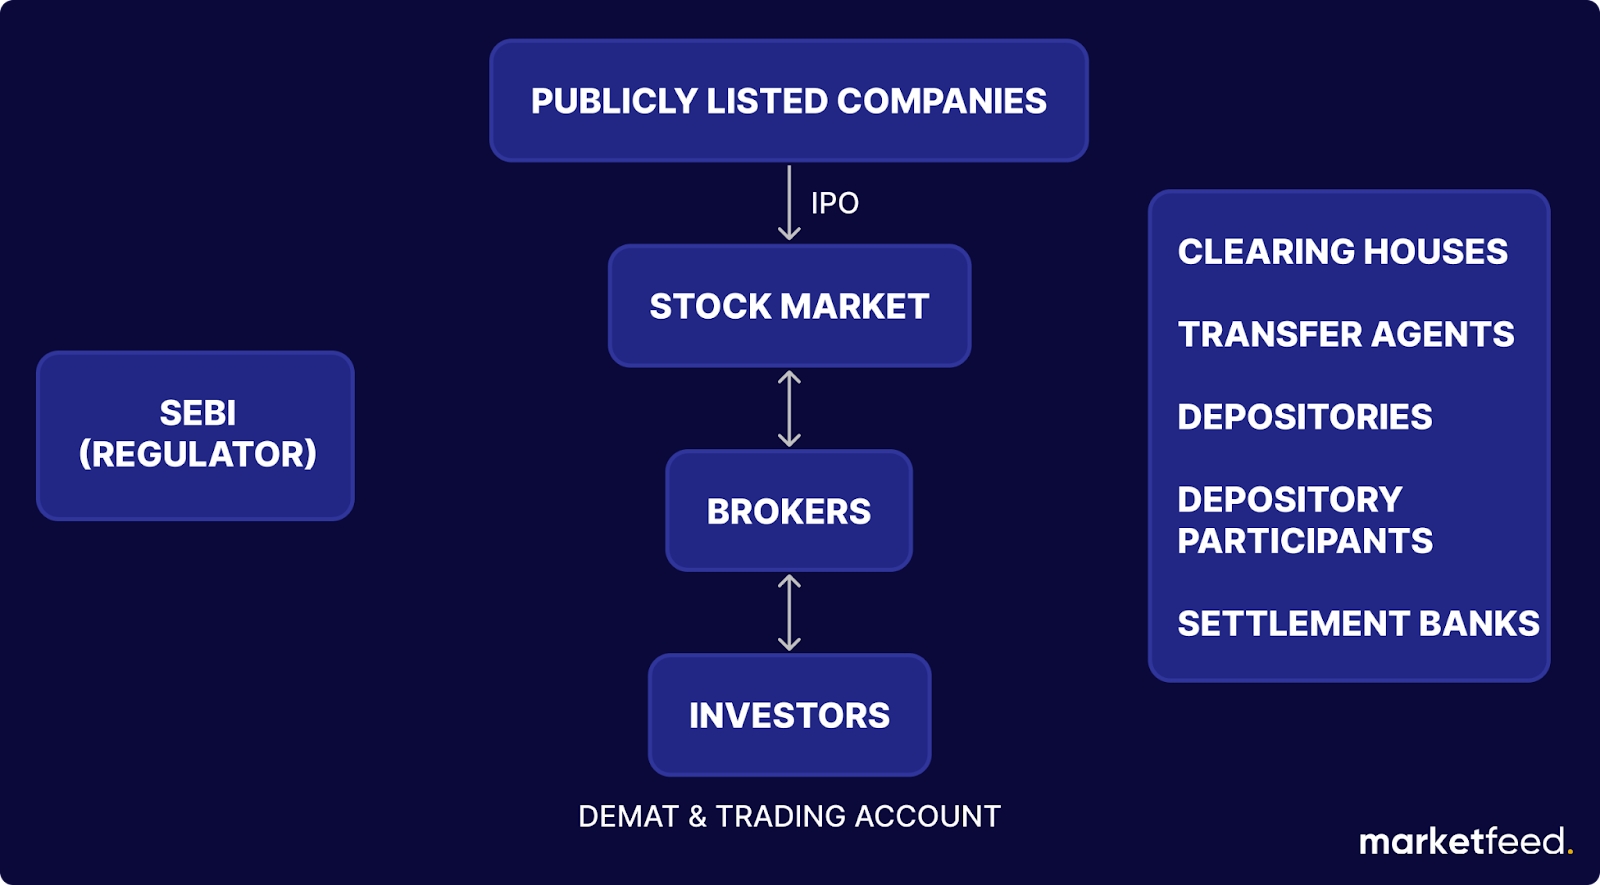
Given below are the different participants in the stock market. We’ll understand more about them through a story.
Let’s Look at a Story!
Mr. Jignesh, an owner of a renowned supermarket in Bengaluru, has been successfully running his business for the past ten years. The supermarket has been generating decent revenue and is highly profitable. His business also has goodwill (proprietary or intellectual property and brand recognition). When it comes to business, there are two things you must understand:
Ownership of a Business Jignesh completely owns and runs the supermarket, and the profit is not shared with anyone else.
Valuation of a Business Anything and everything has a value attached to it, even a business. The business has been generating income for Jignesh for the past ten years, so it is valuable. The valuation of a business is the economic value of how much a person has to pay to acquire 100% of the business from him. Let’s assume that the supermarket is valued at ₹1 crore.
Since Jignesh is growing old, he feels he doesn’t want to work as much as he did and is looking for a partner to operate the business in return for 50% of the ownership of his business. He decided to share his business with a partner, Ms. Riya.
What are Shares?
Shares represent units of ownership of a company. A shareholder is entitled to a part of the profit that the company generates.
The ownership of Jignesh’s supermarket was divided into 1000 equal shares. The value of each share can be mathematically expressed as:
Value of 1 Share = Total Valuation / Total Number of Shares
= 1,00,00,000 / 1000
= ₹10,000 per share.
Riya agreed to acquire 500 shares (50%) of the supermarket in consideration of the value of those shares in Cash.
Valuation = Total Number of Shares x Value of Each Share
Riya paid ₹50,00,000 to Jignesh, and they both became partners in the supermarket business.
A few years later, the business expanded with several profitable outlets across Bengaluru. Now, Jignesh and Riya want to open 200 more stores nationwide, for which they need a large amount of capital. The easiest way to get funding or capital is by taking out a loan from a bank and using the business’ assets as collateral. However, this carries the risk of falling into a debt trap. If they are unable to repay the loan for some reason, the assets will be seized by the bank to recover the loan. Jignesh and Rita did not want to deal with these issues.
An alternative would be to find more people who are interested in becoming part-owners of the business across Bengaluru. Even then, they may not be able to find enough people to do so. At this point, Jignesh becomes aware of the stock market. If they convert their company into a Public Limited company, they can raise capital from thousands of investors across India and other countries. The process of issuing shares to the public to raise capital for a business is known as an Initial Public Offering (IPO).
What is the Stock Market?
A stock market is a place where shares of publicly listed companies are traded. It is a physical place or institution where shares are bought and sold.
So Why Do Companies Go Public?
To Raise Capital: The company can gather funds for many objectives, such as paying liabilities (loans) and funding its future expansion projects.
Reward Founders & Early Investors: The founders and early investors of a company hold a good portion of the shares in their entity. They can sell these shares to the public and the proceeds go directly to them rather than to the company. It can be considered as a reward for all the time and effort they put in to build the company from the ground up. So going public can give them an early exit.
What are Stock Exchanges?
A stock exchange is a financial institution where different participants come together to buy and sell securities(shares). It provides the infrastructure for these activities. The term Stock Market is an umbrella term for a collection of Stock Exchanges.
The two major Stock Exchanges in India are:
Bombay Stock Exchange (BSE)
National Stock Exchange (NSE)
BSE is older than NSE, which explains why more companies are listed on the BSE than NSE.
Coming back to the story, Jignesh’s company had a total of 1000 shares, out of which they decided to issue 15% of the shares to the public. Thus, 150 shares are being offered to the public.
1000 x 15% = 150
How Many Shares Will a Company Have? Who Decides That?
A company’s promoters can decide how many shares it should have. Some firms may have thousands of shares, while others may have lakhs or even crores of shares.
For example, the valuation of Jignesh’s company was ₹1 crore in the beginning. But the business has grown over the years, and now the valuation stands at ₹2 crores, bringing the value of each share to ₹20,000.
Why do Investors Exist? What are their Objectives?
The two main objectives of investors are:
1. Capital Appreciation – When a company grows, the price of its shares increases. If investors buy the shares of a company when the prices are low and sell them when the prices increase, they can make good profits via capital appreciation.
2. Earn Dividends – When a company makes profits every year from its operations, it distributes a portion of the profits to shareholders as dividends. However, it is not necessary for them to declare dividends every year. It’s the company’s choice whether to issue dividends or not. The company may fully retain its profits for future capital needs or may give out a part of the profit and retain the rest.
In short, the objective of a public limited company is to raise capital for its funding needs and the investors’ objective is to grow their money. But the real question is, how does the stock market fit into this?
Why do Stock Markets Exist?
The stock market provides an avenue for a public company to raise capital from investors in consideration of shares. Investors will be able to grow their savings and wealth through capital appreciation and dividends. The stock market is the facilitator for the two parties.
What are Primary Market and Secondary Market?
The stock market is divided into two:
1. Primary Markets It is a market wherein a firm issues securities/shares to investors directly (via an initial public offering or IPO). These sale proceeds go directly to the issuer to finance their capital requirements.
2. Secondary Markets It is the market where previously issued securities are bought and sold among investors. These sale proceeds go to the person who holds the securities.
In our story, many people wanted to buy shares of his company after the IPO. However, the company does not issue any more shares as the IPO is already done. So these new investors can only buy the shares from those already holding them.
When such transactions happen between investors in the secondary markets, the price of the share gets updated. If an existing shareholder sells the stock to another person for ₹20,100, the price of all the shares of the company gets updated to ₹20,100. Consequently, the net worth of the shareholders increases as the price of the shares they hold increases.
Who Decides the Price of a Stock?
The two reasons which decide the price of a stock are:
Company’s Actual Valuation: A company’s value fluctuates as the revenue, profit, and goodwill change. The future prospects of the company also contribute to the valuation. If the revenue and profits go down, the valuation may also decrease, which causes the share price to drop. However, if the revenue and profit increase, the valuation could also rise.
Demand & Supply: The market forces of supply and demand also play an important role in deciding the share price. If the demand for the stock increases, then its price also increases since supply is limited. If the demand for the stock decreases, then its price also decreases since the supply is the same. Demand for the stock depends upon market sentiments, which refers to the overall attitude of investors toward the company. If the market sentiment is positive, then the demand for the stock will be high, thus driving the stock price up. Demand for the stock will be less if the market sentiment is negative.
Why Do Stock Prices Fluctuate Every Second?
The Last Traded Price (LTP) refers to the price at which the previous share transaction took place. The stock market has lakhs of participants, and transactions happen every second. If a person sells a stock for ₹150, then the LTP at the time will be ₹150. The very next second, if a stock is sold for ₹149, then the LTP changes to ₹149. This is the reason why stock prices fluctuate every second.
Who are Brokers?
If you want to buy a stock, you cannot do it directly from the stock market. We have to approach a stockbroker, and the broker will transact on our behalf. A broker is an intermediary that facilitates transactions in the stock market. If you want to buy a stock, your broker will find a seller in the stock market on your instruction and facilitate the transaction between you and the seller.
Before technology evolved, an investor had to physically visit the broker’s office and instruct them to buy the stock. The broker would then physically go around the stock market, find a seller, and conduct the transaction. But now, technology has evolved, and transactions can be conducted via our phones. Brokers are accessible on computers and smartphones, and investing & trading are as easy as ever.
It is absolutely necessary to have an account with a broker to participate in the stock market. As intelligent stock market participants, we must have multiple broking accounts for different purposes. We can use one account for our long-term investing activities and another one for trading. Successful traders use multiple broking accounts for different trading strategies.
How Does a Broker Work?
There are two accounts that we open with a broker. Even though they are two separate accounts serving different purposes, both of them come in a bundle.
1. Demat Account A Demat account or dematerialisation account allows you to hold your shares in an electronic format. It converts the physical shares into an electronic form, therefore dematerialising them. Demat accounts are maintained under depositories.
Earlier, the proof of ownership of shares, bonds, or debentures was in the form of physical share certificates. However, this system had many drawbacks, such as the risk of losing the certificate, fire hazards, getting wet, or even a mismatch in the signatures.
2. Trading Account A trading account acts as an interface between the investor’s bank savings account and a broker. For the broker to conduct trading activities on our behalf, they need money. We transfer the money we have in our savings account to a trading account with which the broker then conducts trading activities. Money can be transferred using net banking or UPI.
If we want to buy a stock, we instruct the broker to buy the stock, and the broker uses the money we have in our trading account to conduct the transaction. Similarly, when we sell a stock, the proceeds of the sale come directly into the trading account.
An Illustration to Understand How Demat & Trading Account Works
Arun wants to buy a share of Mahindra & Mahindra (M&M) from the stock market. The first step that Arun should take is to open a Demat and trading account. Arun opens a Demat & trading account with a leading broker and deposits money into his trading account by transferring from his bank savings account via UPI.
When the market opened at 9:15 AM, Arun placed an order with his broker to buy 1 quantity of M&M stock. The market price of M&M at the time was ₹1000. His trading account was debited ₹1000 by the broker to finance the transaction. Apart from this, a small amount was deducted as taxes and charges.
Even though the transaction was completed, the stock will only be transferred into his Demat account after T+1 days, which means he will receive the stock in his Demat account on the next working day.
While selecting brokers, we should choose the brokers that satisfy our various investing and trading needs. YOu can open a Demat and trading account using the links given below:
(Full disclosure: These are affiliate links. Do use the links if you wish to support us at no extra cost. ❤️)
Click here for step-by-step instructions on how to open a Demat and trading account.
What are Depositories?
If your shares are held by the broker, there is a risk of the broker running away with the shares they have. As a remedy, all Demat accounts are maintained by depositories. A depository is an institution that acts as a custodian of Demat accounts and shares. A Demat account is opened by a depository participant, who acts as an intermediary between the depository and investors.
There are two depositories in India, which are governed by the Government of India:
1. CDSL – Central Depository Services Limited 2. NSDL – National Securities Depository Limited
Who are the Other Facilitators?
The other facilitators part from brokers, depositories, and depository participants are:
Clearing Houses – It is an intermediary between buyers and sellers of financial instruments. It is an agency or separate corporation of a futures exchange responsible for settling trading accounts, clearing trades, collecting and maintaining margin monies, regulating delivery, and reporting trading data.
Transfer Agents – A transfer agent keeps records of who owns a publicly traded company’s stocks and bonds. They also ensure investors receive dividends on time.
Settlement Banks – It refers to a customer’s bank where payments or transactions are finally settled and cleared for customer use.
What is a Market Regulator?
The Indian stock market is a place where transactions worth lakhs of crores of rupees take place. The Securities and Exchange Board of India (SEBI) is a regulatory authority established under the SEBI Act 1992. It’s the principal regulator for stock exchanges in India. SEBI’s primary functions include protecting investor interests and promoting and regulating the Indian securities markets. It is a government organisation. SEBI exists as the watchdog to make sure nothing wrong is happening in such a massive money-involved ecosystem.
Throughout the article, we discussed the various participants in the stock market and how they all work together in the stock market. We’ve also understood the basics of what the stock market is, who its participants are, and how it works!
You may have often heard news channels speak about Nifty50 or Sensex. Monitoring both of these helps investors and the general public analyse the stock market’s direction and a country’s economic conditions. In this article, we will discuss what a stock market index is and what Nifty50 and Sensex are.
What is an Index?
An index simply means an indicator, sign, or measure of something. It is a number that measures or indicates something. A stock market index is used to measure the performance a specific group of stocks or stocks belonging to a particular sector. It provides a snapshot of how the overall market or a particular sector is performing. Essentially, it helps investors analyse the pulse of the stock market.
What is the Purpose of an Index?
The economic growth of a country is measured using various indicators like gross domestic product (GDP), employment rates, etc. A stock market index also acts as a barometer or indicator of an economy by reflecting the collective performance of stocks of listed companies. When an index rises, it suggests optimism, economic growth, and positive investor sentiment. On the other other, a decline may indicate caution, economic challenges, or a more pessimistic outlook.
An index provides insights into the overall health of the stock market, allowing investors, analysts, and policymakers to measure economic conditions, trends, and potential risks. As a result, it becomes a key tool for decision-making, helping people make informed choices based on the prevailing economic climate.
NSE has around 2,000 listed companies, while BSE has around 5,000 listed companies. So it’s practically impossible to look at the performance of all these stocks daily. Therefore, we use an index. This index represents the performance of the constituent stocks in the index.
What is Nifty50?
Nifty50 is the benchmark index of the National Stock Exchange (NSE). It represents the top 50 companies listed on the NSE. When Nifty50 rises, it indicates that the prices of the underlying stocks are generally increasing, and vice versa. Click here to learn more about the constituent companies.
What is Sensex?
Sensex is the benchmark index of the Bombay Stock Exchange (BSE). It represents the performance of 30 well-established and financially sound companies listed on BSE. Click here to learn more about the constituent companies.
Why are Stock Market Indices Important?
Indices offer a quick overview of whether the market is bullish (rising) or bearish (falling).
Investors use indices as benchmarks to evaluate the performance of their portfolios against the broader market. An investor can aim to beat the benchmark set by the index while investing for the long term.
Indices help investors diversify their investments by offering exposure to different sectors.
Movement in indices reflects the economic conditions and trends in specific industries.
They provide insights into investor sentiment and confidence.
Indices also serve as the basis for other investment products such as ETFs and Index funds.
How Are Nifty50 and Sensex Calculated?
We know that NIFTY50 comprises the top 50 companies on the NSE. The value of Nifty50 is calculated using a complex formula that involves the price of the stocks and their free-float market capitalization. In simple terms, the level of the index reflects the total market value of all the stocks included in the NIFTY 50, relative to a particular base period. NSE has fixed November 3, 1995 as the base period, which marks the completion of one year of operations of NSE’s Capital Market Segment. The base value of the index has been set at 1,000, and a base capital of Rs 2.06 lakh crore.
A similar formula is applied to calculate BSE’s Sensex, but it involves only the top 30 companies.
How Are These Companies Selected?
For calculating Nifty50 and Sensex, their respective exchanges have complex criteria for selecting constituent companies. The Nifty50 undergoes semi-annual rebalancing, while the Sensex is rebalanced on a monthly basis. When a company falls out of the criteria, it will be swapped out by another new company that falls within the criteria.
To learn more about how stocks are included/excluded in NIFTY50, click here.
What Are Sectoral Indices?
We saw that NIFTY50 can be used to measure the stock market performance of the Indian economy. NIFTY is calculated based on market cap, or we can say that it is a broad-based index. Similarly, indices can be made based on sectors, which are termed sectoral indices. A sectoral index represents the top companies in a specific sector such as IT, Pharma, Metal, Auto, etc. The performance of different sectors can be measures using such indices.
Nifty Pharma is a sectoral index of NSE which represents the performance of top pharmaceutical companies in the country. Similarly, there are 11 sectoral indices in the NSE that represent various sectors of the economy.
Just like NSE has various sectoral indices, BSE also has different indices that represent various sectors of the country.
In conclusion, a market index is an invaluable tool for investors in many ways, such as a benchmark for their investment portfolios and knowing the state of a country’s economy. These indexes can represent the top companies in the country, and companies in different sectors, segments, and asset classes. If used correctly, an index could be your best friend to make investment decisions.