Categories
Jargons

What is Valuation? What is Discounted Cash Flow?


Ever wondered how to figure out what a company is really worth? That’s where valuation comes in – it’s like a magic trick for understanding a business’s true value. Whether you’re new to investing or a pro, getting the hang of valuation basics is key to making smart money moves. In this article, we dive into the basics of valuation and how a company is valued to help you make better investment decisions.

What is Valuation?

In finance, valuation simply means finding the real worth of a company. Valuation is used to determine the price that market participants are willing to pay or receive while selling a business. Thus, value investing is based on the true value of a business compared to its market value. Let us understand what market value and intrinsic value is.

Market Value vs Intrinsic Value

The market value of a business is the worth that the market assigns to it. You can calculate the market value of any publicly traded company by multiplying the share price by the number of outstanding shares. However, the market value may not be the actual value of the business. Sometimes, the market may overvalue a company for reasons such as high demand for its stocks, future plans, market sentiments for that stock, etc. 

Although the market value is what the market thinks a company is worth, the firm also has an intrinsic value. Intrinsic value is the true and accurate worth of a company. If the market value of a company is higher than its intrinsic value, then the stock is currently overpriced or overvalued. On the other hand, if the intrinsic value of a company is lower than its market value, then the company is undervalued.

How to Find the Intrinsic Value of a Company?

Finding the actual valuation of a company is a very complex, intensive, and lengthy process. Investment banks put together a team and take multiple days to find the true value of a company. Experts use different methods like Dividend Discount Models (DDM), Residual Income Models, Discounted Cash Flow Models, etc. However, for the purpose of our learning series, we will learn a simplified form of Discounted Cash Flow Analysis.

What is Discounted Cash Flow Analysis?

Discounted Cash Flow (DCF) models work on the concept of the time value of money. It is a concept that says that the value of a certain sum of money is worth more in the future than the same amount of money today because of the potential earning capacity of money. If you had the choice to receive ₹100 today or 1 year later, the choice should be today. This is because, if you receive ₹100 today and you invest that amount in an instrument giving you 5% returns per annum, then by the end of the year, you would have ₹105 with you. Having ₹105 over ₹100 is better at the end of the year.

Discounted cash flow analysis finds the present value of expected future cash flows using a discount rate. From the above example, 5% is the discount rate. A discount rate is the expected return over a period. If you think that the company will grow by 10% for the next 5 years, then the discount rate should be 10%. As the discount rate increases, the intrinsic value will decrease. So, we should take reasonable care while assigning a discount rate and make sure that the rate is fair and realistic. 

DCF Calculator

To find the intrinsic value of a company, we will be using a Discounted Cash Flow (DCF) calculator. Click here to use the calculator. 

DCF calculator | marketfeed
(Source: Finology)

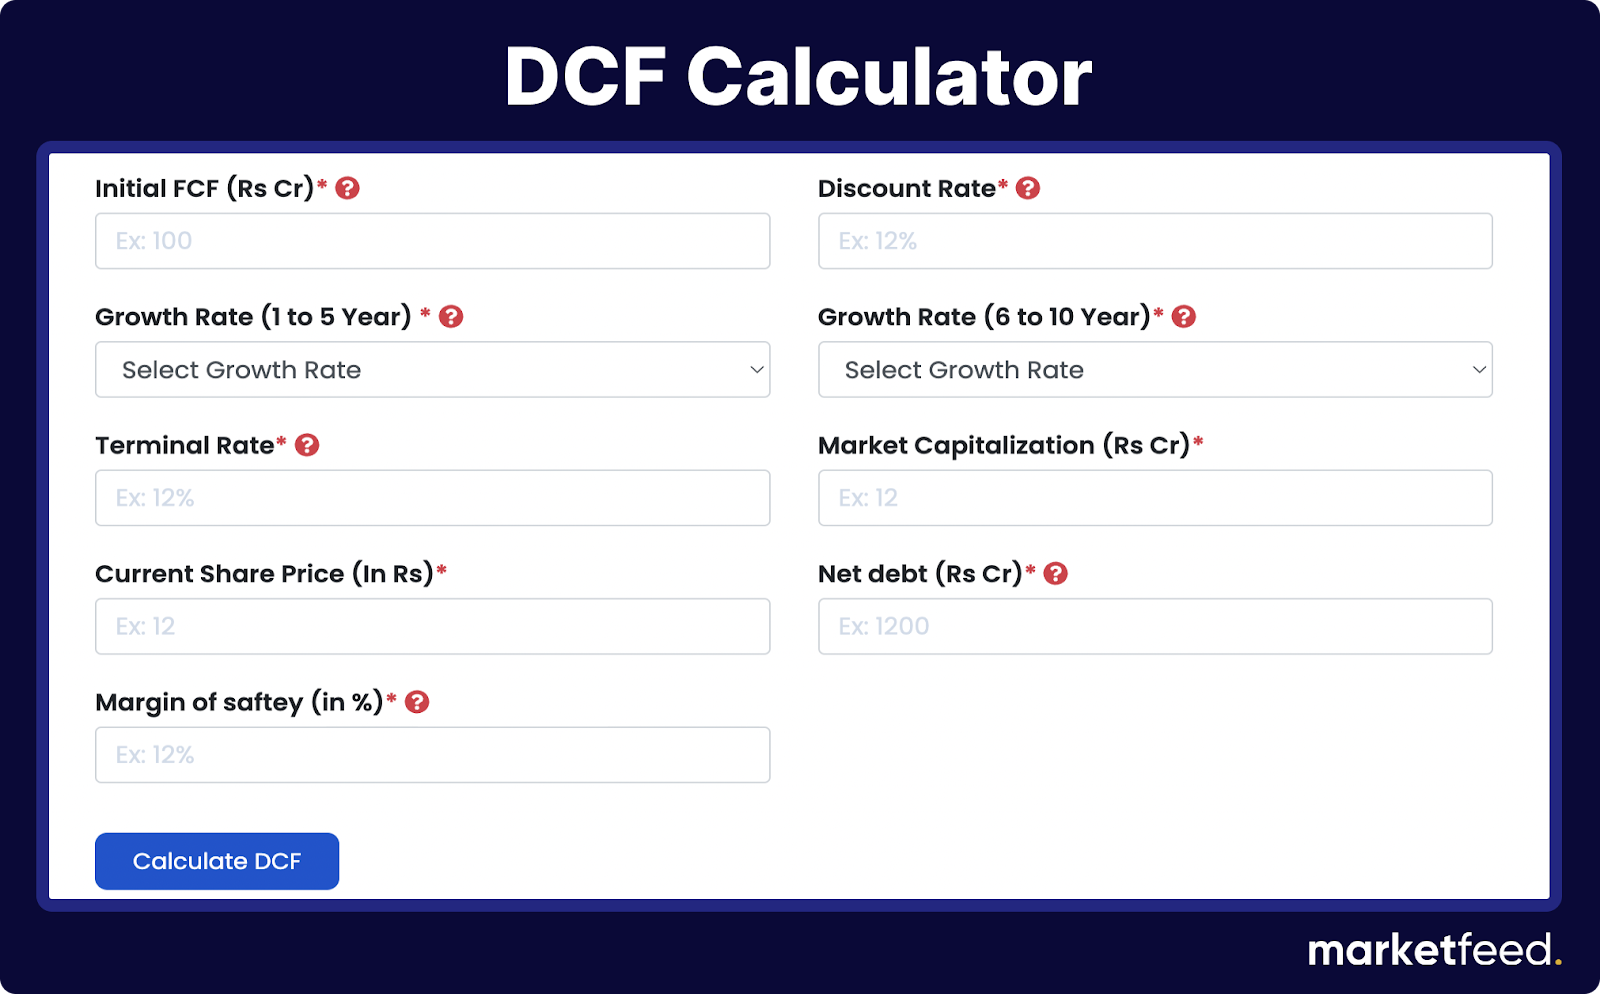
Steps to Calculate Intrinsic Value

Step 1: Enter the initial FCF

FCF stands for free cash flow. Free cash flow = Net Cash flow from operating activities – Capital expenditure. Enter the three-year average FCF of a company.

Step 2: Enter the Discount Rate

The discount rate refers to the required rate of return. It is the return rate that you are expecting from a similar alternative investment. 

Step 3: Enter Growth Rate (1 to 5 years)

It is the rate at which the company might grow in the next 1 to 5 years. Large and well-established companies will have relatively low growth rates. You can also use the average growth rate of revenue or profit for the past 5 years and use that rate here.

Step 4: Enter Growth Rate (6 to 10 years)

It is the rate at which the company might grow in the next 6-10 years after the initial period.

Step 5: Enter the Terminal Rate

It is the rate at which the company is expected to grow 10 years from now. It is calculated by assuming the constant growth of a company beyond a certain period. 5% and below is a fair terminal rate.

Step 6: Enter the Market capitalization 

The market capitalization can be calculated by multiplying the total number of outstanding shares by its current share price. It can be easily found from screener.in, Tickertape, etc.

Step 7: Enter the Current Stock Price
Step 8: Enter the Net Debt

Net debt can be calculated by deducting cash and cash equivalents from a company’s total debt/liabilities. This data can be calculated from the balance sheet.

Step 9: Enter the Margin of Safety (MoS)

The margin of Safety provides discounts for uncertainties in the business. 

Step 10: Click ‘Calculate’

The calculator gives two values:

  1. DCF value per share shows the estimated intrinsic value.
  2. Fair value shows the intrinsic value per share after deducting the margin of safety.

If the intrinsic value derived is higher than the market price, then the stock is undervalued and if the intrinsic value is lower than the current market price, then the stock is overpriced.

An Illustration

Let us use the calculator to find the intrinsic value of Hindustan Unilever (HUL). The values are entered as per the above instructions:

DCF Calculator - Example | marketfeed
(Source: Finology)

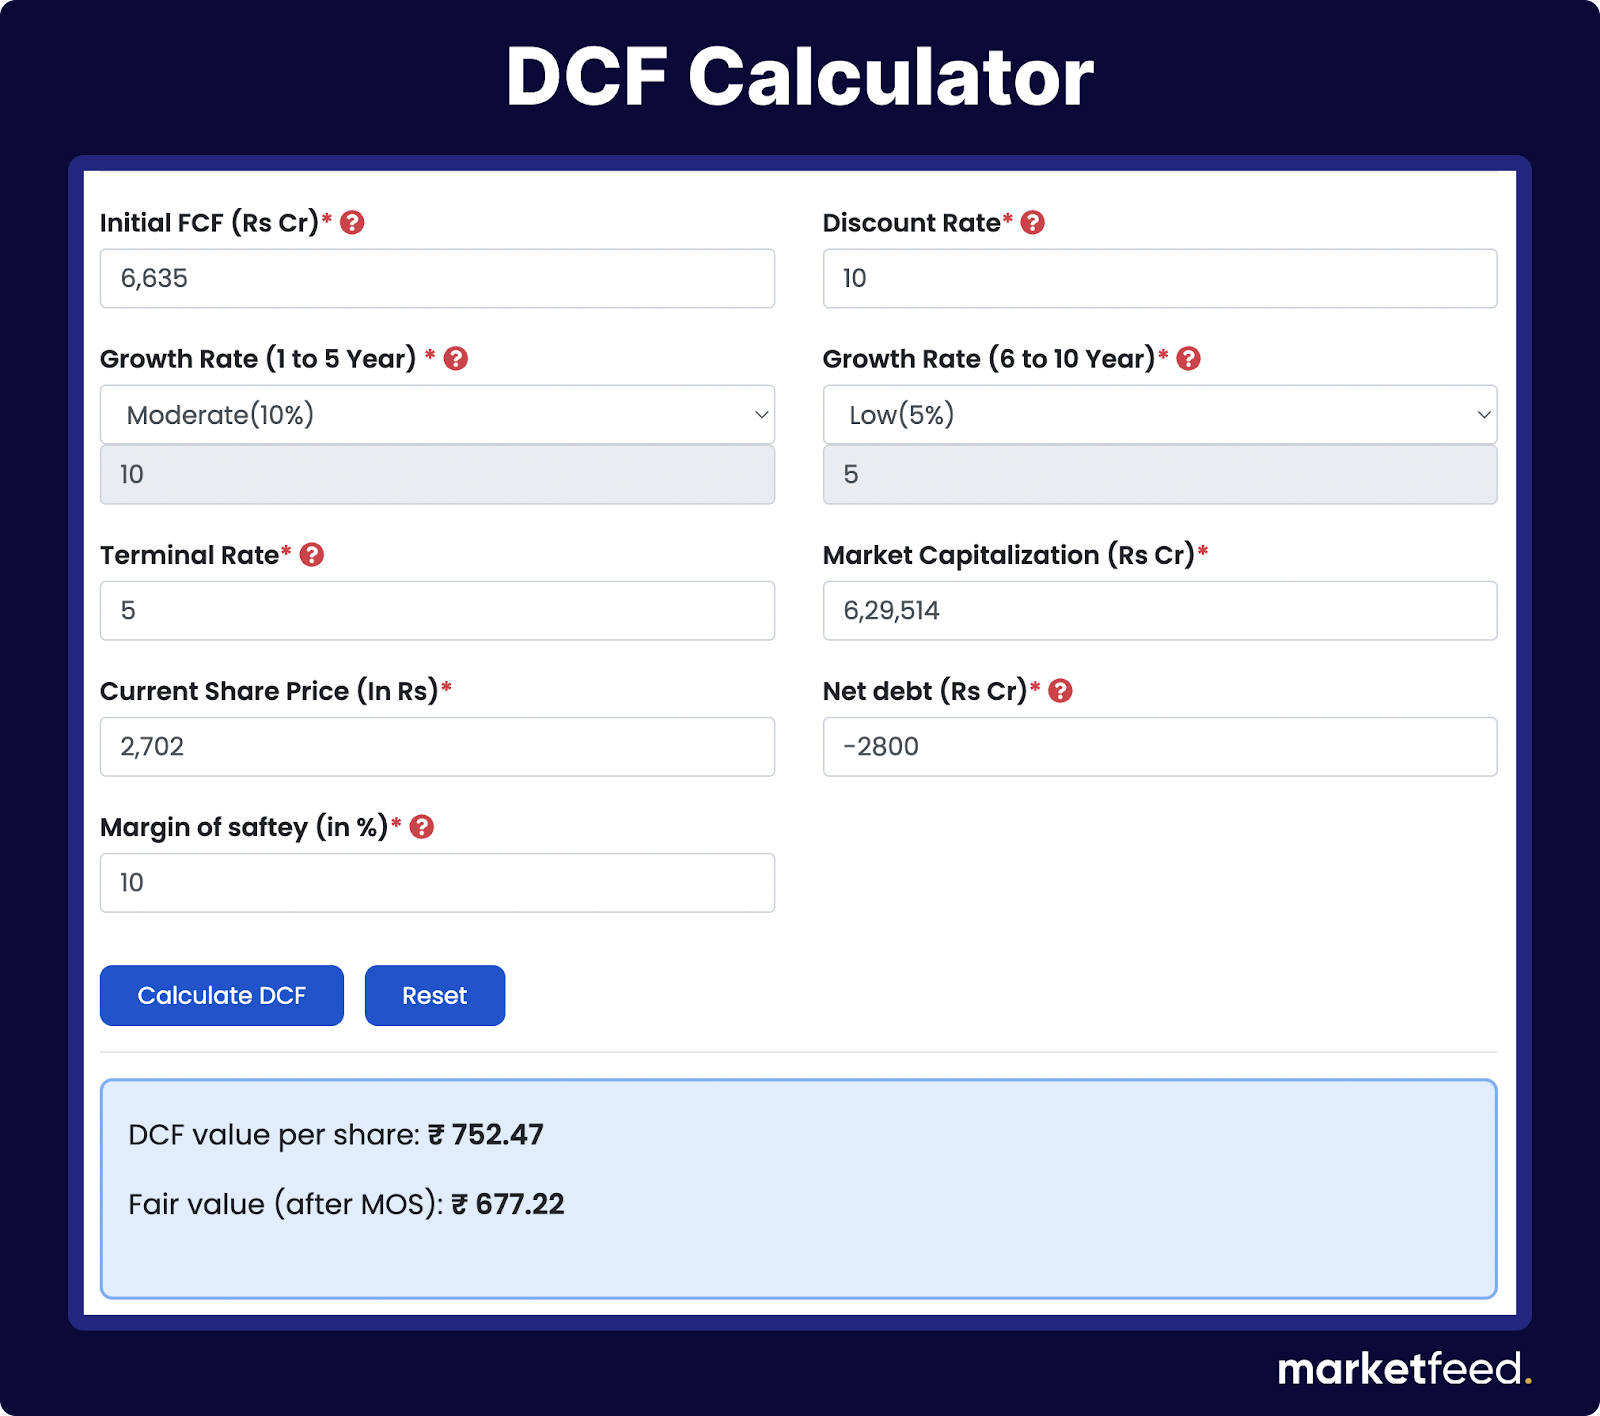
Assuming that the current share price of HUL is ₹2702, the DCF value or intrinsic value per share is ₹752.47. The fair value or intrinsic value after the margin of safety is ₹677.22. The stock price of HUL is 3 times more overpriced than its estimated intrinsic value.

We have learned now how to find the intrinsic value of a company. This value can be used while making decisions when it comes to value investing. However,  we don’t give much importance to intrinsic value in the case of growth investing.

In conclusion, valuation is not just about numbers; it’s about unlocking the potential of a company’s true value. So, as you navigate the world of finance, use these insights to guide your journey and make informed choices!

Also read: 5 Best Steps to Find Quality Stocks in India

Categories
Jargons

How to Analyse Debt and Valuation of a Company?

We often come across a lot of different financial ratios with complex names and become confused about the kinds of metrics to use when analyzing different companies listed in the stock market. In this article, we will discuss how to analyse the debt and valuation of a company (by using Tata Steel as an example).

Understanding Debt and Valuation

Debt refers to the total amount of money that a company owes to external creditors or lenders. It can arise from various sources, including loans, bonds, lines of credit, and other forms of borrowing. When a company borrows money, it agrees to repay the borrowed funds over time, often with interest. Companies take in debt for financing operations, expanding their business, investing in new projects, acquiring assets, or managing cash flow fluctuations. Debt can be an important tool for companies to raise capital and achieve their growth objectives. However, it also comes with the responsibility of making regular interest payments and eventually repaying the principal amount borrowed.

Meanwhile, valuation means finding the real worth of a company. Market participants use it to determine the price they are willing to pay or accept when selling a business. Thus, value investing is based on the true value of a business compared to its market value.

  • The market value of a business is the worth that the market assigns to it. To calculate the market value of a publicly traded company, multiply its share price by the number of outstanding shares.
  • Intrinsic value is the true and accurate worth of a company. It is the anticipated or calculated value determined through fundamental analysis.
  • If the market value of a company is higher than its intrinsic value, then the stock is currently overpriced or overvalued. On the other hand, if the intrinsic value of a company is lower than its market value, then the company is undervalued.

Debt Analysis Ratios (Leverage Ratios)

For a company, debt (leverage) is like a double-edged sword. They can scale their business and improve sales with the help of debt funds. However, if not used wisely, the interest to be paid for these borrowings can eat up the company’s profits. It could also lead to a crunch in the cash reserved for future operations.

The following are the different types of leverage ratios:

1. Debt-to-Equity Ratio

Equity is the value attributable to the shareholders of a company. It is calculated by subtracting liabilities from the value of the assets. The debt-to-equity ratio tells us how much borrowings are present in a company compared to its equity.

Debt-to-Equity Ratio = Total Debt/Total Equity

We can find the total equity of a company in its balance sheet. By adding the borrowings from the current and non-current liabilities, we get debt. For Tata Steel, the ratio stood at 0.76X  in FY23, which means that for every ₹1 equity in the company, there exists ₹0.76 as debt. A higher Debt-to-Equity ratio indicates a higher amount of debt compared to equity.

debt to equity ratio analysis of tata steel, jsw steel, jindal steel

From the graph shown above, we can conclude that Tata Steel has been able to reduce its debts, although it has increased slightly this year. The company’s Debt-to-Equity ratio is also aligned with the industry average. We can also conclude that the steel sector is capital-intensive, and each manufacturer has to raise funds through debt to conduct its operations. 

2. Interest Coverage Ratio

The interest coverage ratio helps us to know how much the company can earn with respect to its interest payment. It is also known as the debt service coverage ratio.

Interest Coverage Ratio = Earnings Before Interest & Tax (EBIT) / Finance Cost

To calculate EBIT, we add Finance Cost (listed as an expense) to the Profit Before Tax (PBT). For Tata Steel, the Interest Coverage Ratio stands at 5.29, which means for every ₹1 paid as interest, the company can generate ₹2.29 as revenue. A decreasing interest coverage ratio tells us that the company does not generate enough revenue to service its debt.

interest coverage ratio of tata steel, jsw steel, and jindal steel

In the graph above, Tata Steel’s interest coverage ratio was higher than peers in FY22 but fell to the industry average in FY23.

Valuation Ratios

As stock market investors, it is always ideal to buy shares of a company when it has a cheaper valuation. Valuation is the process of determining the true value of an asset or company. For example, the real estate prices of a particular plot surge when there is an announcement of a new township or tourism project. The ones who bought the plot earlier at a cheaper rate tend to enjoy the higher valuation of the property. 

Similarly, investors can measure the valuation of each stock they invest in.

1. Price-to-Earnings (P/E) Ratio

The Price-earnings ratio gives you an insight into how much the stock market participants are willing to pay for the stock for every ₹1 profit generated by the company.

Price-to-Earnings Ratio = Current Market Price/Earnings Per Share (EPS)

To calculate EPS, we divide the net profit of a firm by the total number of its shares. Tata Steel’s P/E stands at 14.57, meaning that for every ₹1 profit generated by the company, investors are ready to pay ₹14.57.

price to earnings (p/e) ratio of tata steel, jsw steel, and jindal steel

Tata Steel is slightly undervalued compared to peer companies. Meanwhile, JSW Steel is valued at a P/E of 39.89, making it a more expensive option. 

Every industry/sector has a different range of valuation. Thus, we cannot define a standard P/E range for all stocks. Therefore, we must compare the valuation to its industry averages.

2. Price to Sales (P/S) Ratio

We used Earnings Per Share (EPS) for calculating the P/E ratio. However, changes in tax slabs, new accounting rules, one-time payments, etc. can influence EPS. To overcome this, we can consider the total sales of a company to find its valuation. A low price-to-sales ratio (P/S) means that the company is relatively undervalued.

Price-to-Sales (P/S) ratio = Current Market Price/ Sales Per Share

To calculate Price-to-Sales ratio, we divide a company’s revenue from operations by the total number of shares. The P/S of Tata Steel stands at 0.52, which means that for every ₹1 earned as revenue, the company’s investors value it 0.52 times.

price to sales (P/s) ratio of tata steel, jsw steel, and jindal steel

Tata Steel has a low P/S ratio.

3. Price to Book (P/B) Ratio

Suppose a company ends its operations after liquidating assets and settling all debts. Any final amount remaining within the firm has to be distributed amongst its investors. This amount is known as the book value of a company. 

The sum of the total equity and cash reserve from a company’s balance sheet is its book value. By dividing the book value by the total number of shares, we get the book value per share.

Price to Book Ratio = Current Market Price/Book Value Per Share

For Tata Steel, the P/B ratio stands at 1.24, meaning that the stock is trading at 1.24 times its book value.

price to book (p/b) ratio of tata steel, jsw steel, and jindal steel

Here, JSW Steel has a P/B ratio of 3.15, which means it has a higher valuation. Conservative investors can consider stocks whose P/B ratio is close to 1. For modern and asset-light businesses, P/B will always be on the higher side.

Using Debt and Valuation Analysis for Investing

In the world of finance and investment, making informed decisions is key to success. Two essential tools that play an important role in this process are debt analysis and valuation analysis. Let’s explore why these tools are vital for investors seeking to make smart investment choices:

  • Risk Mitigation: Debt analysis allows investors to assess a company’s financial health by examining its debt levels. This helps in understanding the risk associated with an investment. High debt can be a red flag, indicating potential financial distress, while low or manageable debt levels can instil confidence in an investment’s stability.
  • Valuation Analysis: It involves estimating the intrinsic value of an asset or company. By comparing this value to the current market price, investors can determine whether an investment is overvalued or undervalued. Making decisions based on valuation analysis can prevent overpaying for assets and enhance long-term returns.
  • Portfolio Diversification: Understanding the debt and valuation metrics of different investments enables investors to build a diversified portfolio. A well-diversified portfolio spreads risk, reducing the impact of poor-performing assets and increasing the potential for overall returns.
  • Long-Term Success: Debt and valuation analysis provide the foundation for a disciplined investment strategy that considers both short-term fluctuations and long-term growth prospects.
  • Finding Opportunities: Valuation analysis can uncover undervalued assets or companies with growth potential. These opportunities might not be apparent without a systematic assessment of valuation metrics.
  • Enhanced Returns: Making investments based on thorough analysis can lead to improved returns over time. By buying undervalued assets and avoiding overvalued ones, investors increase their chances of profiting from market inefficiencies.

Limitations of Debt and Valuation Analysis

While debt and valuation analysis are valuable tools for investors, it’s essential to acknowledge their limitations to make well-rounded investment decisions. Here are some key limitations to consider:

  • Incomplete Information: Financial statements can sometimes lack crucial information, and companies may use accounting methods that make their financial health appear better than it actually is. This can lead to inaccuracies in debt and valuation analysis.
  • Market Sentiment: Market sentiment and investor behaviour can heavily influence stock prices and valuations. These factors may not always align with a company’s fundamentals, making it challenging to predict short-term market movements.
  • Economic Factors: Economic conditions (such as recessions or economic booms) can significantly impact the performance of companies and their debt obligations. Debt analysis may not fully account for these external factors.
  • Industry Specifics: Different industries have varying debt norms and valuation metrics. What’s considered acceptable in one industry might not apply to another. Ignoring industry-specific dynamics can lead to inaccurate conclusions.
  • Future Uncertainty: Debt and valuation analysis rely on historical data and assumptions about the future. Unexpected events, changes in market conditions, or shifts in a company’s strategy can disrupt these assumptions and render analyses obsolete.
  • Limited Scope: Debt and valuation analysis often focus on quantitative aspects, overlooking qualitative factors like company management, industry trends, and competitive dynamics. These qualitative factors can significantly impact a company’s performance.

Note: Never try to analyse a company with only one kind of ratio. Using multiple ratios and comparing them with metrics of peer players across a specific time period will give us a comprehensive insight into a company.