Categories
Jargons

5 Best Steps to Find Quality Stocks in India

Investing in the stock market can help you create wealth over the long term. However, it requires careful analysis and research to find good stocks. One must know how to effectively apply their knowledge of fundamental analysis to identify high-quality stocks. In this article, we present 5 best steps to find quality stocks to invest in for the long term.

Identify Quality Stocks

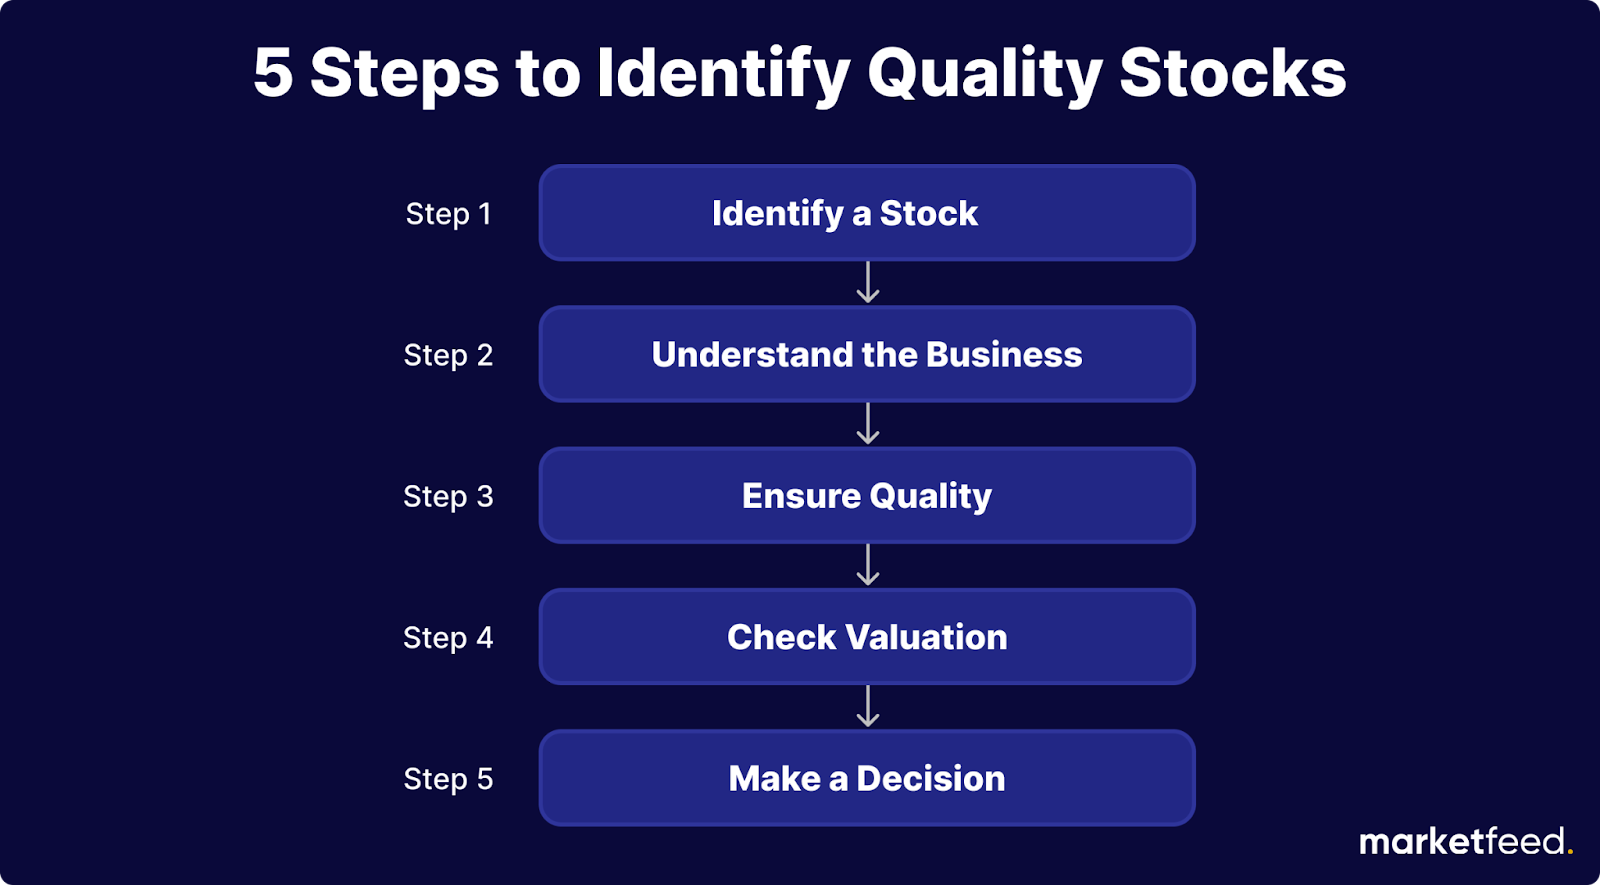
Step 1: Identify a Stock

How do we choose high-quality stocks from the thousands of companies listed on the National Stock Exchange (NSE) and Bombay Stock Exchange (BSE)? Here are five ways to identify stocks and find if they are the right ones for us to invest in for the long term:

1. Friends and Social Circles

Take notes from friends and family who invest/talk about stocks and do more research on them. You may also run into online posts or articles about good companies that you can add to your watchlist.

2. General Observation

If you notice a brand or product performing well and gaining popularity, you can verify if that company is listed on the stock exchange. If yes, you can add them to the list. Even when you go to a supermarket, you can see what products have high demand and customer base and note them down for further analysis.

3. Using Stock Screeners

You can also use stock screeners like screener.in and Tickertape, which have good preset screeners to filter or compare companies based on their fundamentals. Apart from the inbuilt filters, such as financial ratios and growth in net profits, you can also create custom filters.

4. New Sectoral Trends and Rule Changes

You can always check which industries benefit from regulatory changes and take note of the listed companies in those sectors. General observation often allows us to identify sectoral trends in many cases.

For example, the electric vehicle (EV) sector is trending because the future is moving towards green mobility. You can identify the companies directly or indirectly linked to the industry benefiting from this trend, such as battery manufacturers, electric vehicle (EV) companies, and other relevant firms.

5. Your Circle of Competence

A circle of competence is the subject area that matches a person’s skills or expertise. If you are working in the IT sector, you can analyse the business models of IT companies and identify the best ones in this sector. On the other hand, if you’re working in the medical field, you can identify good-performing pharmaceutical companies.

Utilizing all the methods above is unnecessary; their sole purpose is to help us identify companies for further study or in-depth analysis.

Step 2: Understand the Business

After identifying various companies or stocks, it’s essential to gain a comprehensive understanding of their businesses.

1. Read annual reports

Annual reports provide a comprehensive overview of a company’s financial performance, strategies, and objectives. They typically include financial statements, management discussions, and analysis. These reports are essential for investors, stakeholders, and analysts to assess the company’s profitability, growth potential, and overall financial health. They serve as a valuable source of information for decision-making and evaluating investment opportunities.

2. Gather data from media reports and interviews

Another method to understand the company’s business is by listening to its founders and management. Watch interviews with the management and founders in which they talk about their company and its business. Read news articles about them.

3. Learn everything you can about the company, business, and competitors

If the company you are analysing has a moat or a unique selling proposition (USP), it’s a bonus. [Moat refers to a business’s ability to maintain competitive advantages over its competitors to protect its long-term profits and market share.]

You can also refer to the questions given below to understand more about a business. After getting answers to these questions, you will have enough information about a company to understand its business.

Checklist before investing

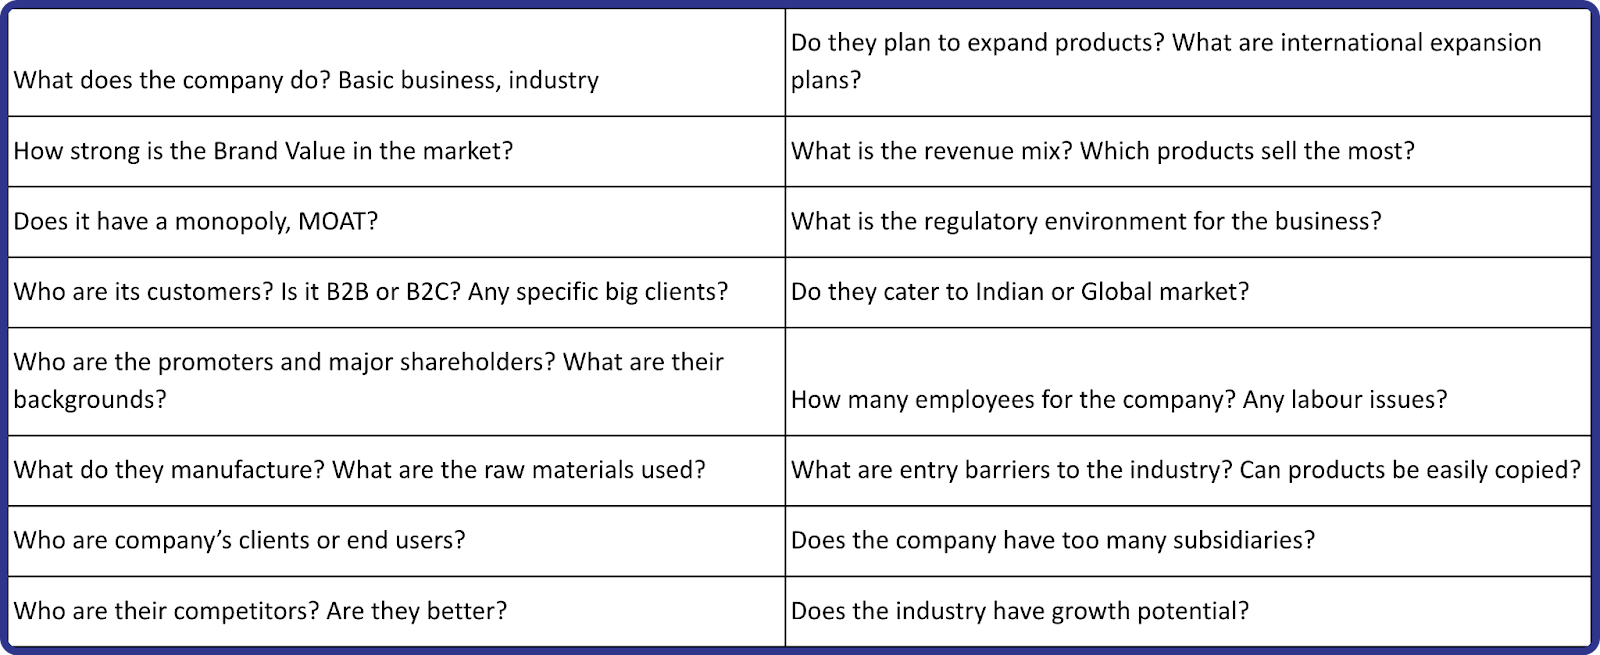
If you don’t understand a company’s business even after all this, it’s better that you don’t invest in it.

Step 3: Ensure Quality

1. Read annual reports

Reading the annual report can give you an idea about a company’s quality.

2. Read financial statements

Financial reports like a profit & loss statement and balance sheet help analyse a company’s spending decisions and debt levels.

3. Study financial ratios

Ratio analysis unveils a company’s performance and growth trajectory over time. It would be beneficial to compare a company with others in the same industry or sector. Additionally, comparing a company’s ratios with industry standards provides a better understanding of its position and performance.

You can use the checklist below to analyze quantitative and qualitative factors. The table below is only for reference. You should also consider other checklist points for better analysis.

Financial ratios and metrics

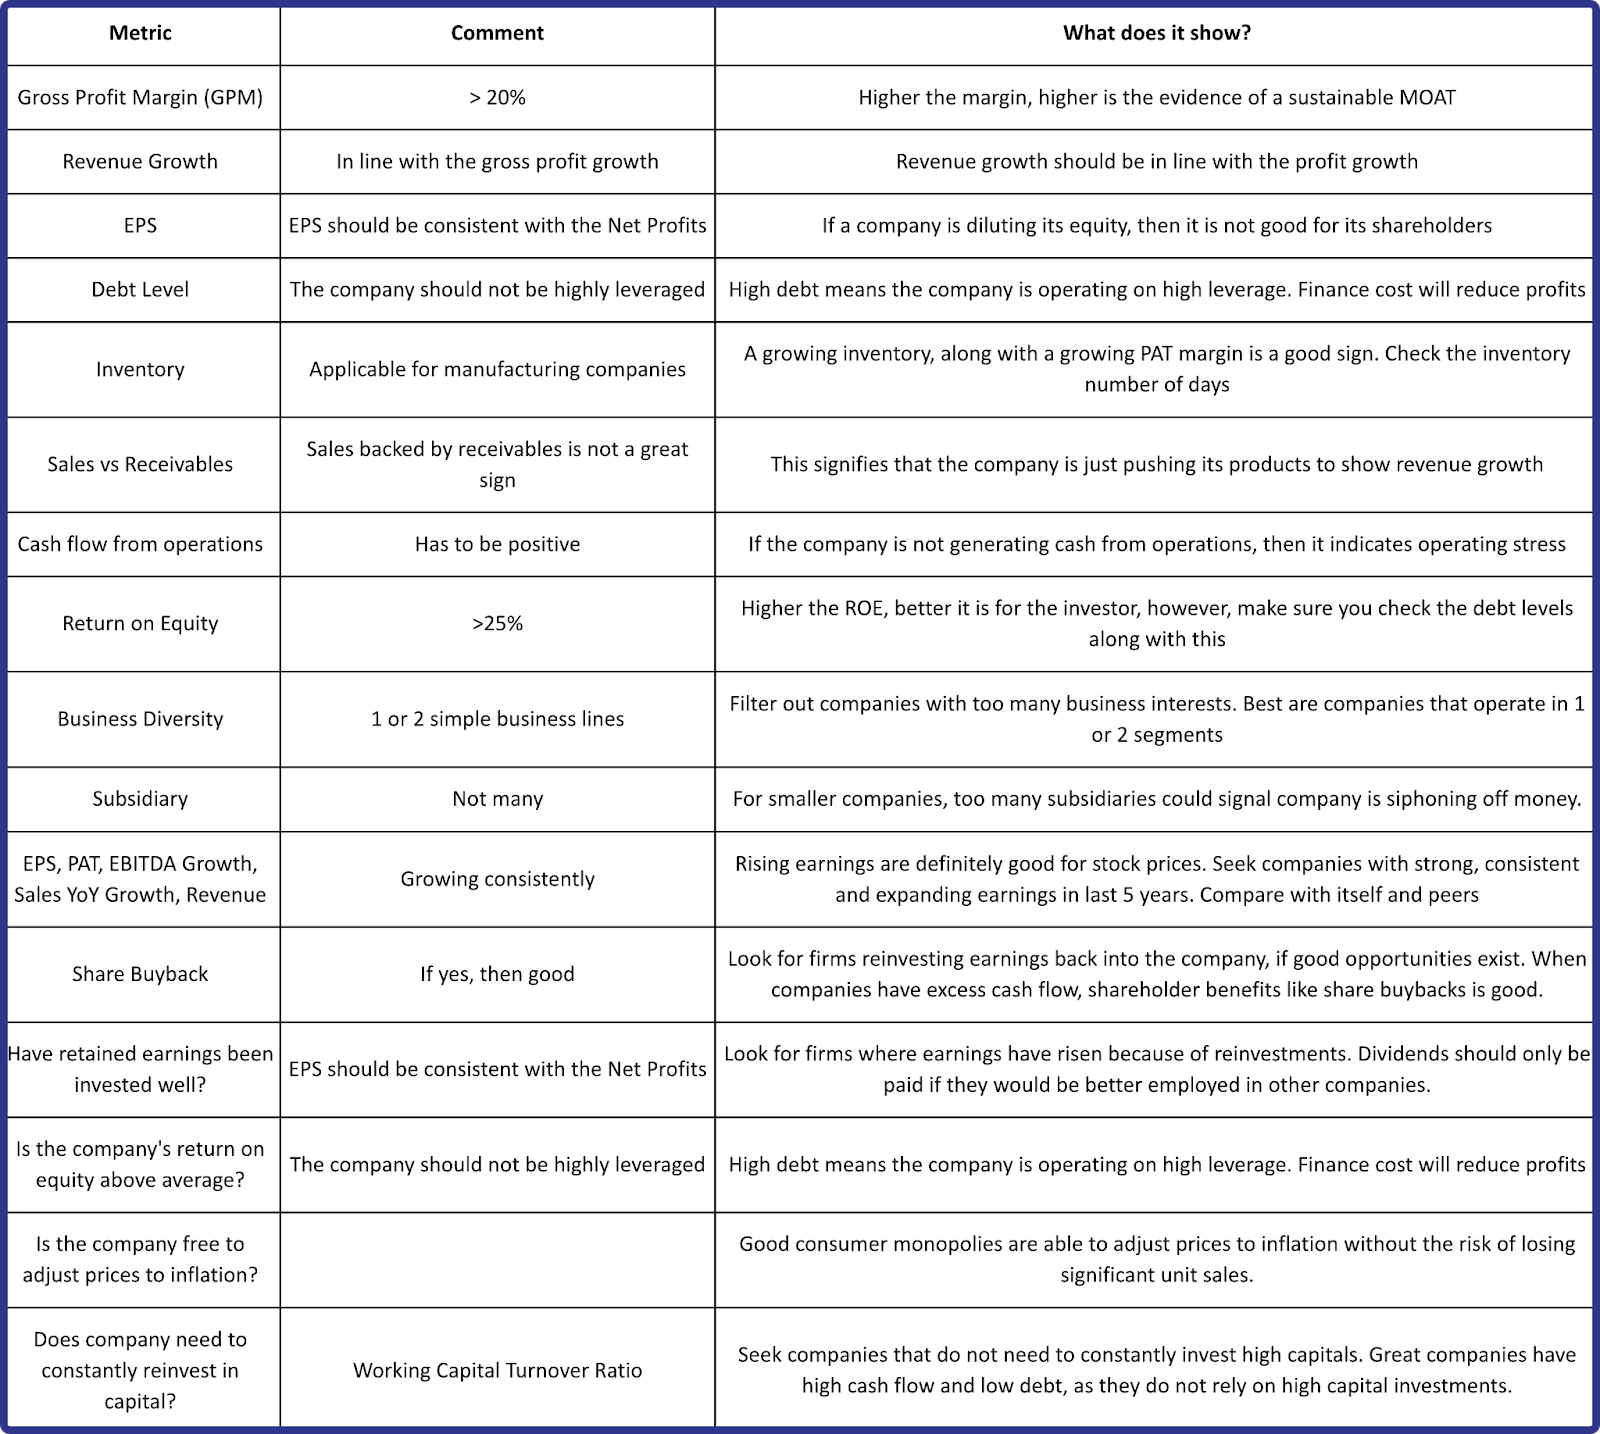
Thus, we should check both quantitative and qualitative factors while ensuring quality.

Step 4: Check Valuation

After completing the steps mentioned above and compiling a list of high-quality stocks, the next crucial step involves evaluating the value of the companies on that list. Valuation is a quantitative process of determining the fair value of an asset, investment, or firm. In this step, we compare the market value and intrinsic value of the company and determine if it is undervalued or overvalued. The market value of a company is what it is currently worth according to the market. It is calculated using the formula below:

Market Capitalisation

The market value is the value the market (retail investors and institutions) gives a company. However, the company also has a true value, which is called its intrinsic value. If the market value of a company exceeds its intrinsic value, the stock is overpriced or overvalued. On the other, if the intrinsic value surpasses the market value, it is undervalued.

After finding the intrinsic value of a company, we have two methods of investing:

1. Growth Investing

Buy a stock if it has a high growth history/potential and fits all your checklists. In growth investing, we ignore the intrinsic value of a company. If a company has been continuously growing for the past few years and still has high growth potential, we can buy its stock despite its overvaluation. For example, Hindustan Unilever has always been overvalued in the past, but it kept on growing despite its overvaluation.

2. Value Investing

Buy a stock if its current market price is lower than its intrinsic value. We choose not to buy overvalued stocks. Veteran investor Warren Buffet and his mentor Sir Benjamin Graham are renowned value investors. 

Growth Investing and Value Investing

Both growth investing and value investing can yield good returns. Growth investing is comparatively easier than value investing. However, if done right, value investing can build you a fortune!

There are many methods to value a company and find its intrinsic value. You can use Dividend Discount Model (DDM), Present Value Methods, etc to value companies.

Step 5: Make a Decision

After completing all these steps, your next action will be to make an informed decision. First, we identified a few stocks, understood their business, ensured the quality, and valued the companies. The final step is to decide whether to add that stock to your portfolio. While building a portfolio, it should be well diversified. So, we should avoid adding multiple stocks from the same industry to our portfolio.

When to Invest?

The two ways in which people invest in stocks are:

1. Lump Sum Investment

When we invest a huge amount into stocks all at once, it is called a lump sum investment. People usually do this when they receive bonuses or a large sum. However, the drawback of this method is that we cannot maintain a better average price. If we make a lumpsum investment and the stock keeps on falling, we cannot take advantage of this price discount as all the money was invested in a single go.

2. Systematic Investment Plan (SIP)

SIP is a method of investing a fixed sum regularly into a portfolio. Most salaried people have a regular income every month. Out of this, they invest a certain percentage as SIP. A better average price can be maintained in this method as the purchase price will be lower and higher sometimes. 

In value investing, we only buy the stock when the intrinsic value is lower than its actual market value. Only a lump sum investment is possible here. On the other hand, with growth investing, we can invest in SIPs. One can perform technical analysis and buy the stock when its price dips or at regular intervals, such as monthly or weekly. 

We should always invest in a portfolio of high-quality stocks while investing for the long term. If we invest in a single stock or sector/industry, there won’t be any diversification. When that particular industry starts performing poorly, our portfolio also dips substantially. Success in long-term investment is not finding or selecting that single multibagger stock. Rather, it is finding out and investing in a well-diversified portfolio.

Disclaimer: The information or any examples mentioned in this article are purely for educational purposes. Please do your own research before investing in stocks for the long term.

Categories
Jargons

How to Analyse Debt and Valuation of a Company?

We often come across a lot of different financial ratios with complex names and become confused about the kinds of metrics to use when analyzing different companies listed in the stock market. In this article, we will discuss how to analyse the debt and valuation of a company (by using Tata Steel as an example).

Understanding Debt and Valuation

Debt refers to the total amount of money that a company owes to external creditors or lenders. It can arise from various sources, including loans, bonds, lines of credit, and other forms of borrowing. When a company borrows money, it agrees to repay the borrowed funds over time, often with interest. Companies take in debt for financing operations, expanding their business, investing in new projects, acquiring assets, or managing cash flow fluctuations. Debt can be an important tool for companies to raise capital and achieve their growth objectives. However, it also comes with the responsibility of making regular interest payments and eventually repaying the principal amount borrowed.

Meanwhile, valuation means finding the real worth of a company. Market participants use it to determine the price they are willing to pay or accept when selling a business. Thus, value investing is based on the true value of a business compared to its market value.

  • The market value of a business is the worth that the market assigns to it. To calculate the market value of a publicly traded company, multiply its share price by the number of outstanding shares.
  • Intrinsic value is the true and accurate worth of a company. It is the anticipated or calculated value determined through fundamental analysis.
  • If the market value of a company is higher than its intrinsic value, then the stock is currently overpriced or overvalued. On the other hand, if the intrinsic value of a company is lower than its market value, then the company is undervalued.

Debt Analysis Ratios (Leverage Ratios)

For a company, debt (leverage) is like a double-edged sword. They can scale their business and improve sales with the help of debt funds. However, if not used wisely, the interest to be paid for these borrowings can eat up the company’s profits. It could also lead to a crunch in the cash reserved for future operations.

The following are the different types of leverage ratios:

1. Debt-to-Equity Ratio

Equity is the value attributable to the shareholders of a company. It is calculated by subtracting liabilities from the value of the assets. The debt-to-equity ratio tells us how much borrowings are present in a company compared to its equity.

Debt-to-Equity Ratio = Total Debt/Total Equity

We can find the total equity of a company in its balance sheet. By adding the borrowings from the current and non-current liabilities, we get debt. For Tata Steel, the ratio stood at 0.76X  in FY23, which means that for every ₹1 equity in the company, there exists ₹0.76 as debt. A higher Debt-to-Equity ratio indicates a higher amount of debt compared to equity.

debt to equity ratio analysis of tata steel, jsw steel, jindal steel

From the graph shown above, we can conclude that Tata Steel has been able to reduce its debts, although it has increased slightly this year. The company’s Debt-to-Equity ratio is also aligned with the industry average. We can also conclude that the steel sector is capital-intensive, and each manufacturer has to raise funds through debt to conduct its operations. 

2. Interest Coverage Ratio

The interest coverage ratio helps us to know how much the company can earn with respect to its interest payment. It is also known as the debt service coverage ratio.

Interest Coverage Ratio = Earnings Before Interest & Tax (EBIT) / Finance Cost

To calculate EBIT, we add Finance Cost (listed as an expense) to the Profit Before Tax (PBT). For Tata Steel, the Interest Coverage Ratio stands at 5.29, which means for every ₹1 paid as interest, the company can generate ₹2.29 as revenue. A decreasing interest coverage ratio tells us that the company does not generate enough revenue to service its debt.

interest coverage ratio of tata steel, jsw steel, and jindal steel

In the graph above, Tata Steel’s interest coverage ratio was higher than peers in FY22 but fell to the industry average in FY23.

Valuation Ratios

As stock market investors, it is always ideal to buy shares of a company when it has a cheaper valuation. Valuation is the process of determining the true value of an asset or company. For example, the real estate prices of a particular plot surge when there is an announcement of a new township or tourism project. The ones who bought the plot earlier at a cheaper rate tend to enjoy the higher valuation of the property. 

Similarly, investors can measure the valuation of each stock they invest in.

1. Price-to-Earnings (P/E) Ratio

The Price-earnings ratio gives you an insight into how much the stock market participants are willing to pay for the stock for every ₹1 profit generated by the company.

Price-to-Earnings Ratio = Current Market Price/Earnings Per Share (EPS)

To calculate EPS, we divide the net profit of a firm by the total number of its shares. Tata Steel’s P/E stands at 14.57, meaning that for every ₹1 profit generated by the company, investors are ready to pay ₹14.57.

price to earnings (p/e) ratio of tata steel, jsw steel, and jindal steel

Tata Steel is slightly undervalued compared to peer companies. Meanwhile, JSW Steel is valued at a P/E of 39.89, making it a more expensive option. 

Every industry/sector has a different range of valuation. Thus, we cannot define a standard P/E range for all stocks. Therefore, we must compare the valuation to its industry averages.

2. Price to Sales (P/S) Ratio

We used Earnings Per Share (EPS) for calculating the P/E ratio. However, changes in tax slabs, new accounting rules, one-time payments, etc. can influence EPS. To overcome this, we can consider the total sales of a company to find its valuation. A low price-to-sales ratio (P/S) means that the company is relatively undervalued.

Price-to-Sales (P/S) ratio = Current Market Price/ Sales Per Share

To calculate Price-to-Sales ratio, we divide a company’s revenue from operations by the total number of shares. The P/S of Tata Steel stands at 0.52, which means that for every ₹1 earned as revenue, the company’s investors value it 0.52 times.

price to sales (P/s) ratio of tata steel, jsw steel, and jindal steel

Tata Steel has a low P/S ratio.

3. Price to Book (P/B) Ratio

Suppose a company ends its operations after liquidating assets and settling all debts. Any final amount remaining within the firm has to be distributed amongst its investors. This amount is known as the book value of a company. 

The sum of the total equity and cash reserve from a company’s balance sheet is its book value. By dividing the book value by the total number of shares, we get the book value per share.

Price to Book Ratio = Current Market Price/Book Value Per Share

For Tata Steel, the P/B ratio stands at 1.24, meaning that the stock is trading at 1.24 times its book value.

price to book (p/b) ratio of tata steel, jsw steel, and jindal steel

Here, JSW Steel has a P/B ratio of 3.15, which means it has a higher valuation. Conservative investors can consider stocks whose P/B ratio is close to 1. For modern and asset-light businesses, P/B will always be on the higher side.

Using Debt and Valuation Analysis for Investing

In the world of finance and investment, making informed decisions is key to success. Two essential tools that play an important role in this process are debt analysis and valuation analysis. Let’s explore why these tools are vital for investors seeking to make smart investment choices:

  • Risk Mitigation: Debt analysis allows investors to assess a company’s financial health by examining its debt levels. This helps in understanding the risk associated with an investment. High debt can be a red flag, indicating potential financial distress, while low or manageable debt levels can instil confidence in an investment’s stability.
  • Valuation Analysis: It involves estimating the intrinsic value of an asset or company. By comparing this value to the current market price, investors can determine whether an investment is overvalued or undervalued. Making decisions based on valuation analysis can prevent overpaying for assets and enhance long-term returns.
  • Portfolio Diversification: Understanding the debt and valuation metrics of different investments enables investors to build a diversified portfolio. A well-diversified portfolio spreads risk, reducing the impact of poor-performing assets and increasing the potential for overall returns.
  • Long-Term Success: Debt and valuation analysis provide the foundation for a disciplined investment strategy that considers both short-term fluctuations and long-term growth prospects.
  • Finding Opportunities: Valuation analysis can uncover undervalued assets or companies with growth potential. These opportunities might not be apparent without a systematic assessment of valuation metrics.
  • Enhanced Returns: Making investments based on thorough analysis can lead to improved returns over time. By buying undervalued assets and avoiding overvalued ones, investors increase their chances of profiting from market inefficiencies.

Limitations of Debt and Valuation Analysis

While debt and valuation analysis are valuable tools for investors, it’s essential to acknowledge their limitations to make well-rounded investment decisions. Here are some key limitations to consider:

  • Incomplete Information: Financial statements can sometimes lack crucial information, and companies may use accounting methods that make their financial health appear better than it actually is. This can lead to inaccuracies in debt and valuation analysis.
  • Market Sentiment: Market sentiment and investor behaviour can heavily influence stock prices and valuations. These factors may not always align with a company’s fundamentals, making it challenging to predict short-term market movements.
  • Economic Factors: Economic conditions (such as recessions or economic booms) can significantly impact the performance of companies and their debt obligations. Debt analysis may not fully account for these external factors.
  • Industry Specifics: Different industries have varying debt norms and valuation metrics. What’s considered acceptable in one industry might not apply to another. Ignoring industry-specific dynamics can lead to inaccurate conclusions.
  • Future Uncertainty: Debt and valuation analysis rely on historical data and assumptions about the future. Unexpected events, changes in market conditions, or shifts in a company’s strategy can disrupt these assumptions and render analyses obsolete.
  • Limited Scope: Debt and valuation analysis often focus on quantitative aspects, overlooking qualitative factors like company management, industry trends, and competitive dynamics. These qualitative factors can significantly impact a company’s performance.

Note: Never try to analyse a company with only one kind of ratio. Using multiple ratios and comparing them with metrics of peer players across a specific time period will give us a comprehensive insight into a company.