Categories
Jargons

What are Technical Indicators: Definitions and Types?

Becoming an amazing trader requires mastering price action and technical indicators. This article provides a basic understanding of technical indicators, including what they are, how to plot them, the different types available, and some tips on how to use them effectively.

When it comes to trading, there are three different groups of traders with different approaches to trading. The first group uses only price action, the second group uses only technical indicators and the last group uses both price action and technical indicators.

The debate of price action vs indicators has been going on for a really long time. However, you must find your balance between the two of them to find high-probability trades and make money.

What is a Technical Indicator?

Technical indicators are mathematical tools or calculations derived from a security’s historical price and volume data. It includes intelligent analysis of the historical price and volume data to predict future price movement, which can be done in two ways: price action-based method and through technical indicators.

Technical indicators are more advanced than price action methods as they use mathematical calculations to make predictions about a stock’s future movement. For example, using the average of a player’s historical performance to predict their future performance is similar to using technical indicators to predict future price movements.

Types of Technical Indicators

types of technical indicator | marketfeed

Technical indicators can be classified into three main categories based on:

(1) Where they are plotted

Indicators are categorised into two groups based on their placement on a chart:

    • Overlays are plotted over the price in a chart. For example, Moving averages and Bollinger bands are overlays.
    • Underlays are plotted below the price in a chart. For example, RSI and Stochastics are underlays.
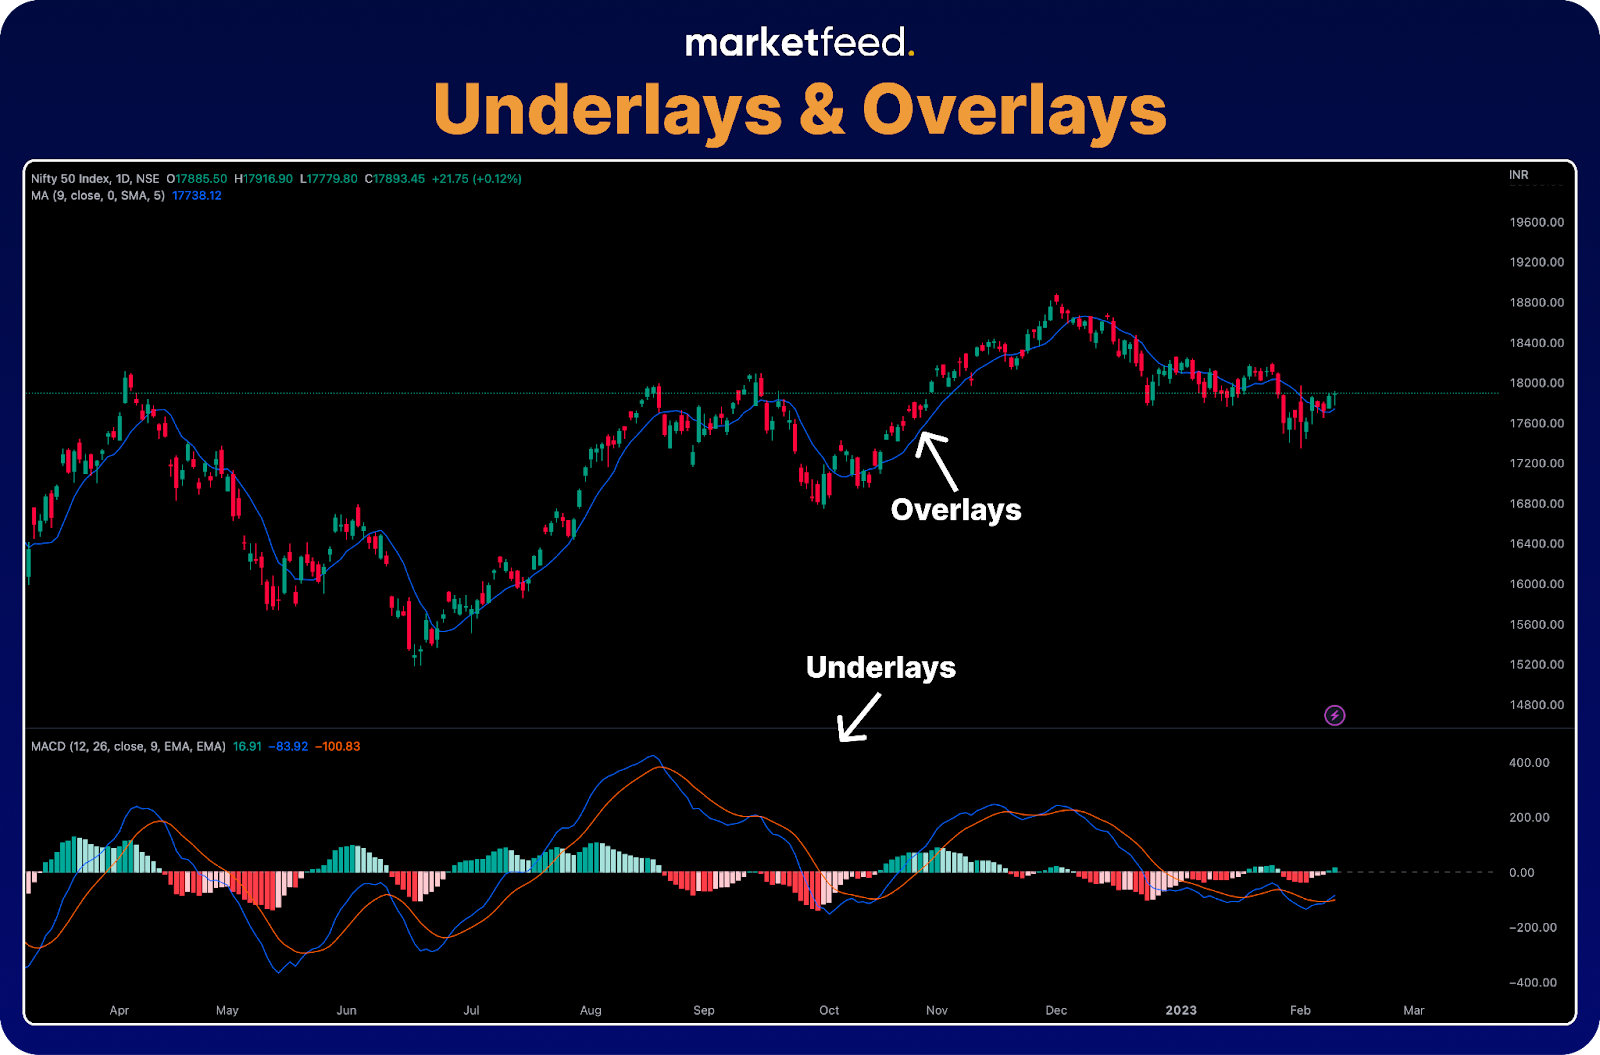
    underlays & overlays - technical indicators | marketfeed

    In the above chart,

    • The moving average indicator has been plotted on the price, thus making it an overlay.
    • The MACD indicator has been plotted under the price chart, thus making it an underlay.

    (2) When do they indicate

    Indicators are separated into two groups based on when they indicate:

    • Lagging indicators give signals after a trend or reversal has started. They follow the price action and are used for confirming trends or reversals. For example, Moving averages and Bollinger bands are lagging indicators.
    • Leading indicators give signals even before the trend/movement has begun. For example, RSI and Stochastics are leading indicators.

    (3) What do they indicate?

    Indicators are separated into four groups based on when they indicate:

    • Trend indicators are used to confirm the trend and measure the direction and strength of the trend. For example, Moving averages and MACD.
    • Momentum indicators are used to determine the strength or weakness of the price movement. For example, Stochastics and RSI.
    • Volatility indicators measure the price range and the periods of high and low volatility. For example, ATR and Bollinger bands.
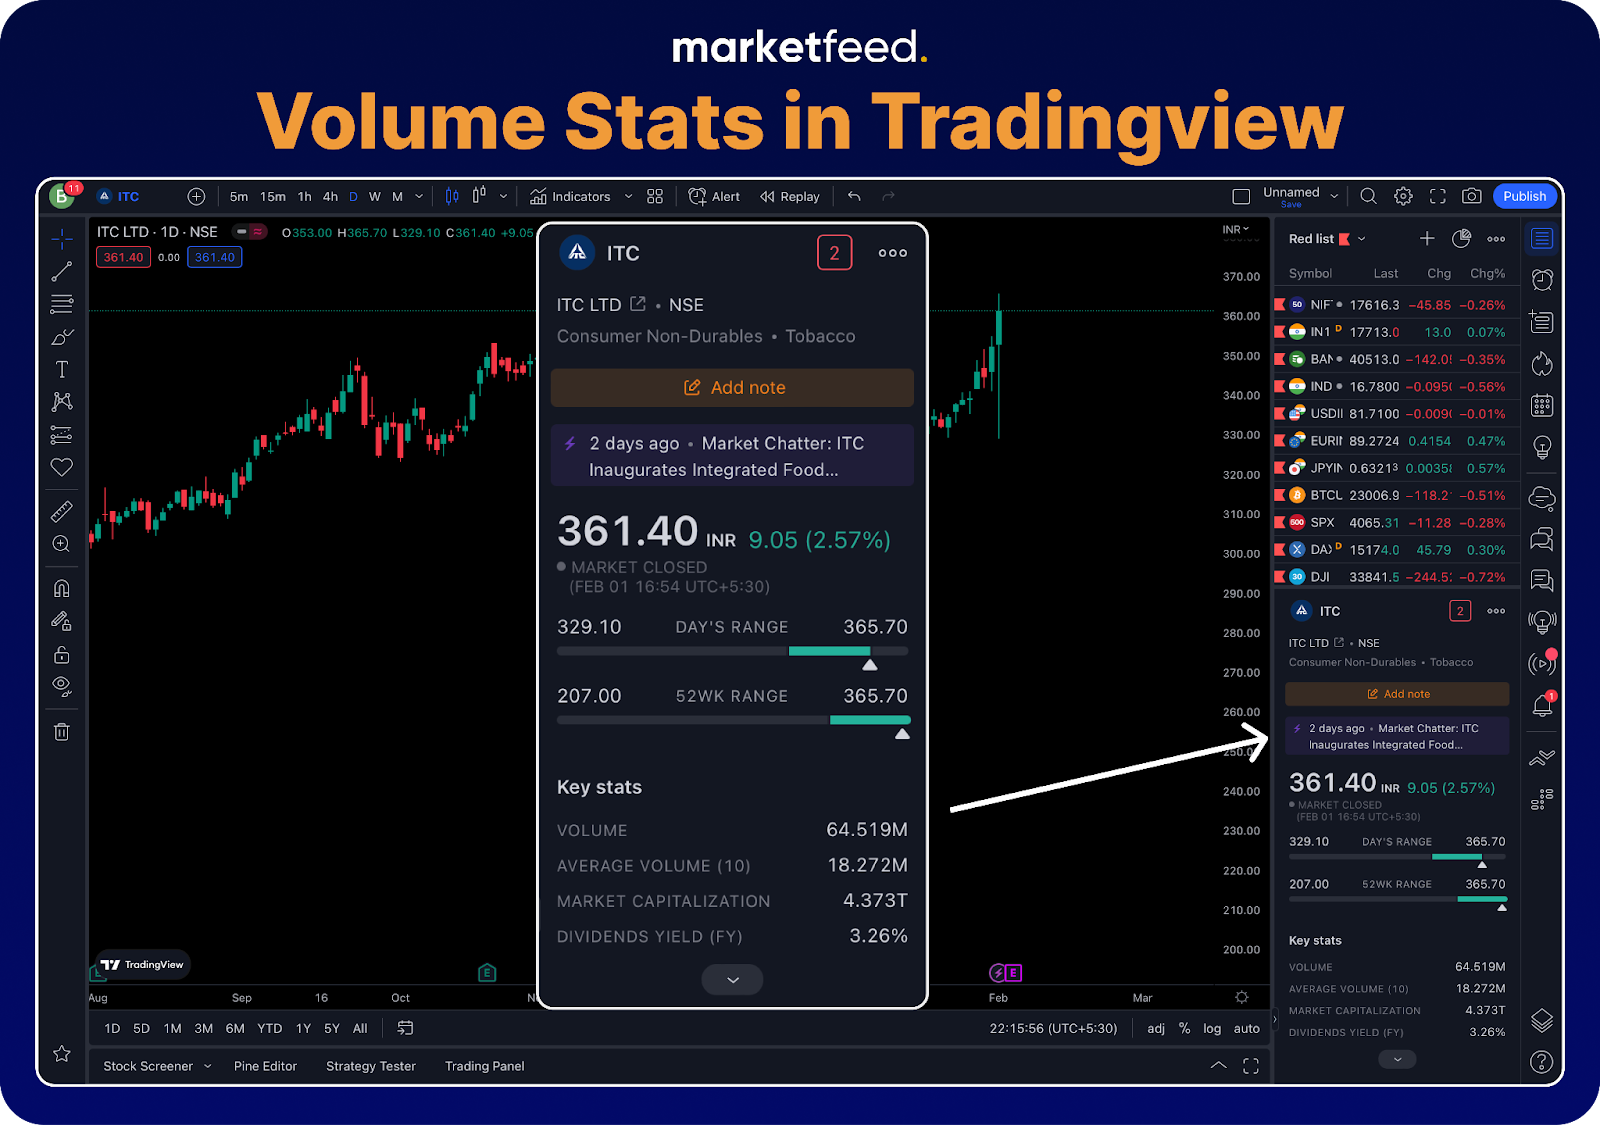
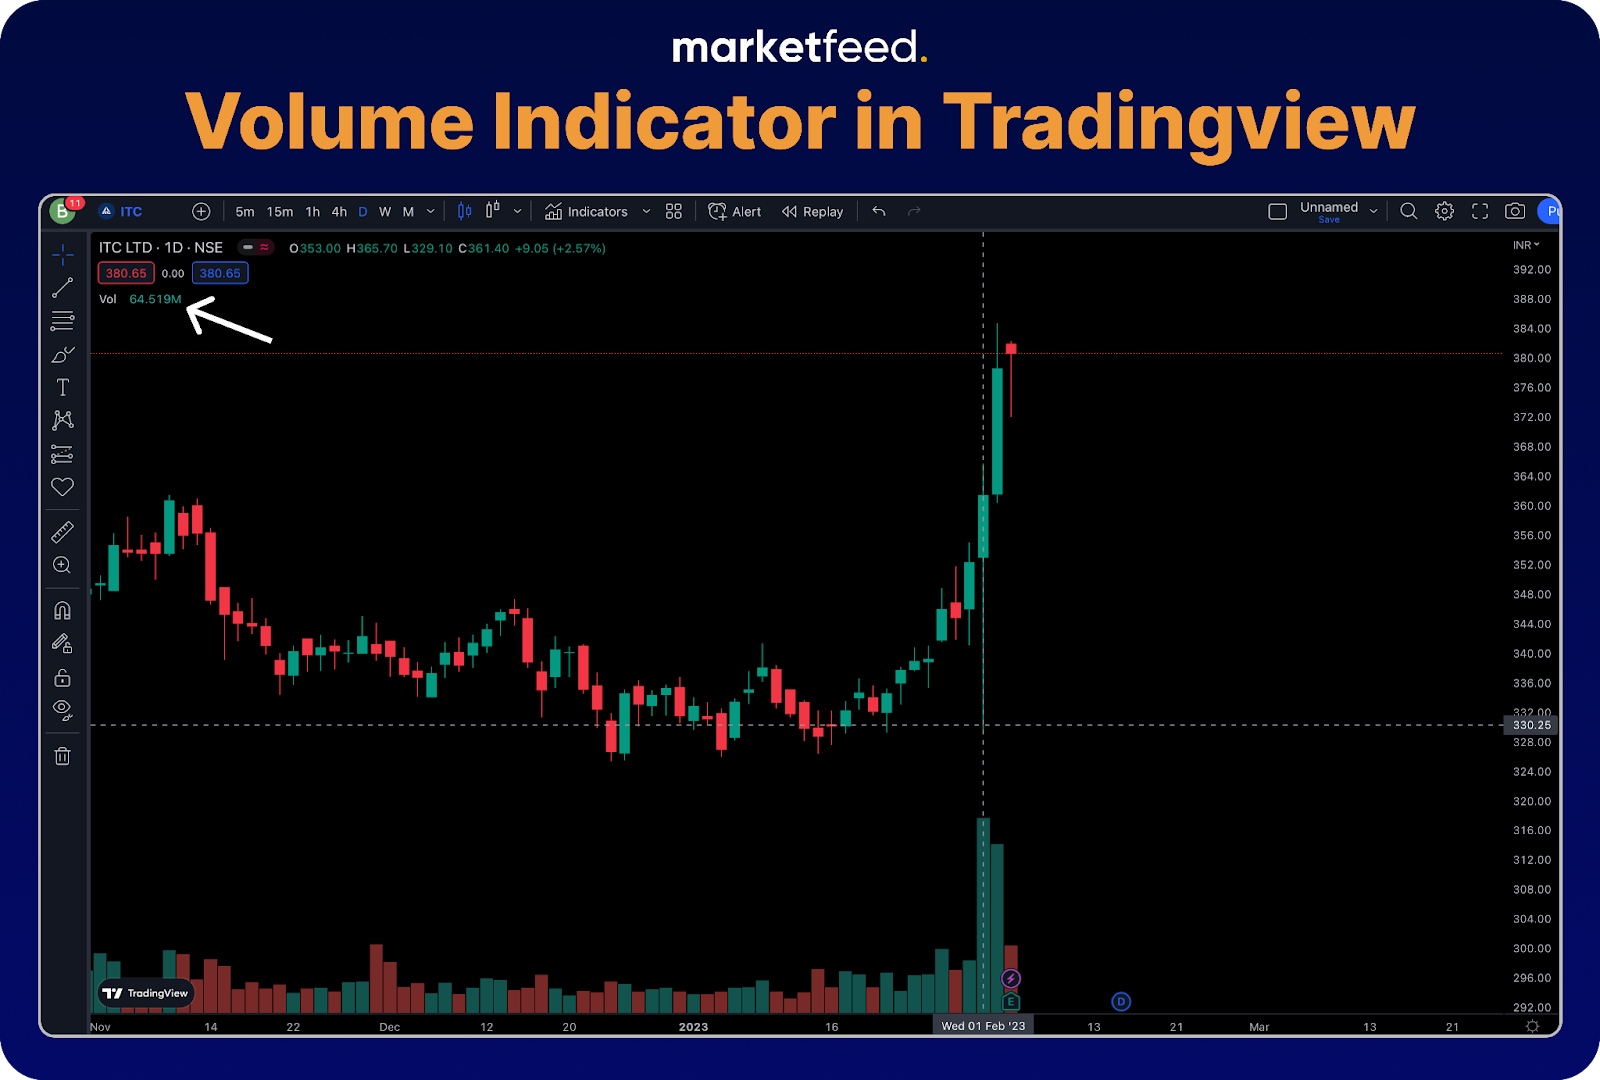
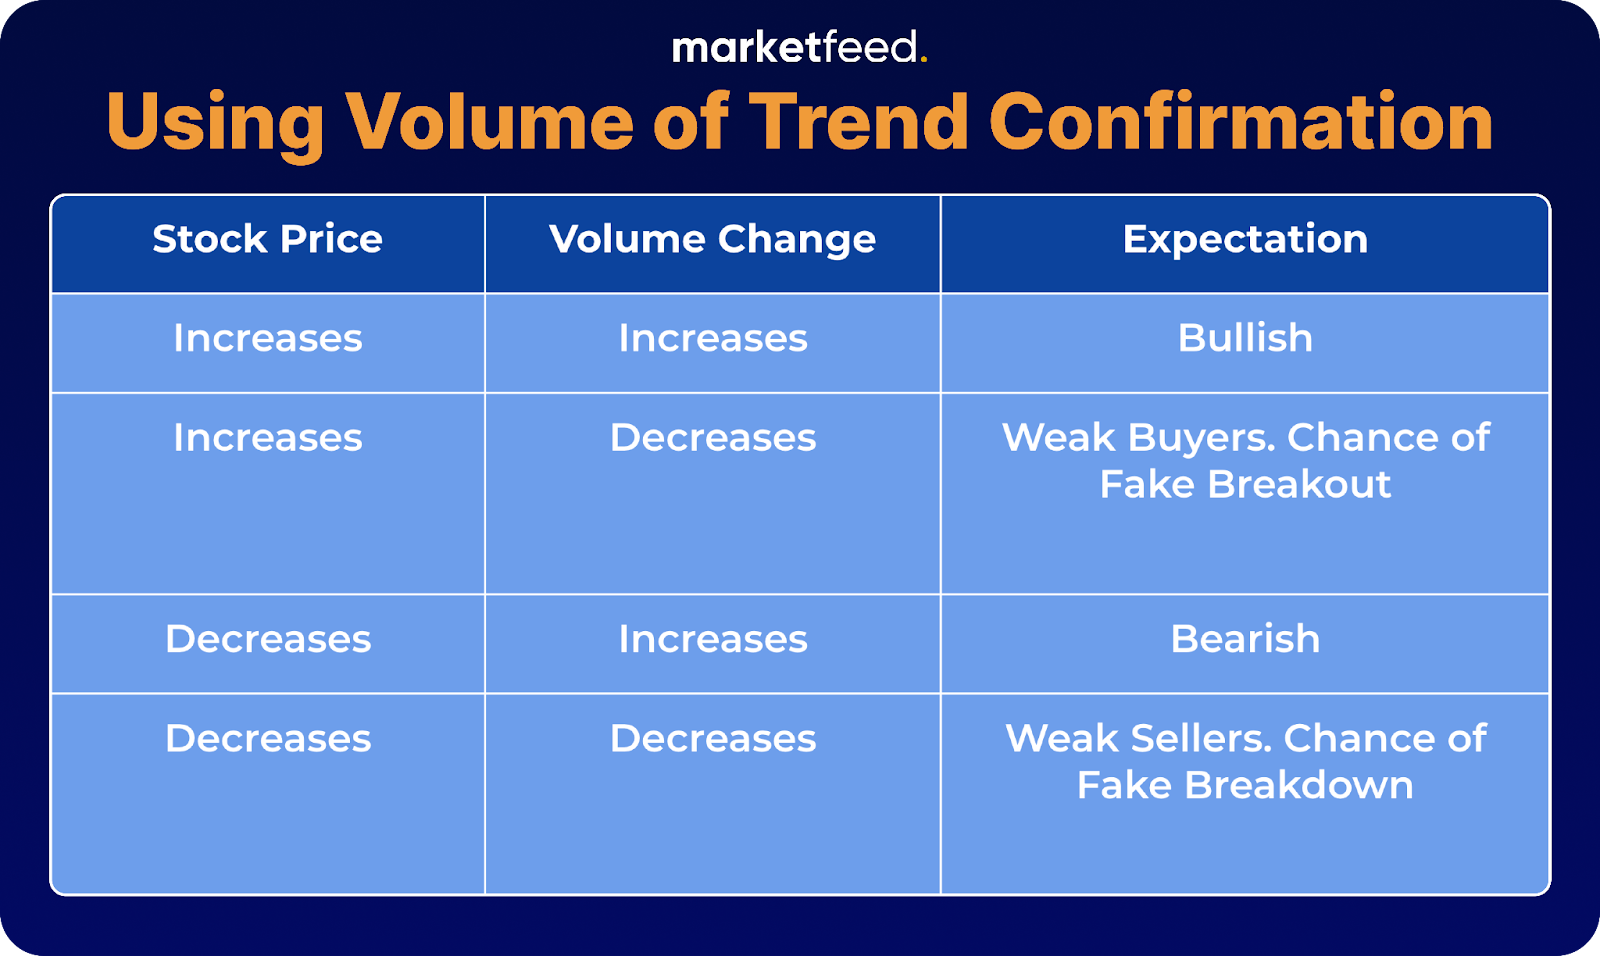
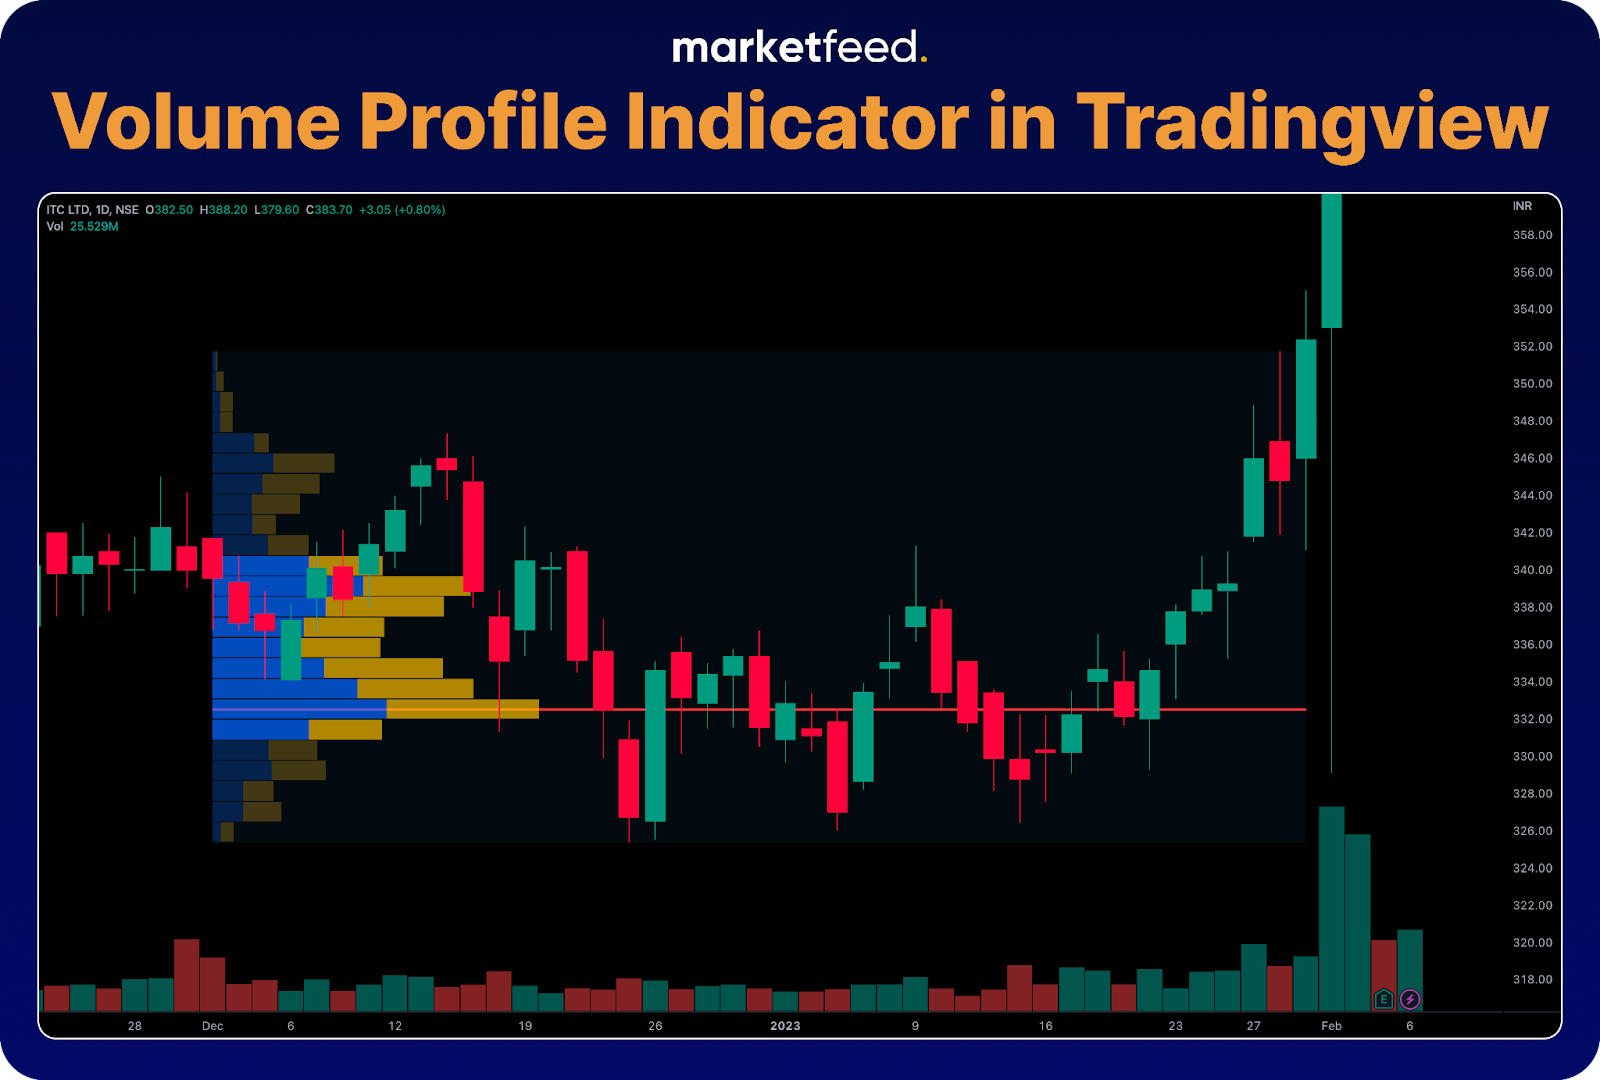
    • Volume indicators measure trend strength & confirm it with the help of volume. Trends are stronger when volume indicators give confirmation. For example, volume chart and OBV.

    How to Access Indicators?

    In TradingView

    • Click on the indicators menu on the top panel to open the indicators search bar.
    • Search the required indicator and select it.
    • The indicator will be plotted on the chart.
    access indicators - technical indicators | marketfeed

    You can also hide/unhide indicators by clicking on the eye button next to the indicator name on the top left side of the chart under the scrip name. This is helpful as you can hide/unhide indicators depending on your trading setup and don’t have to remove and add an indicator every time you need it.

    Things to Keep in Mind While Using Technical Indicators

    • In reality, there are no perfect indicators when it comes to trading. 
    • Traders need to find a combination of technical indicators that work for them in their analysis. 
    • Overusing indicators and relying solely on them can lead to a cluttered chart and inaccurate analysis. 
    • Different indicators may work well for different stocks or indices, so it’s important to understand what works best for each security and situation. 
    • It’s crucial to understand that indicators will not give a true understanding of the market and that price action analysis should also be incorporated.

    In this article, we covered the basics of technical indicators! These indicators act as insightful guides for traders, helping them navigate the dynamic landscape of market trends and potential reversals. As you venture into the world of stocks, let these tools be your allies, providing valuable signals to enhance your trading strategy. Happy trading!

    Categories
    Jargons

    What is Volume in the Stock Market? How to Analyse It?

    Volume analysis is a crucial aspect of technical analysis that traders often overlook and misunderstand. In this article, we aim to clarify various misconceptions about volume in the stock market and provide a comprehensive overview of its use. We will discuss what volume is, its purpose, and how it can be used for trend confirmation. Additionally, we will explore the volume profile indicator, a powerful tool for understanding the behaviour of institutional traders. 

    What is Volume?

    Volume is the total number of shares bought and sold over a specific period. However, people mistake volume for the number of trades that happen. If there are 10 buyers and 10 sellers, and each buyer and seller exchange 10 shares, then the volume is 100. So volume is the number of shares exchanged and not the number of trades, transactions, buyers, or sellers. 

    The number of sellers and buyers does not matter because for a trade to take place or a share to be transferred, there must be both a buyer and a seller, as they are the counterparties required for the transaction to occur.

    Volumes can be of any time frame as it is measured over a period of time. The 5-minute volume indicates the number of shares exchanged within the 5 minutes. Similarly, a 1-month timeframe shows the number of shares transferred within the month.

    The volume indicates the level of interest in a particular security. For example, if there is a huge increase in the volume of security in the 5-minute timeframe, it means that the interest in the particular security at that time has increased.

    How to See Volume?

    You can see the volume of a stock on your broker’s terminal and charts. The volume indicator displays the volume. 

    If you go to the key stats section on the right side of the TradingView terminal, it shows the volume of the day and the average volume over the past 10 days.

    volume in tradingview | marketfeed

    To add the volume indicator to your chart in TradingView, go to the indicators menu on the top bar and add volume by searching on the search bar. 

    Once you add the volume indicator, the volume bars will be displayed at the bottom of the chart, like in the below image.

    volume in stock market indicator | marketfeed

    If you hover the crosshair over any candle, the volume during that time period will be displayed on the top left side of the chart. Each volume bar corresponds to the candlestick above it. In the above example, each candle is of a 1-day timeframe and therefore each volume bar represents daily volume. If you change the timeframe to, say 5 minutes, each volume bar represents volume during 5-minute periods.

    Why are Volume Bars Red & Green?

    The colour of the volume bar depends on the colour of the candlestick. If the candlestick is red, then the corresponding volume bar will also be red.

    A common misconception among beginners is that red volume bars indicate more sellers. A red volume bar only indicates that sellers are more active than buyers and as a result the price gets pushed down, making the candle red or bearish.

    Uses of Volume in Stock Market

    • Volume is one of the ‘fundamental truths’ about the market because it indicates the interest in the stock. A higher volume indicates a higher interest.
    • Volume helps us confirm if trends and patterns are backed by the interest of the majority of market participants. For example, If a breakout is happening without volume, it could be seen as market participants not ‘believing’ in that move.
    • Active traders generally prefer high volume when trading an instrument. When you are considering entering a trade, always check if there is enough volume in that security. If it is illiquid, you will face liquidity issues.

    Using Volume for Trend Confirmation

    volume trend | marketfeed

    Traders can use the above cheatsheet to confirm trends and patterns by incorporating volume analysis. To understand if the volume is increasing or decreasing, you can observe the volume bars and their size over a specific period. If the size of the current volume bar is higher than the previous bar.

    Practical Application of Volume for Trading

    1. You can use volume to confirm breakouts/breakdowns

    • Helps to enter, exit, or remain in a trade.
    • For example, if a breakout happens and there is an increase in volume, you can consider entering a long trade.

    2. Use volume shocker screeners to find good stock trading opportunities.

    • You can use platforms like Chartink to filter out stocks with high volume to find trading opportunities.
    • Go to chartink.com and click on screeners.
    • Search volume shocker in the search bar to find screeners that filter stocks with unusual volume.
    • You can select stocks from the screened list to identify stocks with potential trading opportunities.

    Volume Profile Indicator

    A volume profile indicator shows the trading activity at different price levels over a period of time. 

    • It reveals the significant price levels on the chart by showing the total volume traded at different price levels.
    • A red line indicates the zone with the highest trading volume.
    • Helps to gain an understanding of where significant volumes are being traded, giving them a clearer perspective on market activity and sentiment.

    How to Access the Volume Profile Indicator?

    • Select the fixed range volume profile tool from the prediction and measurement tools under the tools panel on the left side of the chart. 
    • Since this indicator calculates data over a time period, we need to set a start and end time. This can be done by clicking on the chart to define the starting time and clicking again to define the ending time. 
    • Once the start and end time is set, the indicator will display the data in the form of a histogram based on the volume at the particular price levels.
    volume profile indicator | marketfeed
    • In the above example, the data is measured from December 1, 2022 to January 31, 2023.
    • The red line indicates that the highest number of transactions took place at ₹333.
    • The histogram indicates the number of transactions at different price levels.

    In conclusion, volume can help you assess the strength or conviction of buyers and sellers in determining a security’s price and thus volume analysis is one of the most useful tools in technical analysis. Always make sure to use volume analysis in combination with other analyses for better results!

    Categories
    Jargons

    What is a Stock Split and How Does it Work?

    A stock split is an action in which a company divides its existing shares into multiple smaller shares. However, the market capitalisation of the company remains unchanged. A stock split does not dilute the ownership of shares. In this article, we will understand what a stock split is, the key factors driving it, its importance, and its advantages & disadvantages.

    What is a Stock Split?

    A stock split is a corporate action in which a company divides its existing shares into multiple shares of a smaller price. The primary goal of a stock split is to increase the number of outstanding shares while decreasing the price per share. This process does not affect the company’s market capitalisation or total value.

    A company generally announces a stock split to make it cheaper to buy, making it more affordable for a small retail investor. It increases the demand for the stock and provides the company with liquidity (or cash in hand). 

    For example, the current market price of MRF Ltd is ~₹1,09,000 per share (as of September 28, 2023). Most retail investors would not be able to buy even 1 share of the tyre manufacturer. However, they are more likely to buy it if the shares are priced at ₹1,000. The company can do a stock split in this situation to make it affordable for retailers.

    Impact of Stock Split on a Company:

    • Market capitalization remains the same.
    • Demand for stock increases.
    • Share price: First decreases and then gradually starts to increase.
    • No. of outstanding shares increases.
    • Earning Per Share and dividend decrease.

    How Does a Stock Split Work?

    A stock split is a process that involves dividing a company’s existing shares into a larger number of new shares with a lower price. Here’s how it typically works:

    1. Company Decision

    A company’s Board of Directors decides whether to initiate a stock split. The decision is usually taken in response to various factors, such as the desire to make the stock more affordable for investors or increase liquidity. However, it also reduces the company’s Earnings Per Share (EPS), making it less attractive.

    2. Announcement

    After the decision is made, the company publicly announces the stock split. In the announcement, the company will specify the split ratio (e.g., 2:1, 3:1, etc.) and the split’s effective date.

    What is a Split Ratio?

    A split ratio is a numerical expression that indicates how a company’s shares will be divided or split during a stock split.

    Consider a split ratio of 2:1. The company increases the number of its outstanding shares by dividing each existing share into two new shares. This means that for every single share an investor owns before the split, they will receive two shares after the split.

    For example, if you own 100 shares of a company’s stock trading at ₹100 per share, and the company undergoes a 2:1 stock split, you will now own 200 shares, but each of these new shares will be valued at ₹50. The overall value of your investment remains unchanged at ₹10,000 (100 shares x ₹100 before the split = 200 shares x ₹50 after the split).

    3. Record Date

    The company determines a record date, also known as the “split date.” Shareholders who own the stock on this date will be eligible to receive the additional shares resulting from the split.

    4. Split Execution

    On the effective date, the stock split is executed. For example, in a 2:1 stock split, for every share a shareholder owns, they will receive two new shares. The total number of outstanding shares increases, but the individual share price decreases proportionally.

    5. Demat Credit

    The additional shares resulting from the split are credited to the shareholders’ demat account. Shareholders do not need to take any action to receive these additional shares.

    6. Adjusted Share Price & Trading

    After the split, the share price is adjusted to reflect the new ratio. For example, if a company’s stock was trading at ₹1,000 per share before a 2:1 split, it would trade at ₹500 per share after the split. The trading symbol for the stock remains the same, only the price and the number of shares available have changed.

    How Does a Stock Split Affect Share Price, Volume, and Liquidity?

    Share Price

    When a company does a stock split, they make more shares, and each one becomes cheaper. For example, suppose you had one stock worth ₹1,000 before. After a 2:1 split, you’d have two shares, and each would be worth about ₹500.

    This lower price often makes it more affordable to investors. So, more retail investors might want to buy the stock, even if they couldn’t before because it was too expensive.  But in the short run, the price can get volatile.

    Volume

    After a stock split, the volume of trading in the stock increases as the shares are now cheaper.

    Liquidity

    Liquidity refers to the ability to buy and sell stock at the desired price without significantly affecting the stock’s price. Stock splits improve liquidity by increasing the number of shares available for trading. Lower share prices resulting from a split can make the stock more accessible to a wider range of investors, including retail investors. This increased accessibility can further boost liquidity as more investors participate in trading.

    Practical Examples of Stock Split

    Example 1: A company ABC, whose value of each share is $30, announces a stock split such that the value of each share is 1/3rd the value of its original price. The company does so by dividing the value of one stock by three. Therefore, the value of each share will become $10, and the sum of three such stocks will be $30. So the value held by investors remains constant.

    What is Stock Split? | marketfeed

    Example 2:

    • Let us assume that you hold 100 shares of Reliance Industries (RIL). Each share of RIL costs Rs. 1,000. Therefore, you hold shares worth ₹100,000 in total.
    • Let us also assume for convenience that the total number of outstanding shares is 1,000,000 (1 million). So market capitalization will be 1,000,000,000 (1 Billion).
    • One fine day, RIL announces a stock split in the ratio 1:1 (one extra share for every one share held in the company). This means that the total number of outstanding shares will be 2,000,000 (2 Million) but the market capitalization still remains 1 Billion at the moment.
    • When RIL announces the stock split, the number of shares you held would double. But their total value still remained the same i.e. ₹100,000. And the value of each share that you hold will be half i.e. Rs.500 (₹1,000 divided by 2).
    • After this, you can expect a decline in price due to the excess supply of shares in the market. Later, the price will surge due to increased demand, thereby raising liquidity for the company.
    What is Stock Split?

    Advantages and Disadvantages of Stock Splits

    AdvantagesDisadvantages
    Stock splits result in more shares being available in the market, which can increase trading activity and liquidity. It will make it easier for investors to buy and sell shares.A stock split doesn’t change the fundamental value of a company. If the stock was overvalued before the split, it will still be overvalued after the split.
    After a stock split, the share price typically decreases. This can make the stock more affordable to a wider range of investors, potentially attracting new buyers.Buying or selling more shares due to the split may result in increased transaction costs, especially if investors/traders have to pay commissions or fees for each trade.
    A stock split can create a positive perception among investors. It may be seen as a sign of confidence by the company’s management, which can boost investor sentiment.The company needs to pay different costs like legal & exchange fees while splitting its stock. 

    In conclusion, a stock split is only a corporate event that adjusts the number of shares and their prices. However, it doesn’t alter the company’s fundamentals, unlike other corporate actions such as a bonus issue. Stock splits are often welcomed by investors because they make shares more affordable and boost trading activity. Remember, always study and understand a company’s fundamentals before investing!