Categories
Jargons

Which are the Highest Dividend Paying Stocks in India?

A dividend is a payment made by a company to its shareholders out of its earnings or accumulated profits. Listed companies usually pay dividends in cash and are an additional source of income for shareholders. They also issue dividends as additional shares of stock or other forms of property. Dividends serve as a way for companies to reward shareholders for their investments. However, companies are not legally bound to pay dividends. All companies can choose to issue dividends at their own discretion. In this article, we will examine the top dividend-paying stocks in India.

Why Should You Invest in Dividend Paying Stocks?

Passive Income

Dividends can be an excellent source of passive income. Passive income refers to earnings that require minimal effort or ongoing involvement of the investor. Dividend payments fit this definition because once you invest in dividend-paying stocks, you can receive regular income without actively working for it.

Regular Cash Flow

Dividend payments are often made quarterly or annually. This regularity provides a predictable income stream. Additionally, since companies pay dividends in cash, there will be a regular cash flow.

Increased Total Return

Dividend income can contribute to the total return of an investment. Total return refers to an investment’s overall profit or loss over a specific period. It considers both capital appreciation and any other income from the investment, such as dividends. When you reinvest dividends in the company’s shares, it can supercharge the total return through compounding.

Cushioning Market Volatility

Dividend-paying stocks can act as a cushion during market downturns. Even if the stock price temporarily declines, investors still receive dividend payments, which can help offset potential losses. This dividend income can provide stability to your portfolio and reduce the impact of market volatility.

Indicator of Financial Health

Companies that consistently pay dividends often exhibit stability and predictability in their financial performance. These companies are typically well-established, generate steady profits, and have a history of sharing their earnings with shareholders. Dividend payments can reassure investors of the company’s financial health and stability.

Factors to Consider Before Investing in Dividend-paying Companies

Not all companies that pay dividends are good. Before choosing a company to invest in, you should consider different factors. A few of them are listed below:

Dividend History

A company that has paid consistent dividends over the years tends to continue paying dividends in the future. Examine the company’s dividend payment history. Look for companies with a history of paying dividends consistently over a significant period. Consider whether the dividends have been maintained or increased over time. A stable or growing dividend history indicates the company’s commitment to rewarding shareholders.

Dividend Yield Ratio

The dividend yield ratio of a share is the ratio of the annual dividend per share to the share’s market price. It evaluates the dividend amount relative to the stock price. A higher dividend yield may indicate a potentially attractive income-generating opportunity. However, the dividend yield ratio is dynamic, as the value ratio changes with the stock price. It is essential to compare the yield with industry peers and assess its sustainability.

Dividend Payout Ratio

The dividend payout ratio represents the proportion of earnings paid out as dividends. A lower payout ratio indicates that the company retains a sizeable portion of its earnings for reinvestment or future growth, which can be positive for long-term stability. On the other hand, a high payout ratio may indicate that the company is distributing a significant portion of its profits, potentially limiting its ability to invest in growth opportunities or withstand economic downturns.

Payout Ratio = Dividends Per Share/Earnings Per Share × 100

Payout Ratio = Dividends per share/Free Cash Flow Per Share × 100

Company’s Financial Health

Look into the company’s financial health by reviewing its financial statements, including revenue growth, profitability, debt levels, and cash flow. A company with robust financials and a healthy balance sheet holds a solid position to sustain and potentially increase dividend payments.

Growth Prospects

Consider the company’s growth prospects and future earnings potential. While dividends provide income, assessing whether the company can grow its earnings over time is essential. Sustainable dividend payments often align with a company’s ability to generate consistent profits and reinvest in its business for future growth.

Economic and Market Conditions

Evaluate the broader economic and market conditions. Some industries, such as utilities or consumer staples, tend to have more stable cash flows. They are better positioned to maintain dividend payments during economic downturns. Consider the impact of economic factors, interest rates, and market volatility on the company’s ability to sustain its dividend payments.

Valuation

Assess the company’s valuation relative to its peers and its historical valuation. A company with an attractive valuation may provide an opportunity for capital appreciation in addition to dividend income. However, be cautious of excessively high dividend yields that may signal 

underlying risks.

Best Highest Dividend Paying Stocks In India

Given below are a few of the best highest-dividend paying stocks in India:

No.NameSector
1InfosysInformation Technology
2Hindustan UnileverFMCG
3ITCFMCG
4Oil & Natural Gas CorpEnergy
5HDFC BankFinancial

Infosys Ltd

Infosys Ltd is engaged in consulting, technology, outsourcing, and next-generation digital services. The IT company’s core services include application management services, proprietary application development services, independent validation solutions, product engineering & management, infrastructure management services, traditional enterprise application implementation, and support & integration services. Its products and platforms include Finacle, Panaya, Skava, and LEAP.

The company offers services to enterprises in the financial services & insurance, manufacturing, retail, consumer goods, logistics, energy, communication, telecom, and media sectors. Infosys has grown into the 2nd largest information technology company in India behind TCS.
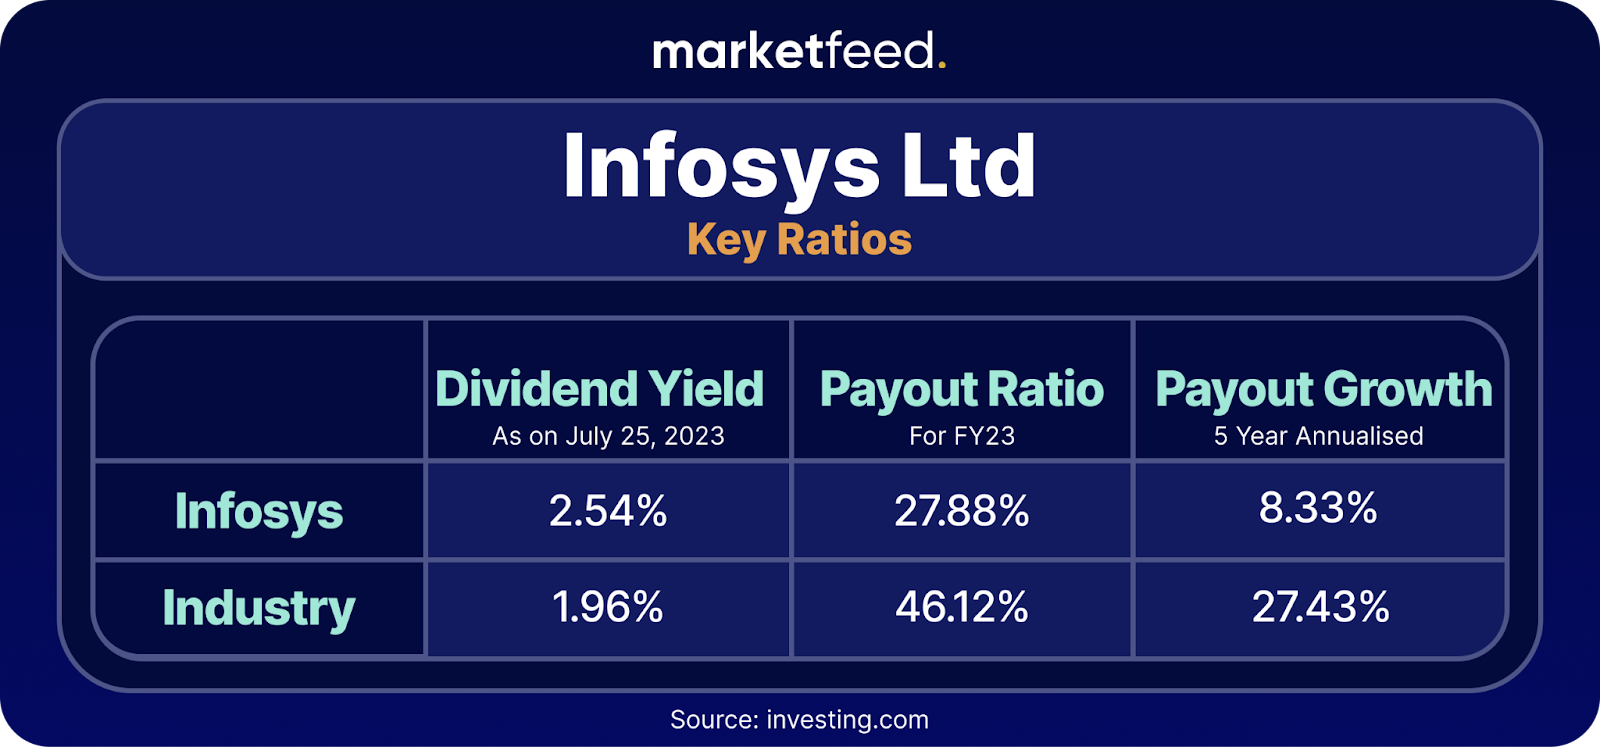
Infosys - Highest Dividend Paying Stock

Hindustan Unilever Ltd

Hindustan Unilever Ltd is a consumer staples company. It manufactures and sells food, home care, personal care, and refreshment products in India and internationally. The company operates through Home Care, Beauty & Personal Care, Foods & Refreshments, and other segments. 

The Home Care segment engages in detergent bars and powders, detergent liquids, scourers, water business, purifiers business, etc. The Beauty & Personal Care segment provides oral, skin, and hair care products; soaps, deodorants, talcum powder, color cosmetics, salon services, etc. The Foods & Refreshment segment sells fruit-based products, soups, tea, coffee, health food drinks, ice-creams, and frozen desserts. 

The company is also involved in job work, real estate, and discharge trust activities. Hindustan Unilever is a subsidiary of Unilever Plc.
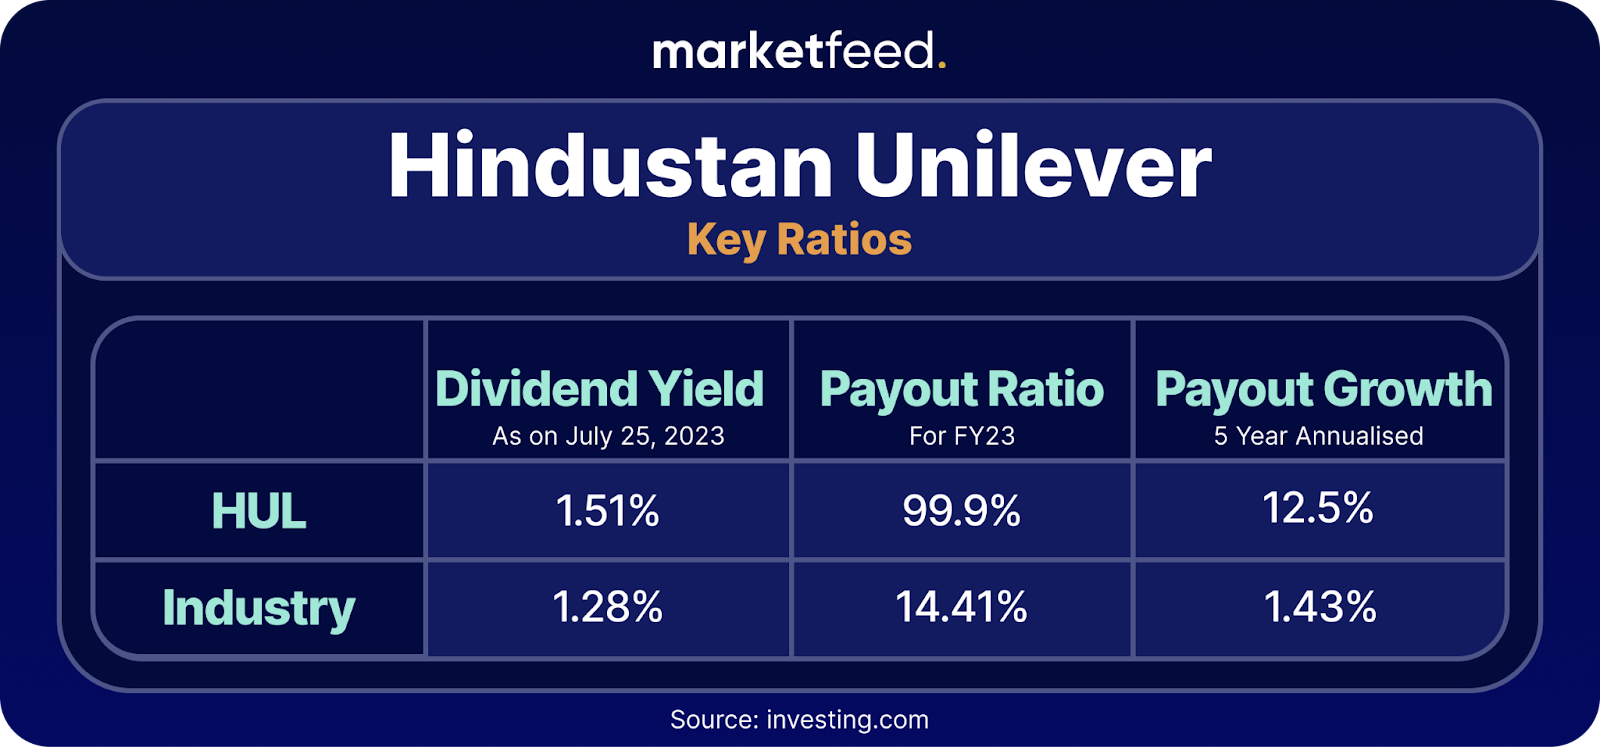
Hindustan Unilever - Dividend paying stock

ITC Ltd

ITC Ltd is a consumer staples company. The company operates through four segments: FMCG (fast-moving consumer goods), Hotels, Paperboards, Paper and Packaging, and Agri-Business. 

Cigarettes, branded packaged foods, education & stationery products, personal care products, safety matches, agarbattis, and apparel forms its FMCG business. The company operates a chain of over 100 hotels across India. Its Agri Business segment includes agri commodities such as soya, spices, coffee, and leaf tobacco. ITC owns and operates brands such as Aashirvaad, Bingo!, Candyman, Fiama, Vivel, Classmate, Superia, Engage, Mangaldeep, Aim, and Homelites.

ITC also offers information technology services and branded residences. 
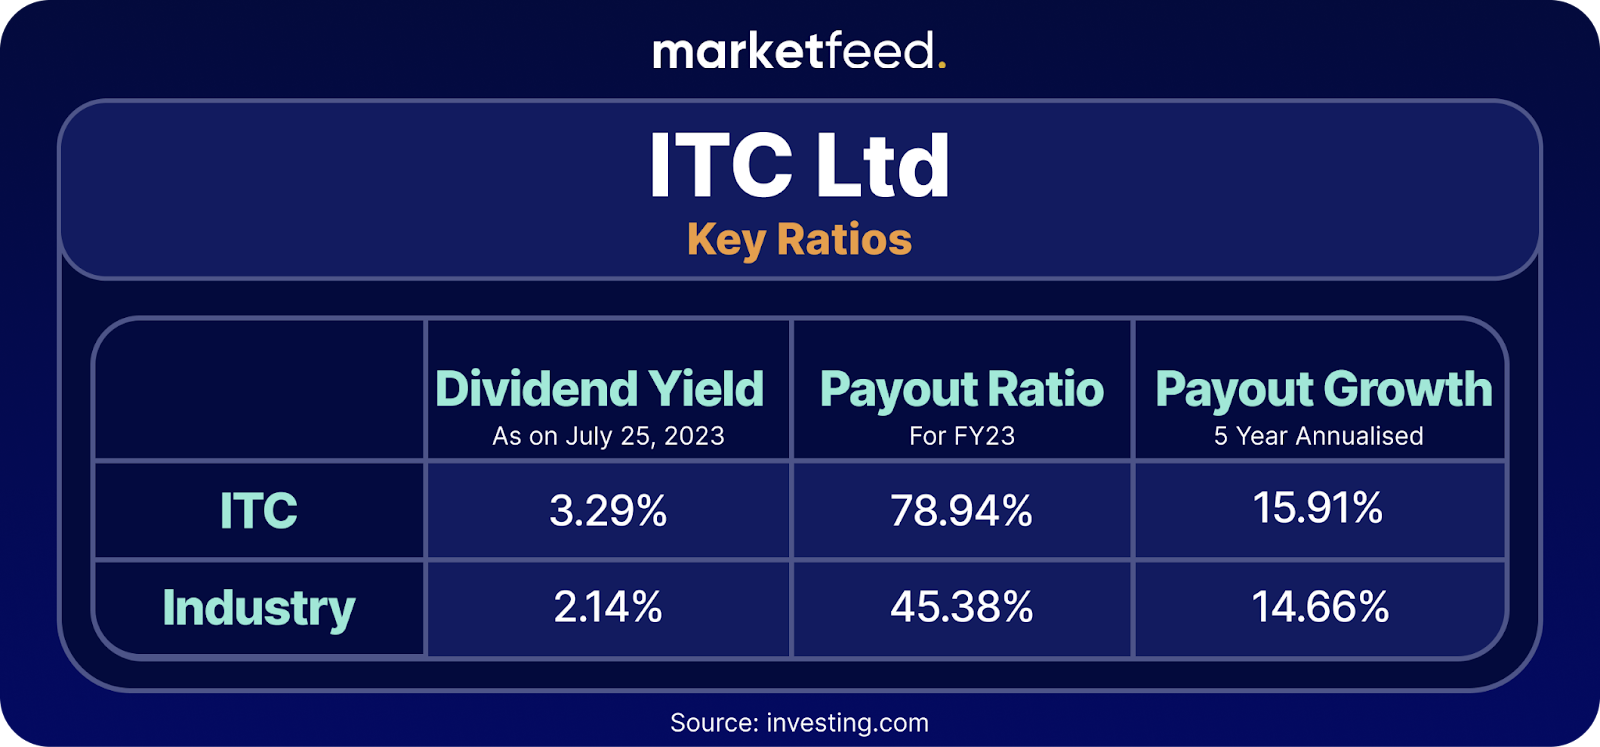
ITC - highest dividend paying stock

Oil & Natural Gas Corporation Ltd

Oil and Natural Gas Corporation (ONGC) Ltd is the largest producer of crude oil and natural gas in India. The primary activities of the company include exploration, development, and production of crude oil, natural gas, and value-added products. ONGC has two business segments— Exploration and Production and Refining and Marketing. 

ONGC contributes nearly 71% to India’s total production of crude oil. The crude extracted by the company is used as raw material by downstream companies such as Indian Oil Corp. (IOCL), BPCL, and HPCL. Moreover, ONGC contributes ~63% to the total gas production in our country.

Mangalore Refinery and Petrochemicals Ltd, ONGC Videsh Ltd, and Petronet MHB Ltd are its subsidiaries.
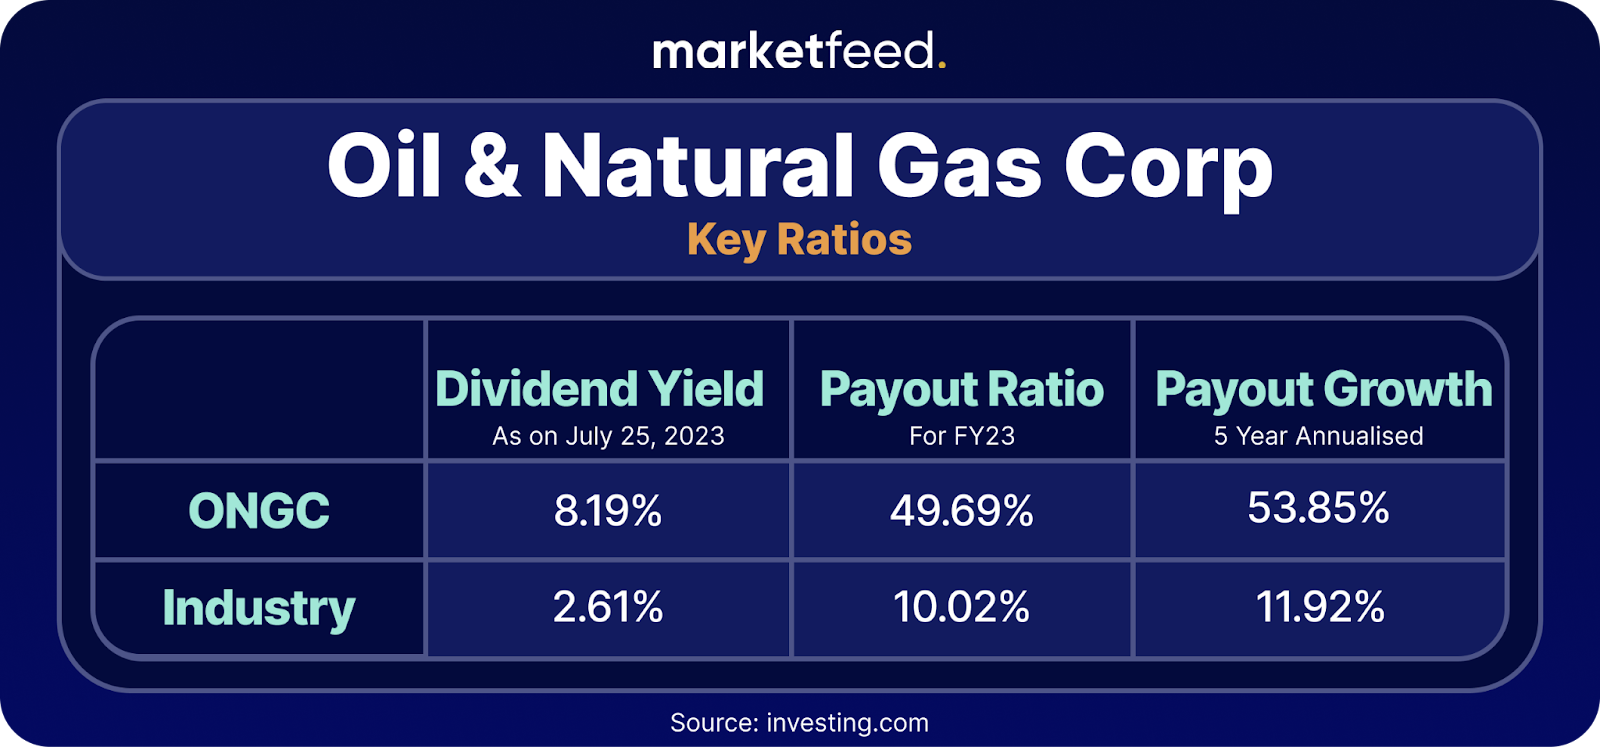
ONGC - Highest Dividend Paying Stock

HDFC Bank

HDFC Bank Ltd is the largest private sector bank in India. It offers a comprehensive range of banking and financial services, including retail banking, wholesale banking, and treasury operations. The company is also the market leader in the credit card business in India. As of 31 March 2023, the bank’s distribution network was at 7,821 branches across 3,203 cities.
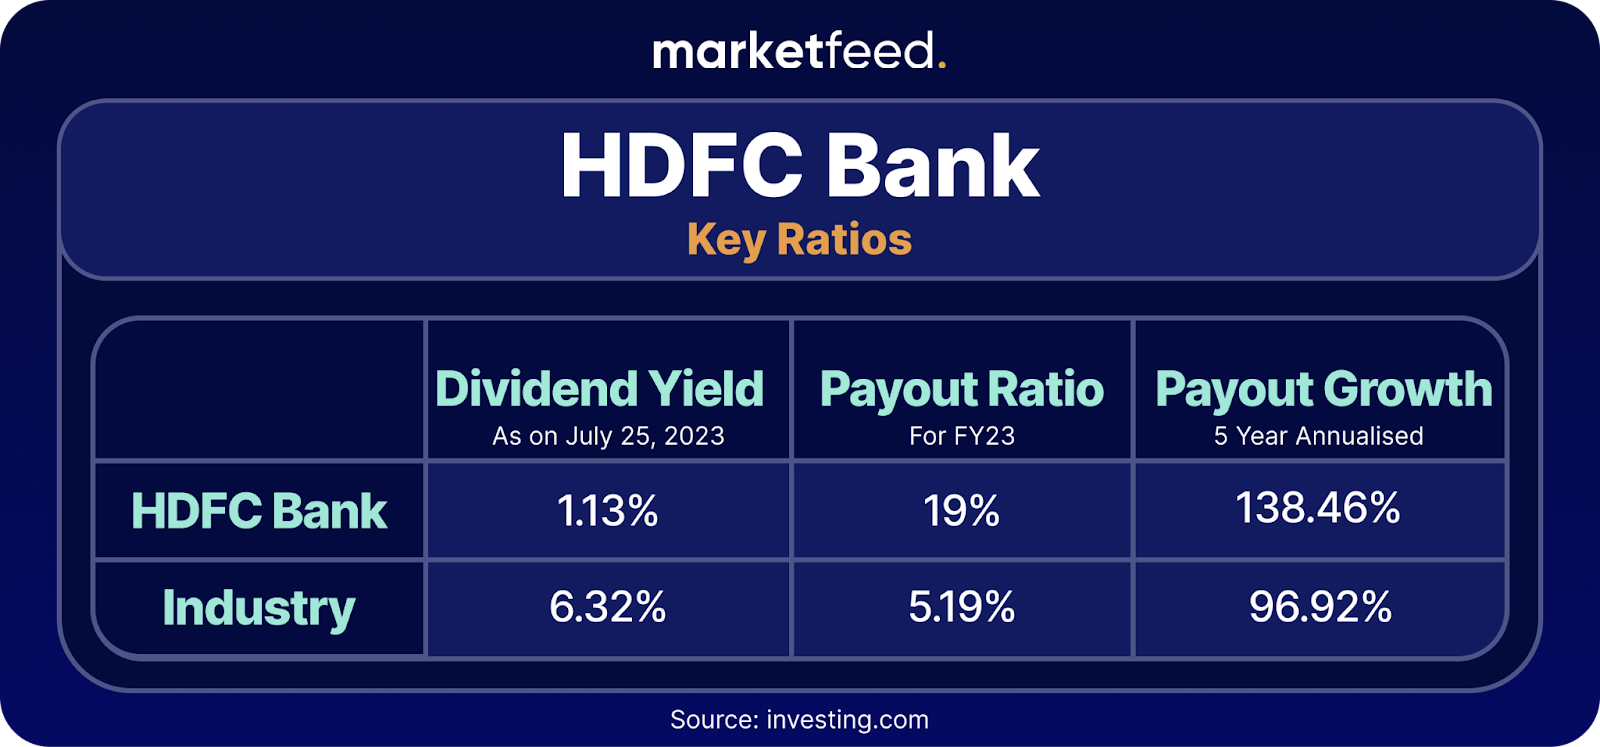
HDFC Bank - Dividend Stocks in India

In conclusion, investing in dividend-paying stocks can create additional income, supercharging long-term wealth creation. While investing, it is crucial to look beyond the absolute dividend values and consider other factors such as payout ratios. This investing style is best suitable for people who need regular cash flow!

Disclaimer: The stocks mentioned in the article are solely for educational purposes. Please do your own research before investing.

Categories
Jargons

Best Stocks to Invest for Long Term

Investing your hard-earned income in stocks can be quite challenging. There are thousands of companies across diverse segments to choose from. However, it’s vital that we invest in those enterprises that have a solid business model, strong financial growth, and follow good corporate governance practices. Historical records have proven that investing in such reputed firms over the long term can help us beat inflation and secure our financial goals. In this article, we analyse some of the best stocks to invest in for the long term in India.

Factors to Consider While Looking for Stocks to Invest for Long Term:

  • Company Fundamentals: Evaluate the financial health of all companies, their profitability, competitive advantage, and growth prospects to ensure they have a solid foundation for long-term success.
  • Industry Analysis: Assess the growth potential of the industry a company operates in, market dynamics, and competitive landscape. Investing in sectors with favourable long-term prospects can increase the chances of sustained stock performance.
  • Management Quality: Examine the experience and track record of the company’s management team. Strong leadership and effective execution are crucial for long-term value creation.
  • Valuation: Consider a stock’s valuation relative to its earnings, cash flows, and industry peers. Buying stocks at reasonable prices or at a discount to their intrinsic value improves the potential for long-term returns.
  • Dividends and Shareholder Returns: Look for companies with a history of consistent dividend payments or share buybacks. These factors indicate a commitment to returning value to shareholders and can contribute to long-term total returns.

Stocks to Invest for the Long Term:

Stock5-Year Return
Reliance Industries Ltd. 122.3%
Tata Power Company Ltd. 202.5%
Tata Consultancy Services Ltd. 74.5%
Asian Paints147%
HDFC Bank52.5%
(Returns as of July 24, 2023)

Note: These are not stock recommendations. Please do your own research before investing.

Reliance Industries Ltd. 

Reliance Industries Ltd (RIL) is the largest private-sector corporation in India. The Mukesh Ambani-led conglomerate is primarily involved in the energy, petrochemicals, retail, textiles, telecom, entertainment, and digital services sectors. RIL owns the world’s largest refining hub in Jamnagar (Gujarat), which has a crude processing capacity of 1.24 million barrels per day. 

The company’s subsidiary, Reliance Retail Ventures, is our country’s largest retailer in terms of revenue and profitability. Meanwhile, Reliance Jio is the biggest player in the telecom sector, with a 37% market share and nearly 43 crore subscribers. RIL is currently focusing on dominating the gradually evolving green energy sector. Thus, Reliance’s products and services portfolio touches almost all Indians every day.

Over the past five years (FY19-FY23), RIL’s revenue and net profit have shown an impressive Compounded Annual Growth Rate (CAGR) of 17.25% and 13%, respectively. [In simple terms, CAGR is a measure of the average year-on-year growth rate of a metric over several years.] They have been able to significantly reduce debt during this period. Reliance has cemented its position as a market leader in almost all sectors it operates in.

Tata Power Company Ltd. 

Tata Power Company Ltd is engaged in the generation, transmission, and distribution of electricity across India. It has a total generation capacity of 14,110 megawatts (MW) from thermal, hydro, and renewable power (solar, wind) projects. Since its inception in 1915, Tata Power has developed expertise in executing critical projects and driving green initiatives. The company holds a dominant position in the growing electric vehicle (EV) charging station market in our country.

Going forward, the integrated power company plans to expand its clean & green energy capacity to 80% by 2030. It aims to become carbon neutral by phasing out thermal projects by 2050. Additionally, it plans to construct 1 lakh EV charging stations by 2025. 

Tata Power currently holds a ~41.83% market share in India’s power transmission & distribution sector. Its revenue has grown at a CAGR of 14.76% over the past five years, while net profit has grown at 6.74%. The company has also been maintaining a healthy dividend payout of 31.7%. Based on its recent order wins and top-class project execution capabilities, Tata Power is expected to post good results in the upcoming quarters.

Tata Consultancy Services Ltd. 

Tata Consultancy Services (TCS) is the flagship company of the Tata Group. It is a management and technology consultant, which means that they provide services to other enterprises and government agencies and help them transform the way technology is used. The company’s services include application development, business processing outsourcing (BPO), payment processing, and much more. TCS essentially helps organizations simplify their digital systems and reduce costs.

TCS is almost debt-free. Over the last 5 years, its revenue has grown at a yearly rate of 12.5%. The company’s Return on Capital Employed (ROCE) is the highest amongst its competitors in the IT sector at 59.1%. [It means that for every ₹100 worth of capital employed, TCS earns ₹59.1 on it.] The company has been maintaining a healthy dividend payout of 61.4%. As the flagship company of Tata Group, Tata Consultancy Services has time and again exceeded its targets and is continuing its path as a global leader in the IT industry.

HDFC Bank

Housing Development Finance Corporation (HDFC) was one of the pioneering institutions to receive preliminary approval from the Reserve Bank of India (RBI) to establish a private sector bank. In August 1994, HDFC Bank was incorporated with its headquarters in Mumbai, India. It offers a comprehensive range of banking and financial services, including retail banking, wholesale banking, and treasury operations. Today, it stands as the largest private-sector bank in India. It is a market leader in the credit card business in India. As of 31 March 2023, the bank’s distribution network was at 7,821 branches across 3,203 cities.

The bank’s revenue has grown at a CAGR of 15.09% over the past five years, while net profit has grown at 19.97%. It has been maintaining a healthy dividend payout of 19%. 

HDFC Bank aims to launch more products and services under its ‘Digital 2.0’ drive in the upcoming years.

Hindustan Unilever Ltd. 

Hindustan Unilever Ltd is a consumer goods company headquartered in Mumbai. It is a subsidiary of the UK-based Unilever plc. Foods, drinks, cleaning supplies, toiletries, water purifiers, and other fast-moving goods are among its offerings. The company’s Beauty & Personal Care segment forms a majority of its revenue (42%). This is followed by the Home Care segment (29%) and Food and Refreshment Segment (29%). 

HUL’s revenue has grown at a yearly rate of 11.2% over the past five years, while its net profit has grown at 14.18%. The company is almost debt free. It has also been maintaining a healthy dividend payout of 99.9%.

Now you know some of the best stocks to invest for long term. In conclusion, invest in well-established companies for the long term, and you will understand the magic of the eighth wonder of the world— compounding! You will be safe from short-term market volatility and risks. Develop patience and let your money grow multifold.

Disclaimer: The stocks mentioned in the article are solely for educational purposes. Please do your own research before investing.
Categories
Jargons

Which are the Best Defence Stocks in India?

The Indian defence and aerospace sector is about to undergo a transformation that would allow it to firmly establish a position among other global industries. Our government is now favouring domestic defence equipment development over imports. Indian companies have been encouraged and assisted in designing, developing, and producing a wide range of military systems and platforms. This is thanks to the policy framework that our government has put in place over the past ten years. In this article, we provide insight into the defence sector of India and the best defence stocks to watch out for. 

An Overview of India’s Defence Sector

  • India is on its way to becoming self-sufficient in the large-scale production of military aircraft, vehicles, missile systems, arms and ammunition, etc.
  • The Defence Ministry’s budgetary allotment was increased by 13% to ₹5.94 lakh crore in Budget 2023–24.  This shows a very large potential for growth in the defence sector.
  • Our government is all set to spend nearly ₹6 lakh crore on defence equipment in Financial Year 2024. And 99% of this equipment will be sourced from Indian industries. Much to the US and Russia’s dismay, India’s defence imports are shrinking due to the emergence of the Indian defence industry. 
  • India is also close to procuring weapons for the Indian Armed Forces worth ₹70,500 crore ($8.7bn), which will all be Made in India. India’s defence imports declined by 11% between 2013-17 and 2018-22, and this decline was linked to a complex procurement process.
  • India bagged an export order worth $155 million for 155-mm artillery guns and another deal for supplying Teevra 40-mm guns to the Indonesian Navy. Armenia signed a $250 million contract for India’s Pinaka missiles.
  • The govt continues to promote joint ventures between Indian and international businesses to carry out co-development, share innovations, and manufacture goods for both domestic use and export.

India is very close to becoming a defence manufacturing hub as it supplies equipment and ammunition to the world. 

Top Defence Stocks in India to Watch Out For:

Sl. NoDefence Companies5-Year Stock Return
1Hindustan Aeronautics Ltd.385%
2Bharat Electronics Ltd270%
3Bharat Dynamics Ltd242%
4Mazagon Dock Shipbuilders Ltd.982%.  
5.Cochin Shipyard Ltd.56% 
(Returns as of July 20, 2023)

1. Hindustan Aeronautics Ltd.

Established in 1940, Hindustan Aeronautics Limited (HAL) is engaged in the design, development, manufacture, repair, and servicing of aircraft, helicopters, aero engines, and aerospace structures in India.  It falls under the administrative control of the Ministry of Defence. HAL has designed and manufactured some of the most advanced Light Combat Aircraft (such as “Tejas”) and helicopters for the Indian Armed Forces. The company gets exclusive contracts from the space, defence, and civil industries around the world.

HAL has delivered good profit growth of 23.9% CAGR over the last 5 years and maintained a healthy dividend payout of 26.8%. This defence stock has given a healthy return of 385%  in 5 years.

2. Bharat Electronics Ltd.

Bharat Electronics Ltd. (BEL) meets the specialised electronic equipment requirements of the Indian Armed Forces. The company designs, manufactures, supplies, and exports electronic equipment and systems for the defence and civilian markets.  BEL’s defence products include communication systems, land-based radars, naval systems, electronic warfare systems, tank & armoured fighting vehicle electronic systems, and much more. The company has partnered with DRDO laboratories to design and produce customised defence systems.  

BEL has been maintaining a healthy dividend payout of 40.5% The company is also nearly debt free. The stock has given a return of 270% in 5 years. However, it has seen a very slow growth in its sales, ranging only about 11% in the past five years. 

The Defence Ministry has also inked two contracts worth over Rs 3,700 crore with the public sector undertaking (PSU) for radars and receivers that will enhance the operational capabilities of the Indian Air Force. 

3. Bharat Dynamics Ltd.

Bharat Dynamics (BDL) is a Government of India Enterprise. It is engaged in the manufacturing of guided missiles and allied defence equipment. The company’s product portfolio includes surface-to-air missiles, anti-tank guided missiles, underwater weapons, launchers, countermeasures, and mechanised infantry weapons. 

The business is expected to deliver a strong quarter and is almost debt-free. The corporation has continued to pay out a solid 41.7% in dividends. However, it has delivered a poor sales growth of -11.5% over the past five years and a low return on equity of 13.1% over the last 3 years. The stock return has been 242% over the past 5 years.

The state-owned aerospace and defence company said it entered into 10 deals with several foreign and Indian companies during Aero India, 2023.

4. Mazagon Dock Shipbuilders Ltd. 

Mazagon Dock Shipbuilders Ltd is primarily engaged in building & repairing ships, submarines, and various types of vessels and related engineering products for various domestic and international clients. It began operations in 1934 as a private corporation and was taken over by the Indian government in 1960.

The company is expected to give a good quarter and has delivered good profit growth of 19.5% CAGR over the last 5 years. This defence stock has given a 5-year return of 982%.  Shipbuilding accounted for around 89% of the company’s sales as of 2020, followed by the sale of base and depot supplies (8%) and ship maintenance (3%).

5. Cochin Shipyard Ltd.

Cochin Shipyard Ltd (CSL) manufactures and repairs boats for the Indian Navy, Coast Guard, and private entities. In 2013, this shipyard launched INS Vikrant, the nation’s first indigenous aircraft carrier.

The company has been maintaining a healthy dividend payout of 27.6%.  It has delivered a poor sales growth of -0.21% over the past five years. CSL’s stock has gained 56% over the past 5 years. 

CSL has signed a contract for building six Next Generation Missile Vessels (NGMV) for the Indian Navy for Rs 9,805 crore with the delivery of ships set to begin in 2027.

More Defence Stocks in India:

Other prominent defence stocks in India include:

  1. Ashok Leyland – It is one of the top suppliers of trucks or armoured vehicles for the Indian army.
  2. Larsen & Toubro – Over the years, L&T has designed, developed, and manufactured arms, military equipment, and even submarines.
  3. Astra Microwave Products – The company supplies microwave-based high-value radio frequency super components.
  4. Bharat Forge –  As per reports, the company may start supplying artillery guns to the Indian army.
  5. Apollo Microsystems – The company provides custom-built electronics and electro-mechanical solutions to the defence sector.
  6. Reliance Naval & Engineering – The company has entered into a warship repair agreement with the Ministry of Defence.

In conclusion, the Indian defence sector offers potential investors a favourable environment. By examining the top defence stocks, we have explored companies with strong financial performance, market reputation, and growth potential. The sector is on the rise, fueled by more expenditure on defence and favourable government policies, and this presents appealing investment prospects. With careful consideration, investing in the best defence stocks in India can be a strategic move with significant potential for long-term gains.

Disclaimer: The defence stocks mentioned in the article are solely for educational purposes. Please do your own research before investing.

Categories
Jargons

What are Price Charts? Candlestick Charts & Patterns Explained!

One of the primary tools used in technical analysis is price charts. A chart is a graphical representation of data. In this article, we take a deeper look at what price charts and candlestick patterns are.

What is a Price Chart?

A price chart is a graphical representation of the price and volume data of a stock/security. It helps us visualise the price movement to understand it better. Before price charts, participants had to watch the screen for hours and try to remember the important price levels at different points in time which was practically impossible. This led to the use of price charts.

What are Line Charts?

Line charts are the oldest form of price charts. It is a simple graphic display of price trends over time. Line charts are typically drawn with closing prices as the data points. The closing price refers to the price at which the last trade of the trading session occurred. Many consider it one of the most important data points as it signifies the financial decision for the trading session or period. The closing prices can be of any time frame such as hourly, daily, weekly, monthly, or yearly. 

The vertical axis or Y-axis represents the price level and the horizontal axis or X-axis represents time.

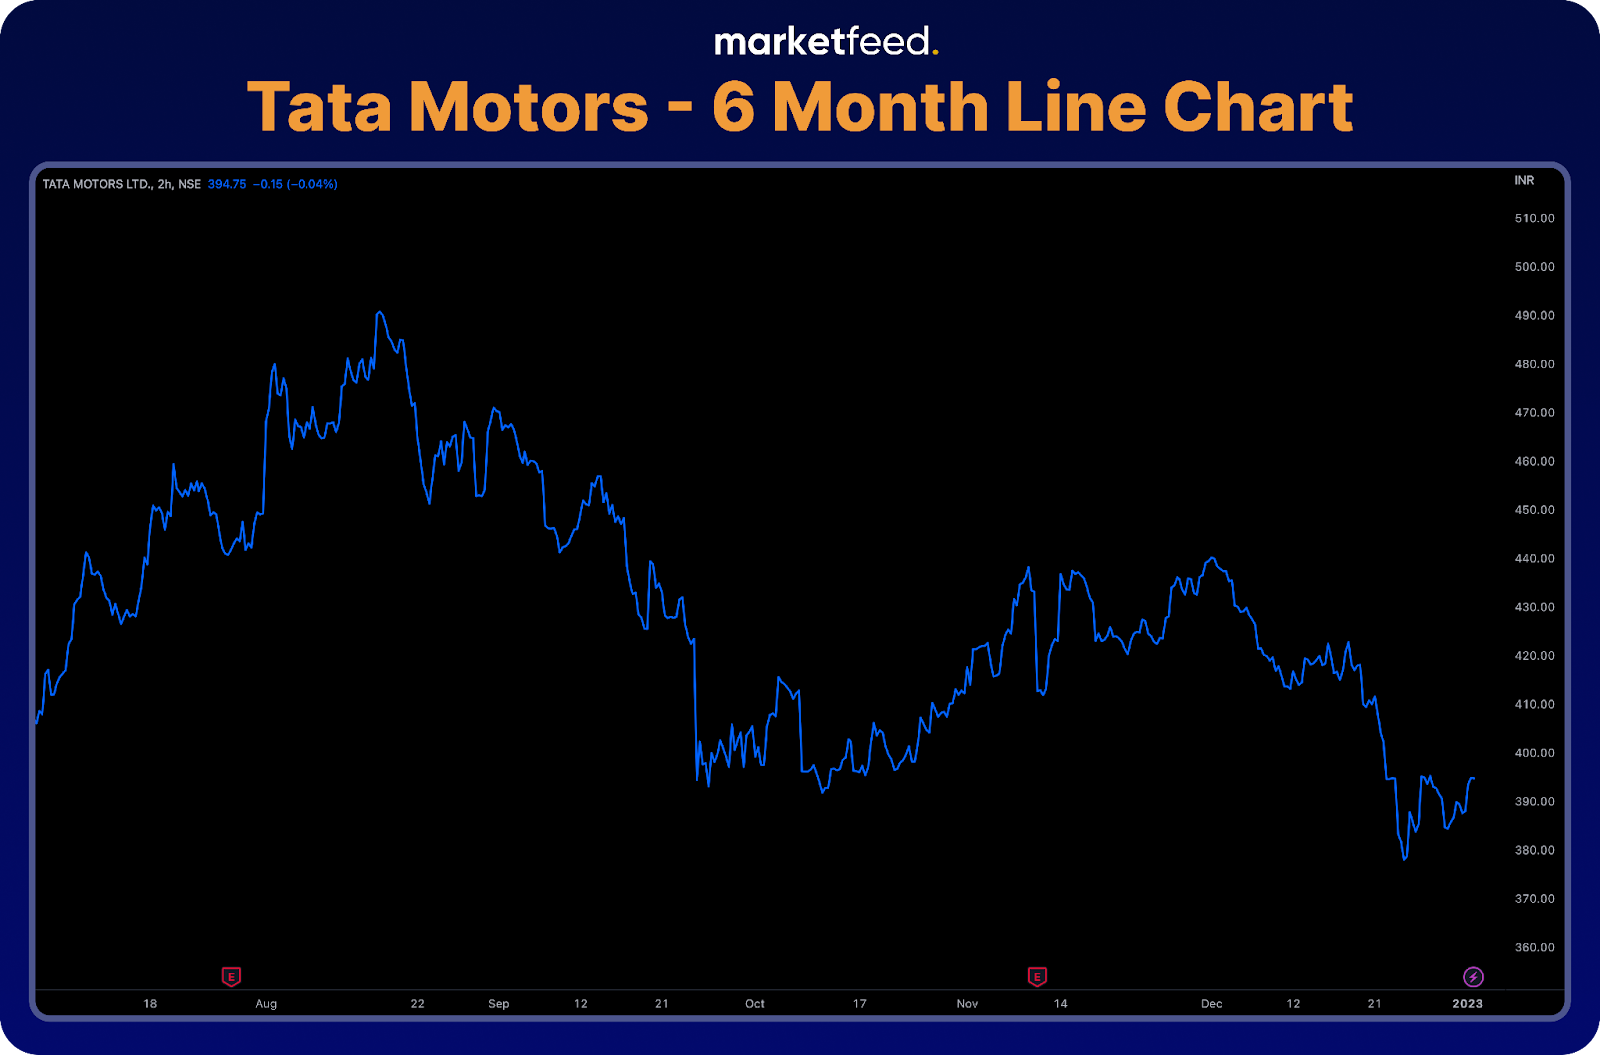
Tata Motors Line Price Char

The line chart above shows the previous 6-month price data of Tata Motors. Each data point represents the closing price of 2-hour timeframes. If we observe, the price of Tata motors fell from 490 in mid-august. This chart shows the trend of prices in the last 6 months.

Even though a line chart portrays the data in a simple way, it only considers a single data point, the closing price. The Japanese invented an alternative to the line chart known as the Candlestick Chart, which utilises four different data points.

What are Candlestick Charts?

The Japanese invented candlestick charts, and they have been utilising technical analysis for centuries. A candlestick chart is a type of price chart that provides four prices per data point, the opening and closing prices and the high and low prices during a period. These prices can be called OHLC data in short which stands for Open, High, Low, and Close, respectively.

In addition to the four prices, the candlesticks also portray the emotions of the investors and traders, which we will learn how to interpret later in this chapter. The greatest advantage to using candles on your charts is that single candle lines and multiple candle patterns offer more reliable, earlier, and more effective reversal signals.

Candlestick Chart

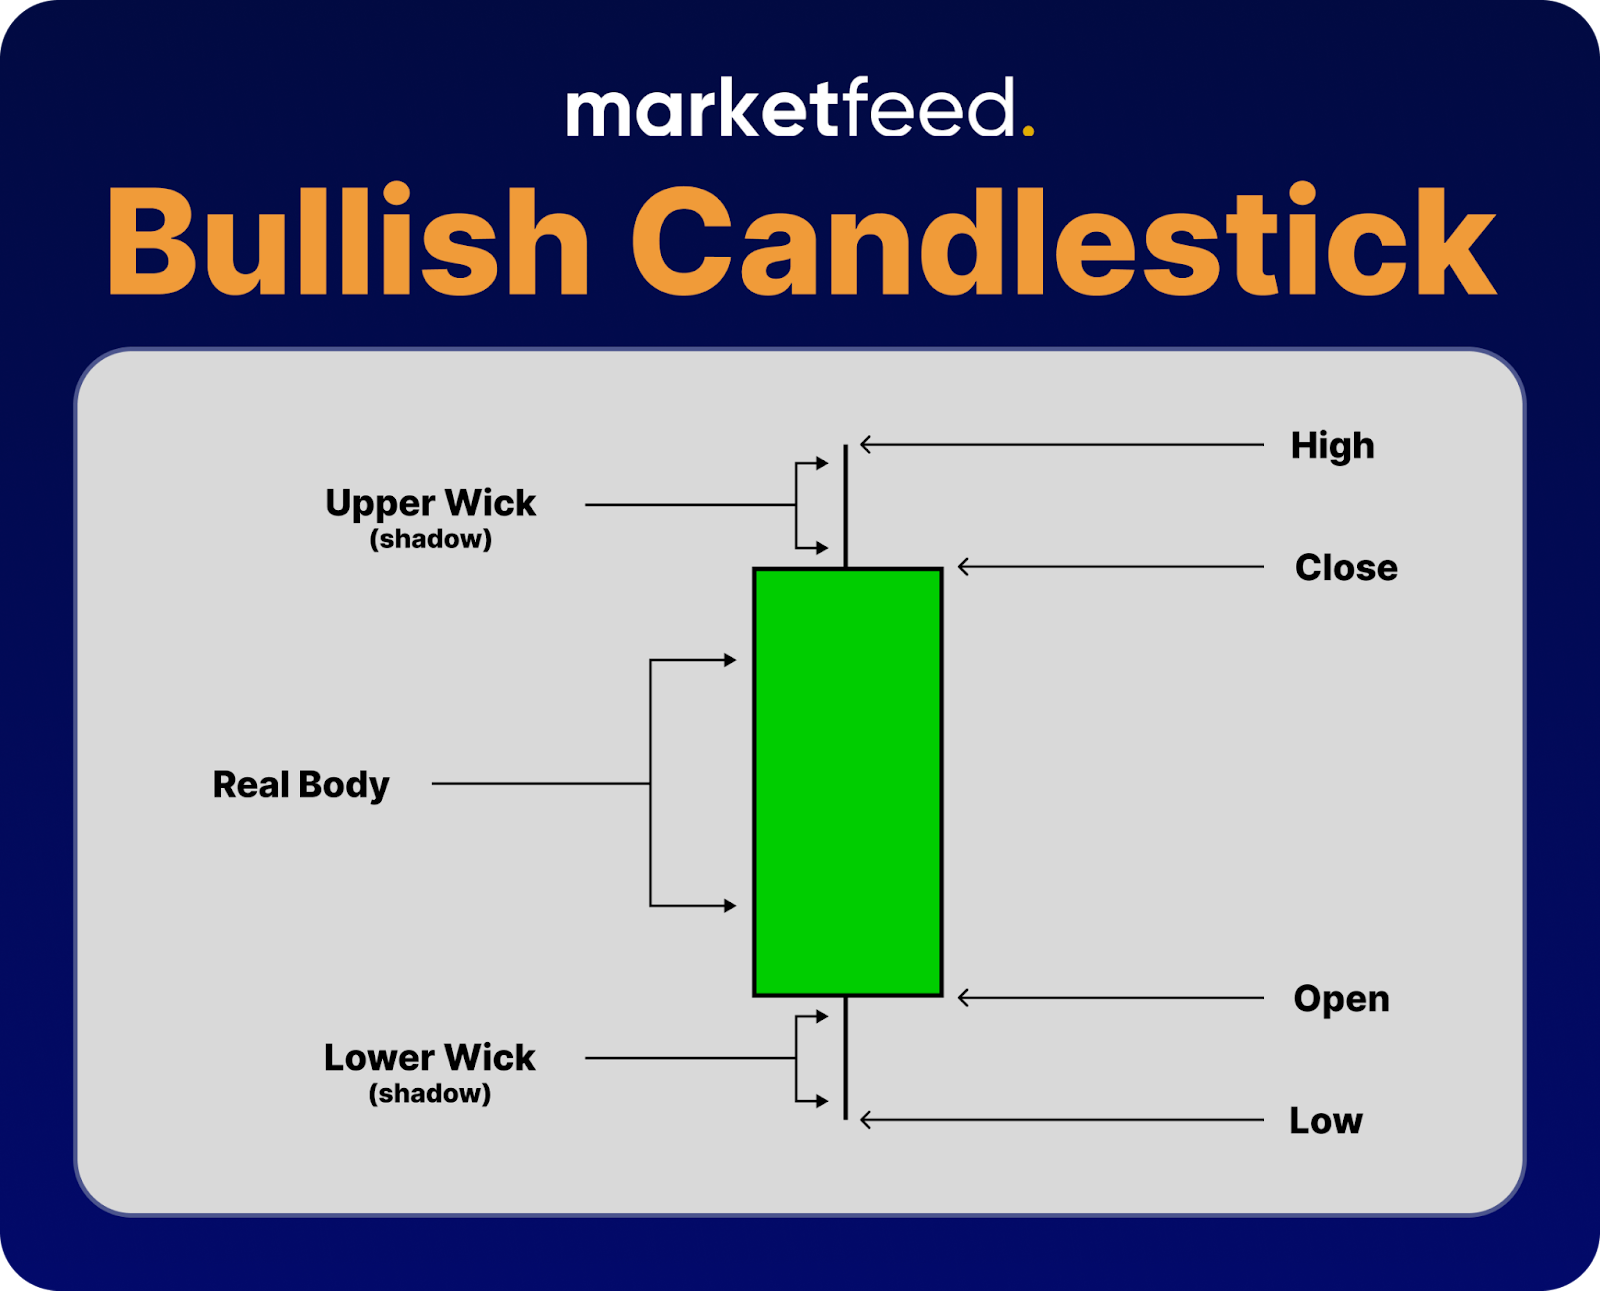
Candlesticks form candlestick charts. A candle shows the price movement of a security during a fixed period through the OHLC data. Bullish (green) candles and Bearish (red) candles are the two types of candles. 

Structure of Candle Sticks

Candlestick Structure | marketfeed

A Candlestick Shows Four Prices:

  • Open – The price at which the asset started trading at in the timeframe.
  • High – The highest price at which the asset was traded.
  • Low – The lowest price at which the asset was traded.
  • Close – The price at which the asset was traded at the end of the time frame. The LTP of the timeframe will be the closing price.

The Three Parts of a Candlestick Are:

  • The central real body – It is a rectangular shape that connects the opening and closing prices.
  • Upper shadow – Indicates the high
  • Lower shadow – Indicates the low

A candlestick is in the form of a rectangle with wicks at both ends. The rectangle is called the central real body and connects the opening and closing price. The upper shadow (wick) indicates the high, and the lower shadow (wick) indicates the low. Both the wicks are connected to either side of the central real body. 

A candle only reaches its final form once the timeframe ends. A 5-minute candle starts forming at the beginning of the 5 minutes, and the close of the candle keeps changing depending on the price fluctuations. The price at which the last transaction in the 5 minutes took place will be the closing price. The two types of candles are based on the opening and closing price of the candle.

What are Bullish Candles?

Bullish Candlestick | marketfeed

If the closing price is higher than the opening price, it is known as a Bullish or green candle. The closing price will only be higher than the opening price only if buying takes place. Therefore, a green or bullish candle symbolizes buying, which means there will be an increase in the price of the security.

What are Bearish Candles?

Bearish Candlestick | marketfeed

If the closing price is lower than the opening price, it is known as a Bearish or red candle. The closing price will only be lower than the opening price only if selling takes place. Therefore, a red or bearish candle symbolizes selling, which means there will be a decrease in the price of the security.

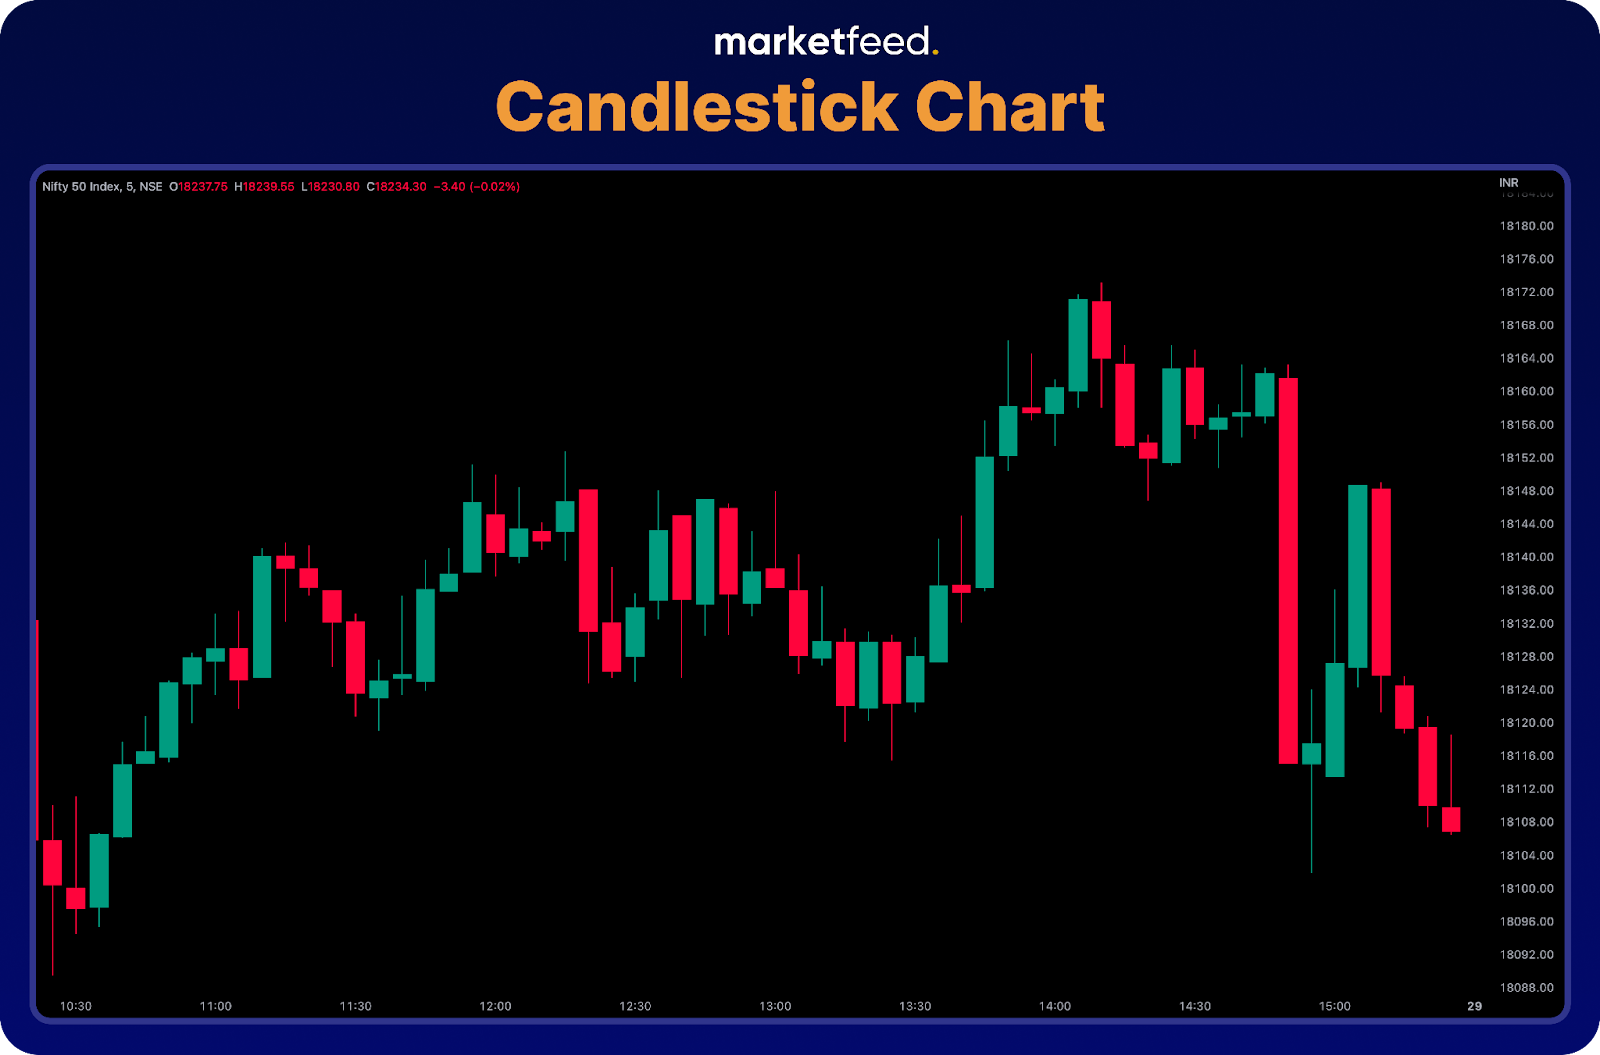
Let us look at some bullish and bearish candles in action:

Tradingview Price Chart | marketfeed

Timeframe refers to the duration of each candle. You can change it from the menu on top of the window. The chart will display the OHLC data of the highlighted candle at the top. Here, the highlighted candle is the first 5-minute candle of 25th October 2022. You can move the cursor to select and highlight a candle, allowing you to view its OHLC data. The time and date are shown at the bottom of the chart. 

If you look at the opening candle, you can see that the candle has no upper wick. This means that the opening price of the candle is the same as the high that the price made in that time frame and hence no upper wick. It says that the price fell as soon as the candle opened. 

As an exercise, you can load up a chart on TradingView or in your broker’s terminal and try to understand the candlesticks by checking its OHLC data. Also, try changing the timeframes to see how the price action was in a selected timeframe.

Types of Single Candlestick Patterns

As you may have noticed, each candle is unique but of similar types. Some have a bigger body, some have longer wicks, and some with shorter wicks as well. Based on the structure of the body and the wick, candlesticks can be of the following types:

1. Marubozu

Marubozu | marketfeed

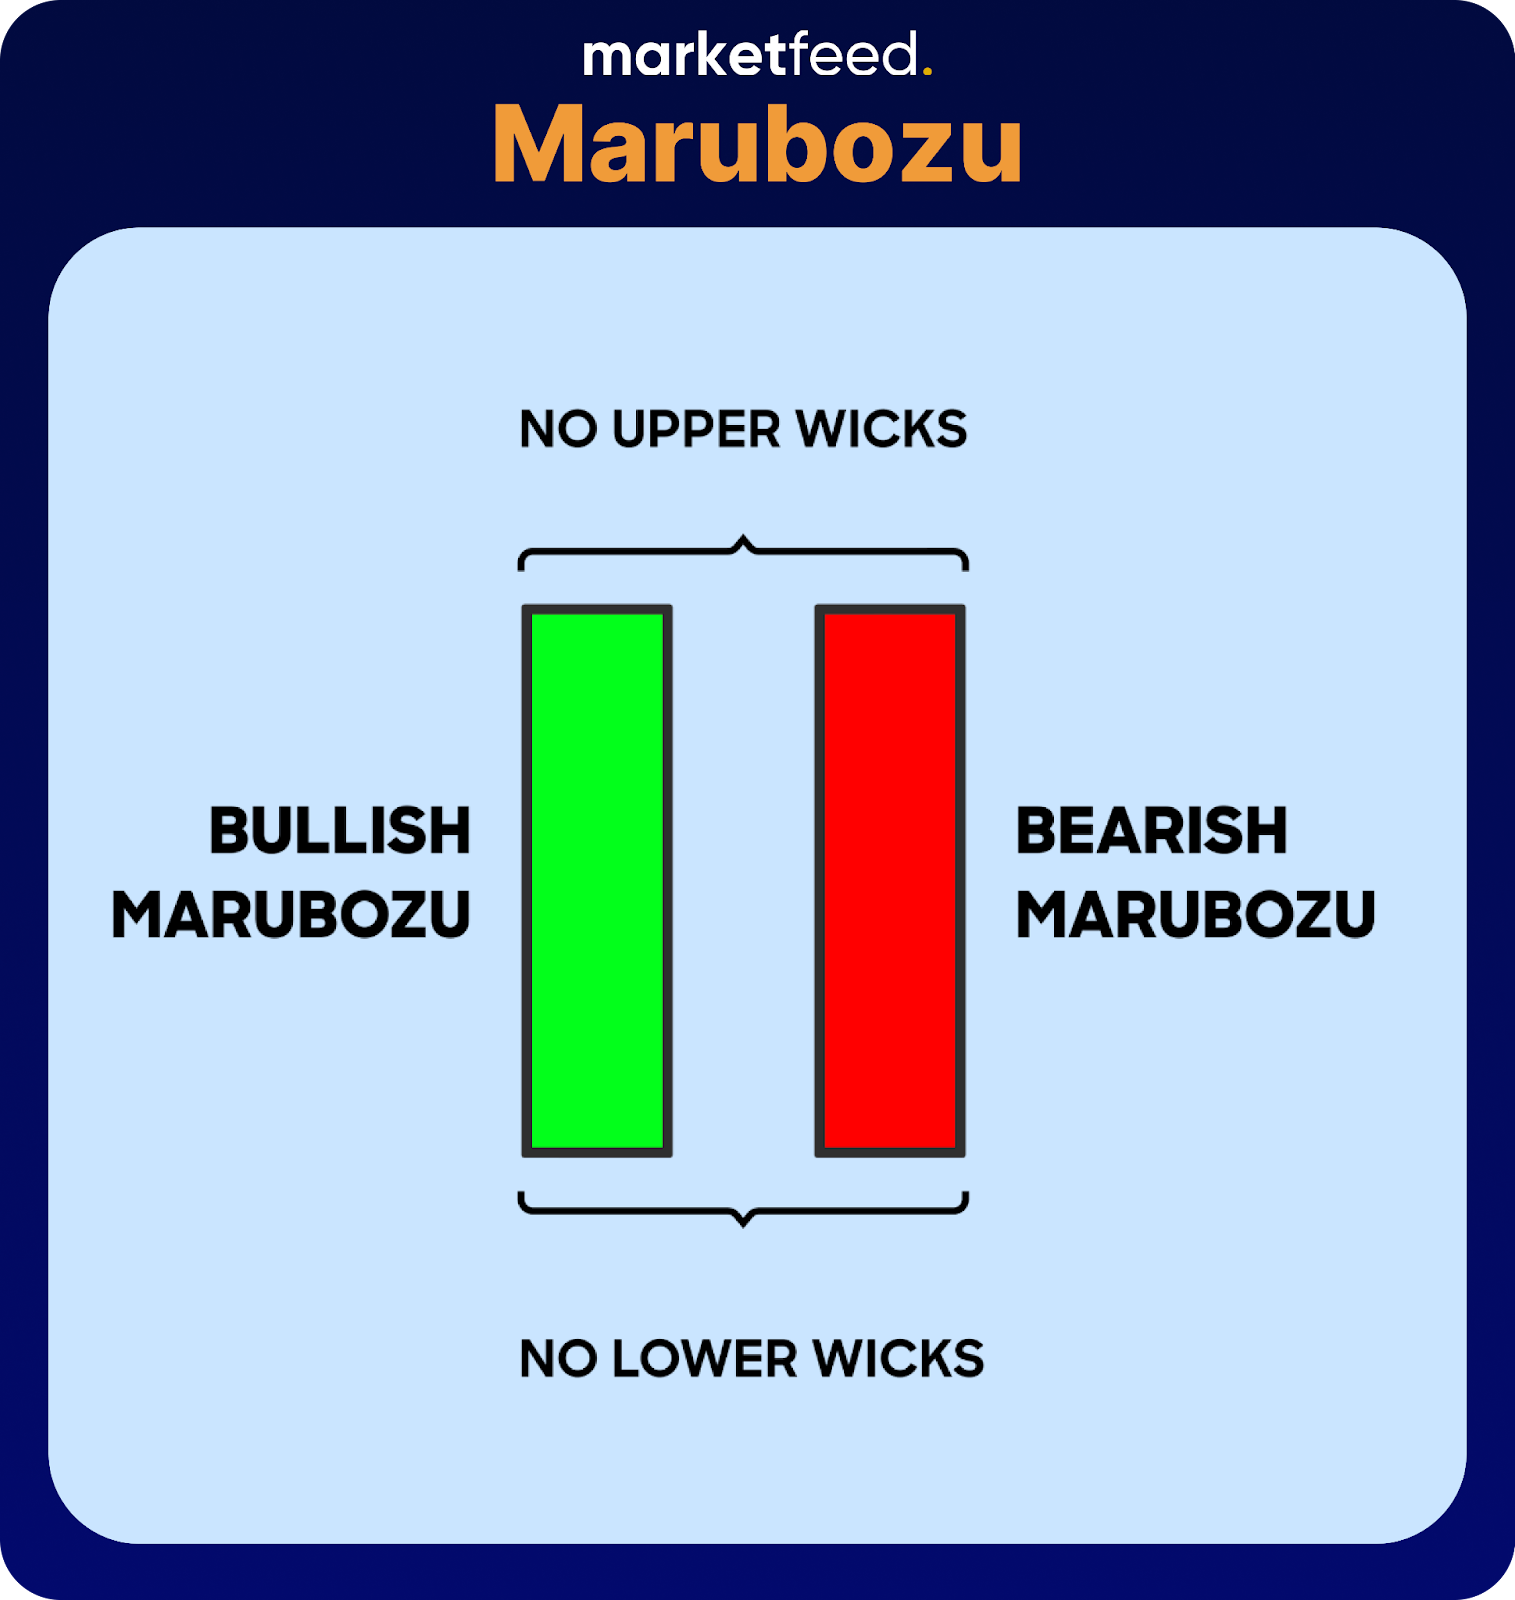
A marubozu is a candlestick with no upper or lower wicks. This type of candle indicates a strong trend. 

  • Bullish Marubozu – It is a clean buying candle, which started moving up from the opening level and closed at the highest point. Open = Low and Close = High
  • Bearish Marubozu –  It is a clean-selling candle, which started moving up from the opening level and closed at the highest point. Open = High and Close = Low
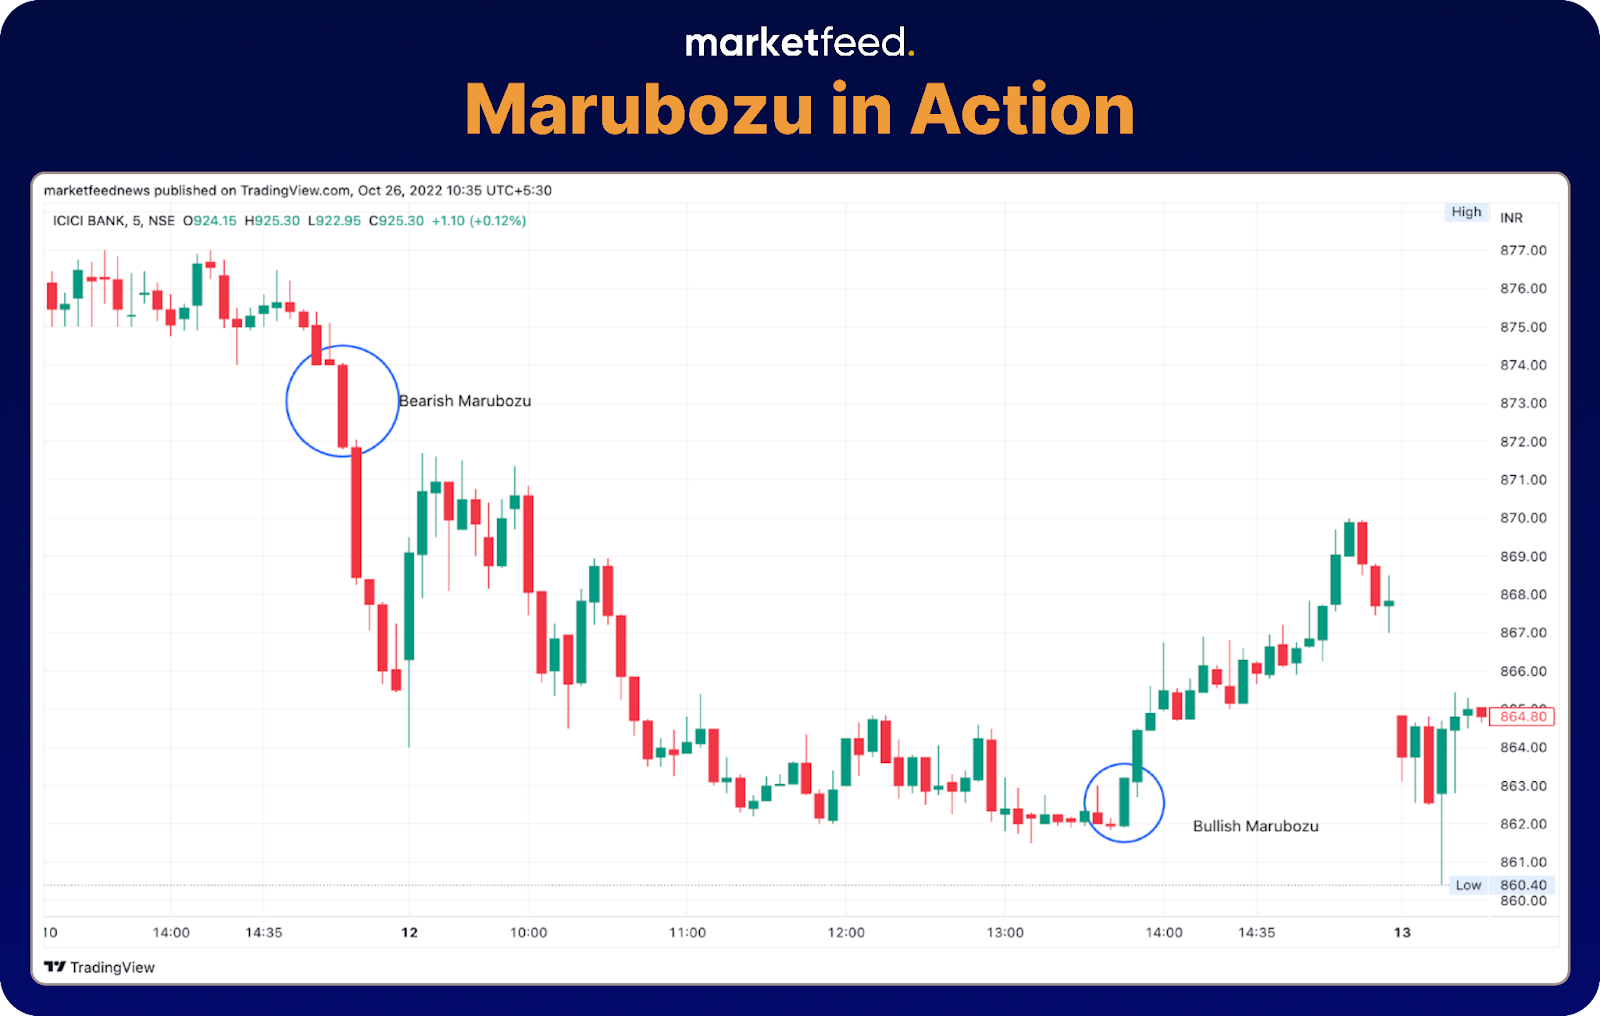
Marubozu Chart | marketfeed

The candles marked in the above chart has very short wicks, which can be ignored. 

2. Spinning Tops

Spinning Tops | marketfeed

As the name indicates, this type of candle looks like a spinning top and indicates indecision, consolidation, or even trend reversal. These candles have a small real body and almost equal upper and lower wicks. The colour of the body does not matter as it is small. 

  • A spinning top in a downtrend signals that sellers are getting tired and there is a chance for reversal or consolidation and there could be buying front the bottom. 
  • A spinning top in an uptrend signals that the buyers are getting tired and there is a chance for reversal or consolidation and there could be selling from the top.
Spinning Tops Chart | marketfeed

3. Doji Candles

Doji | marketfeed

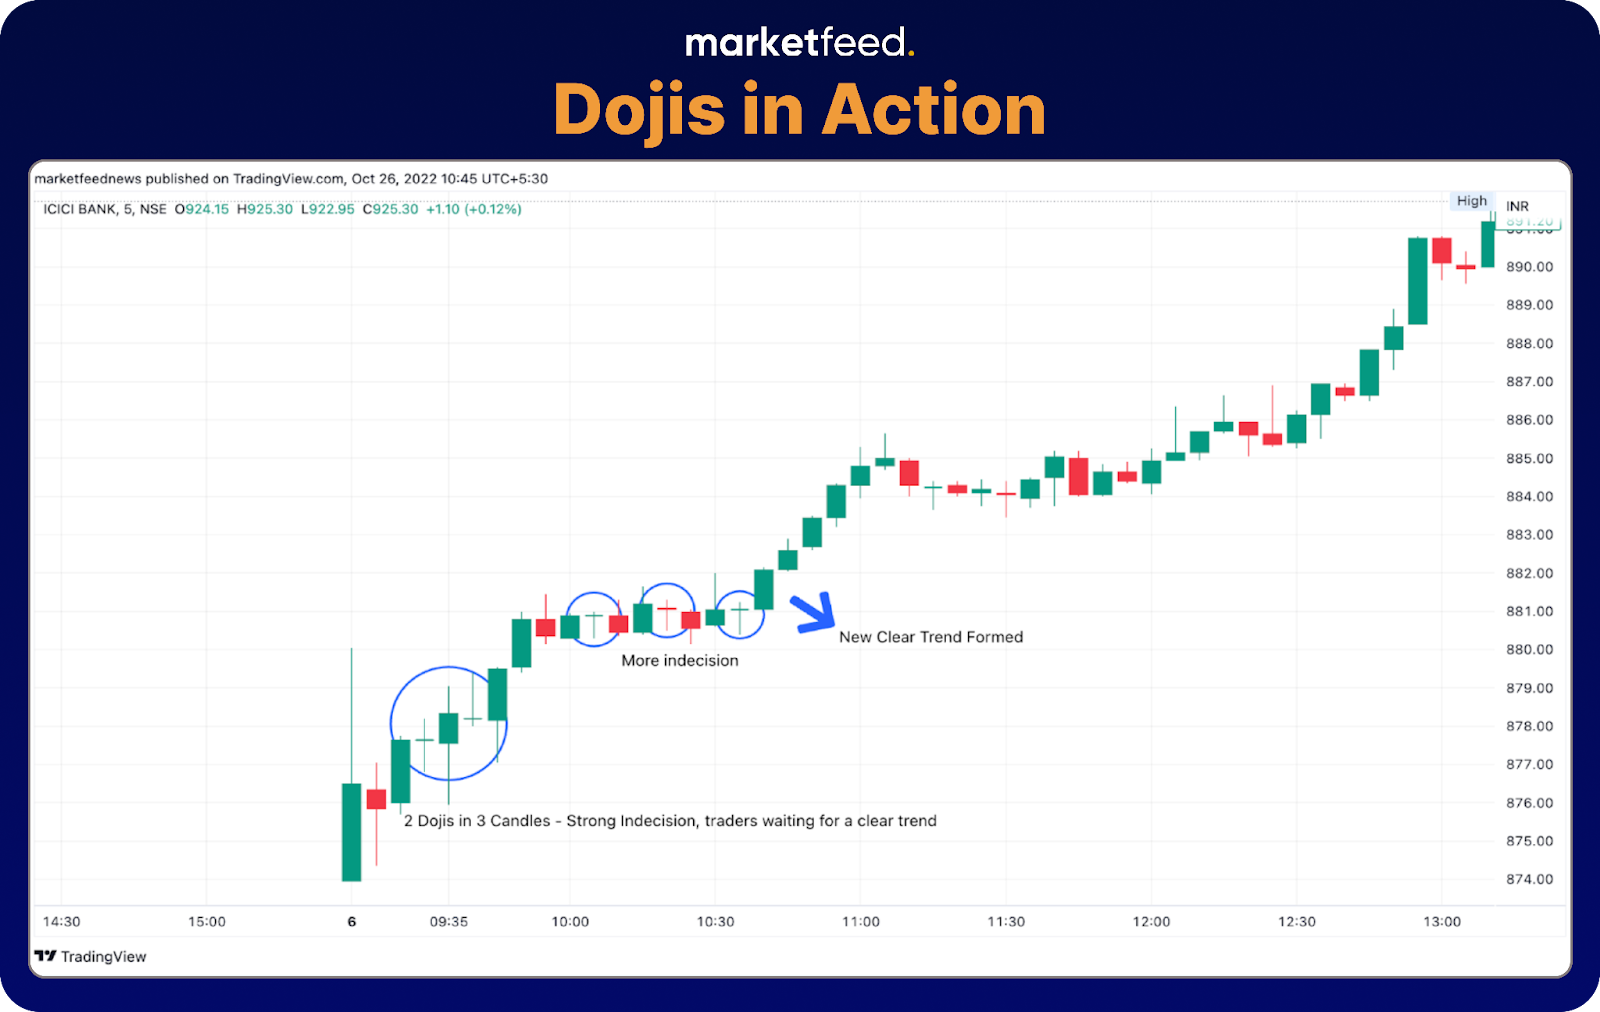
It is very similar to a spinning top, except that it has no real body. Open = Close. The upper and lower wicks might be of different lengths. It indicates extreme indecision and possible trend reversal. The types of doji candles are:

  • Doji Star – It has small wicks.
  • Long-legged Doji – It has longer wicks.
  • Dragonfly Doji – It only has a lower wick and no real body.
  • Gravestone Doji – It only has an upper wick and no real body.
Doji Candle in Chart | marketfeed

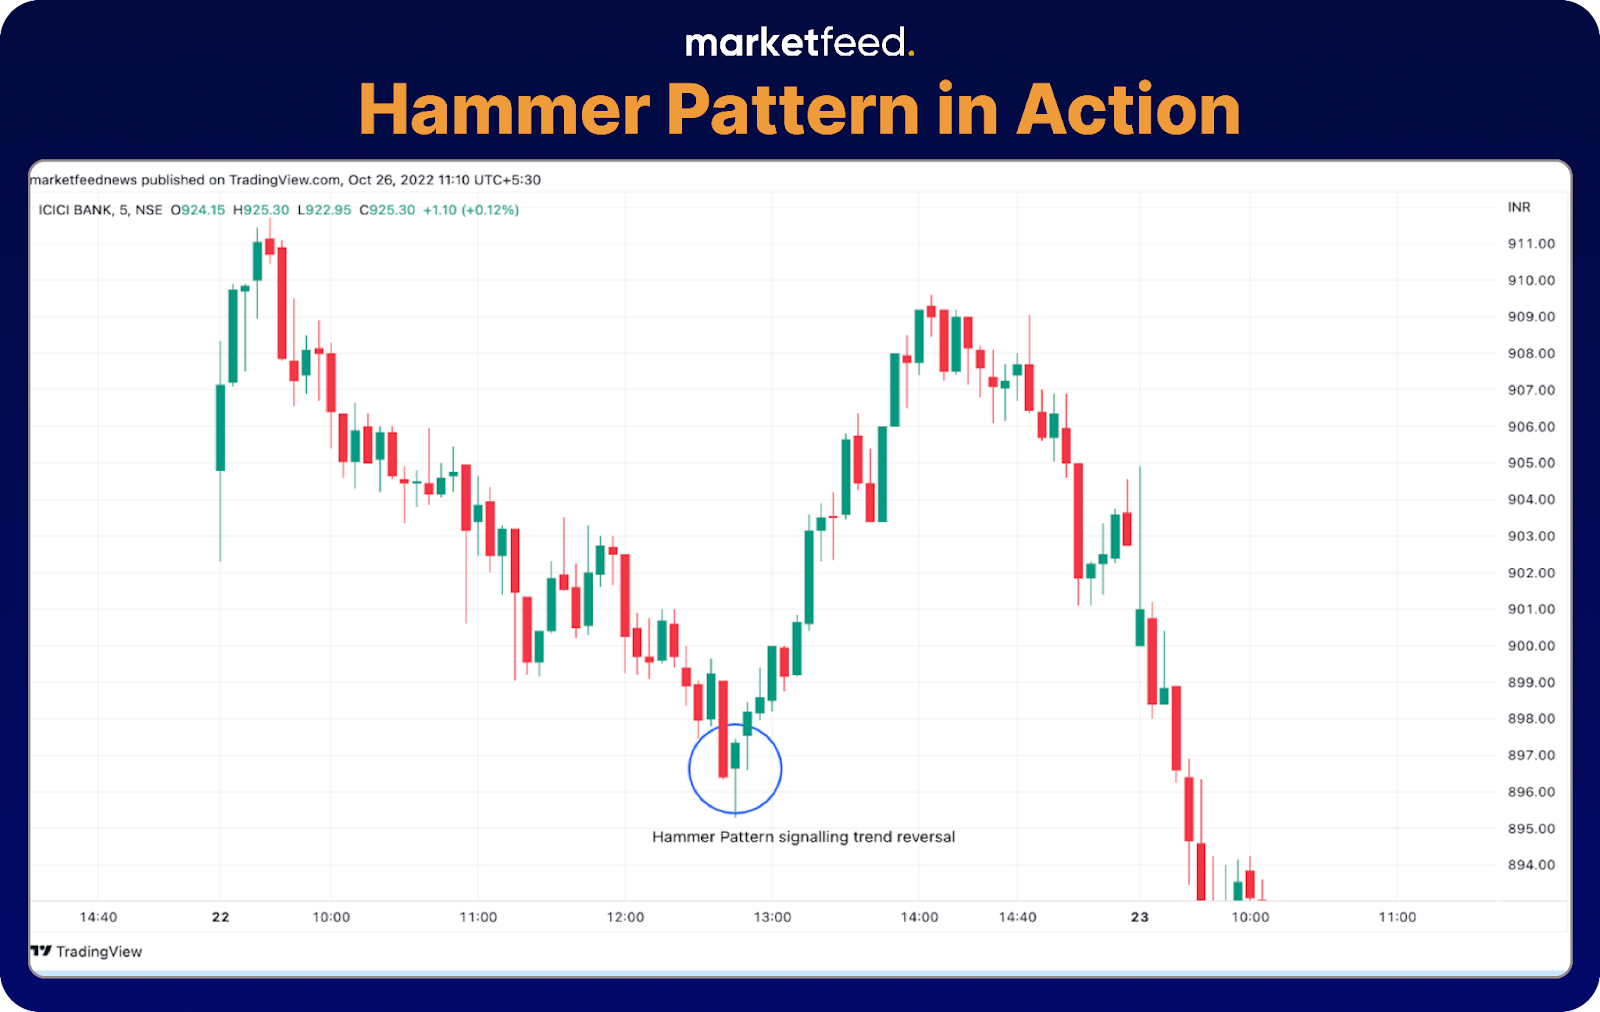
4. Hammer

Hammer Candle | marketfeed

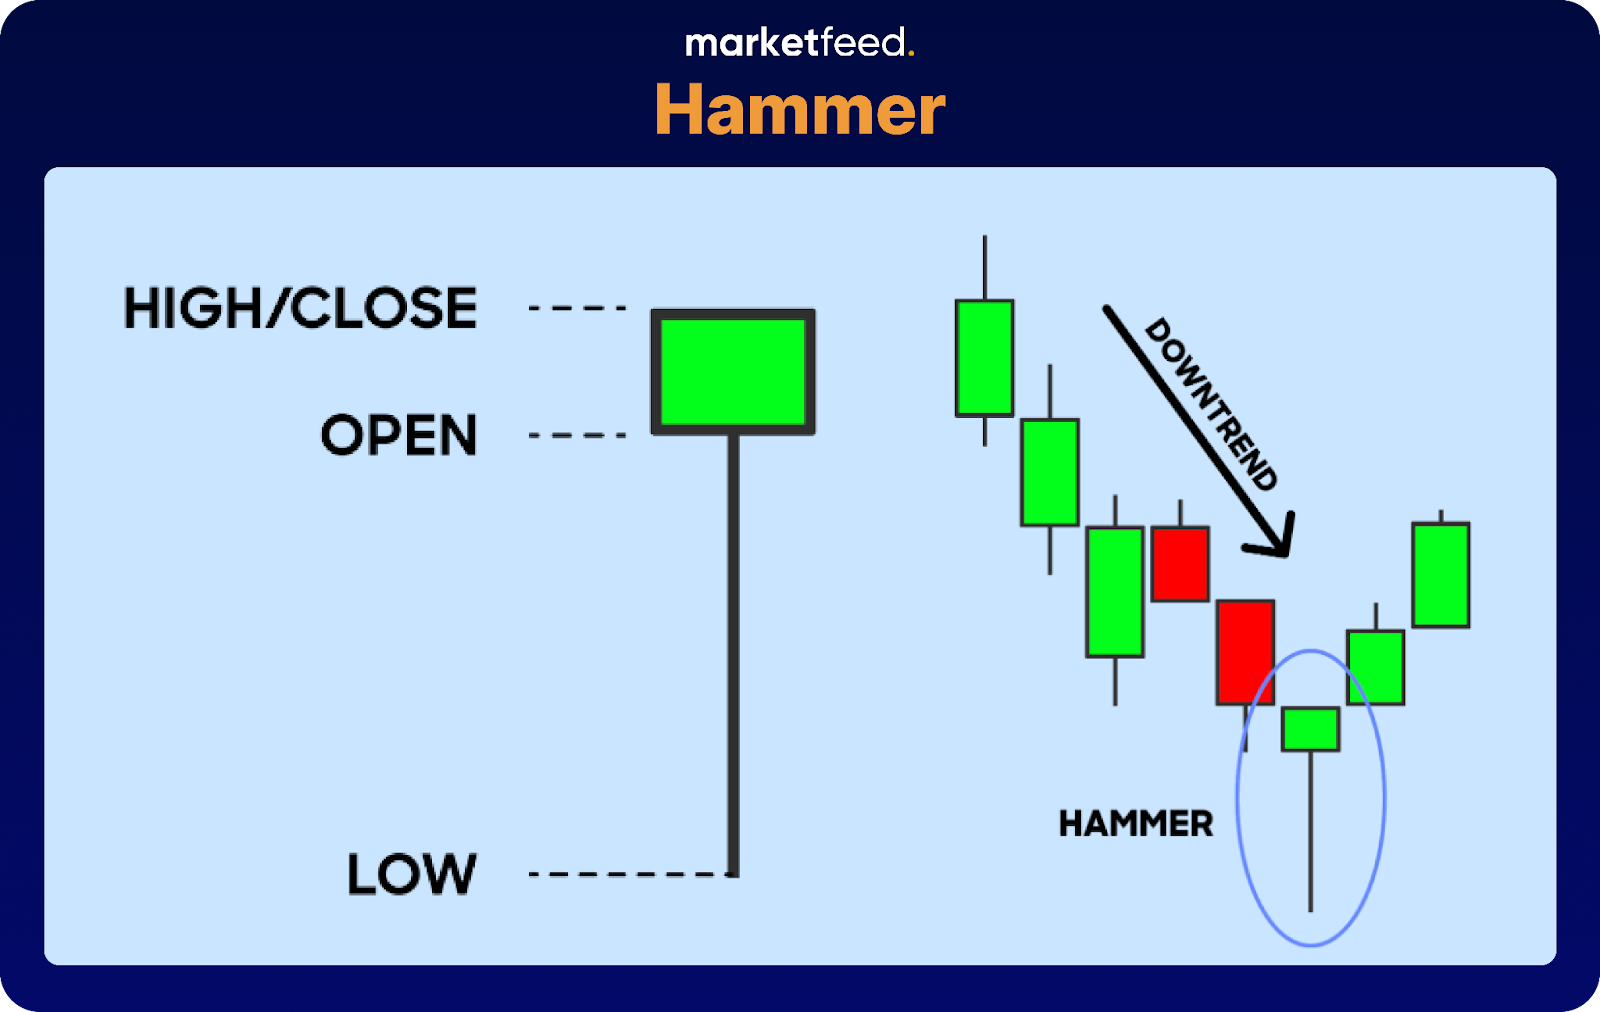
A hammer pattern forms at the bottom of a downward rally.

  • They are indicated by a small upper real body and long lower wick.
  • The length of the lower wick should be around twice as much as the length of the real body.
  • The colour of the body does not matter.
Hammer Pattern Chart

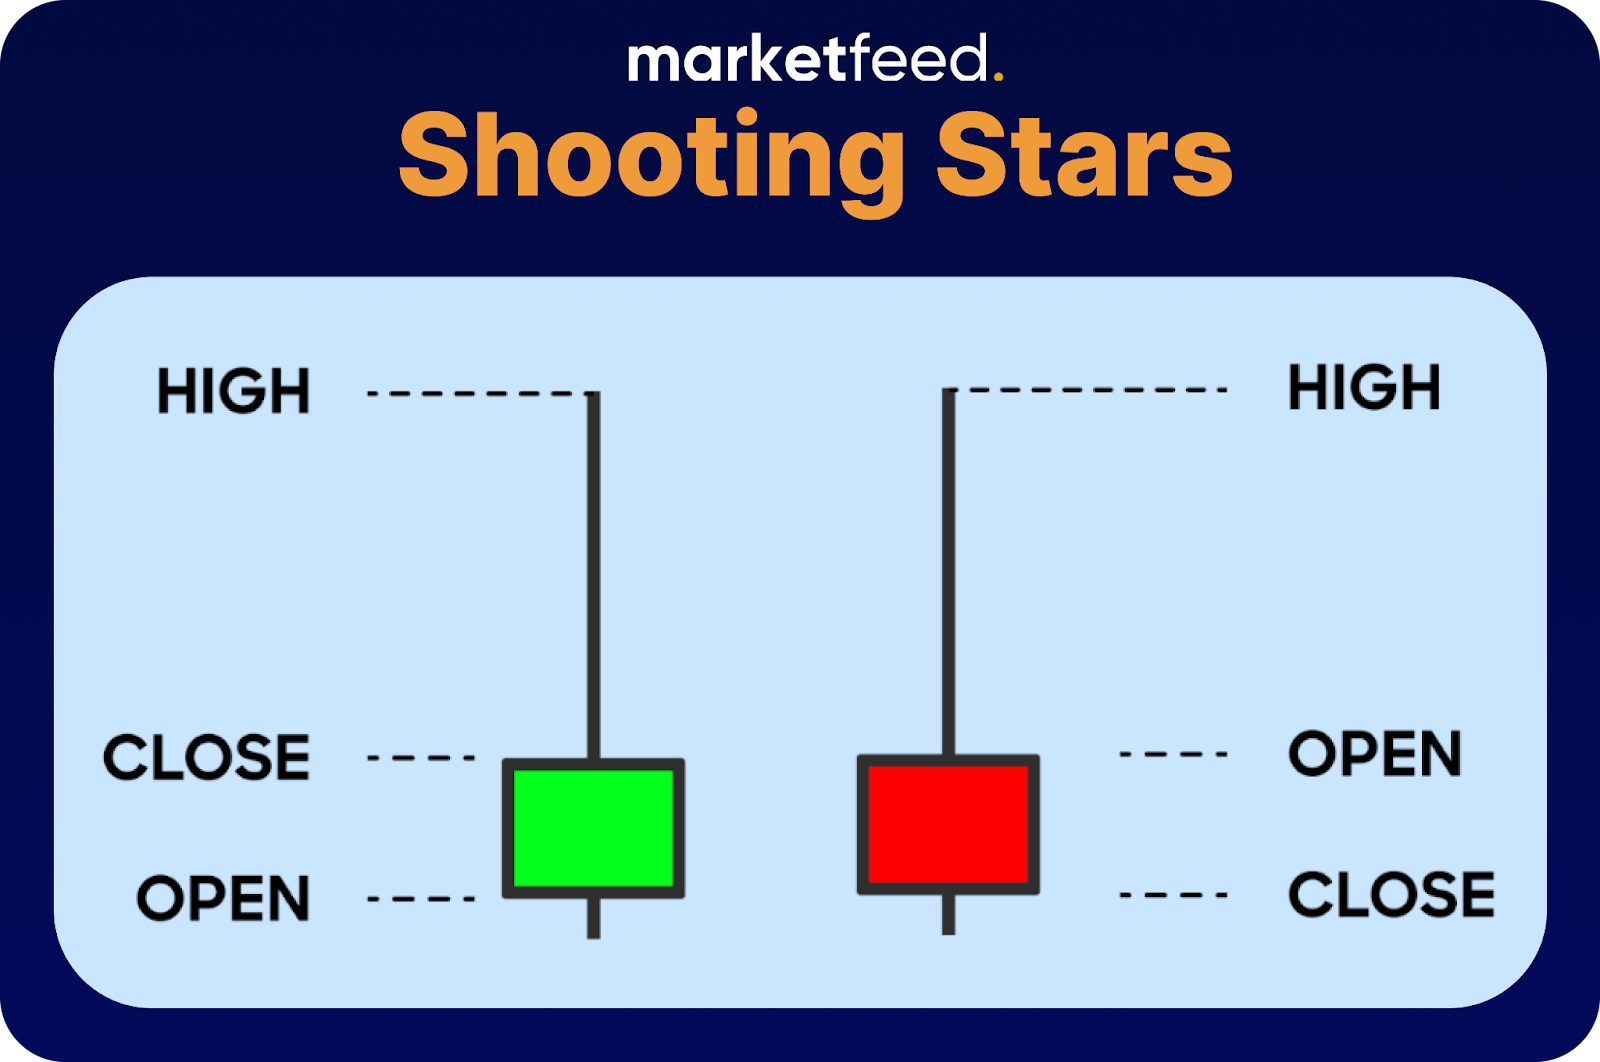
5. Shooting Star

Shooting Star | marketfeed

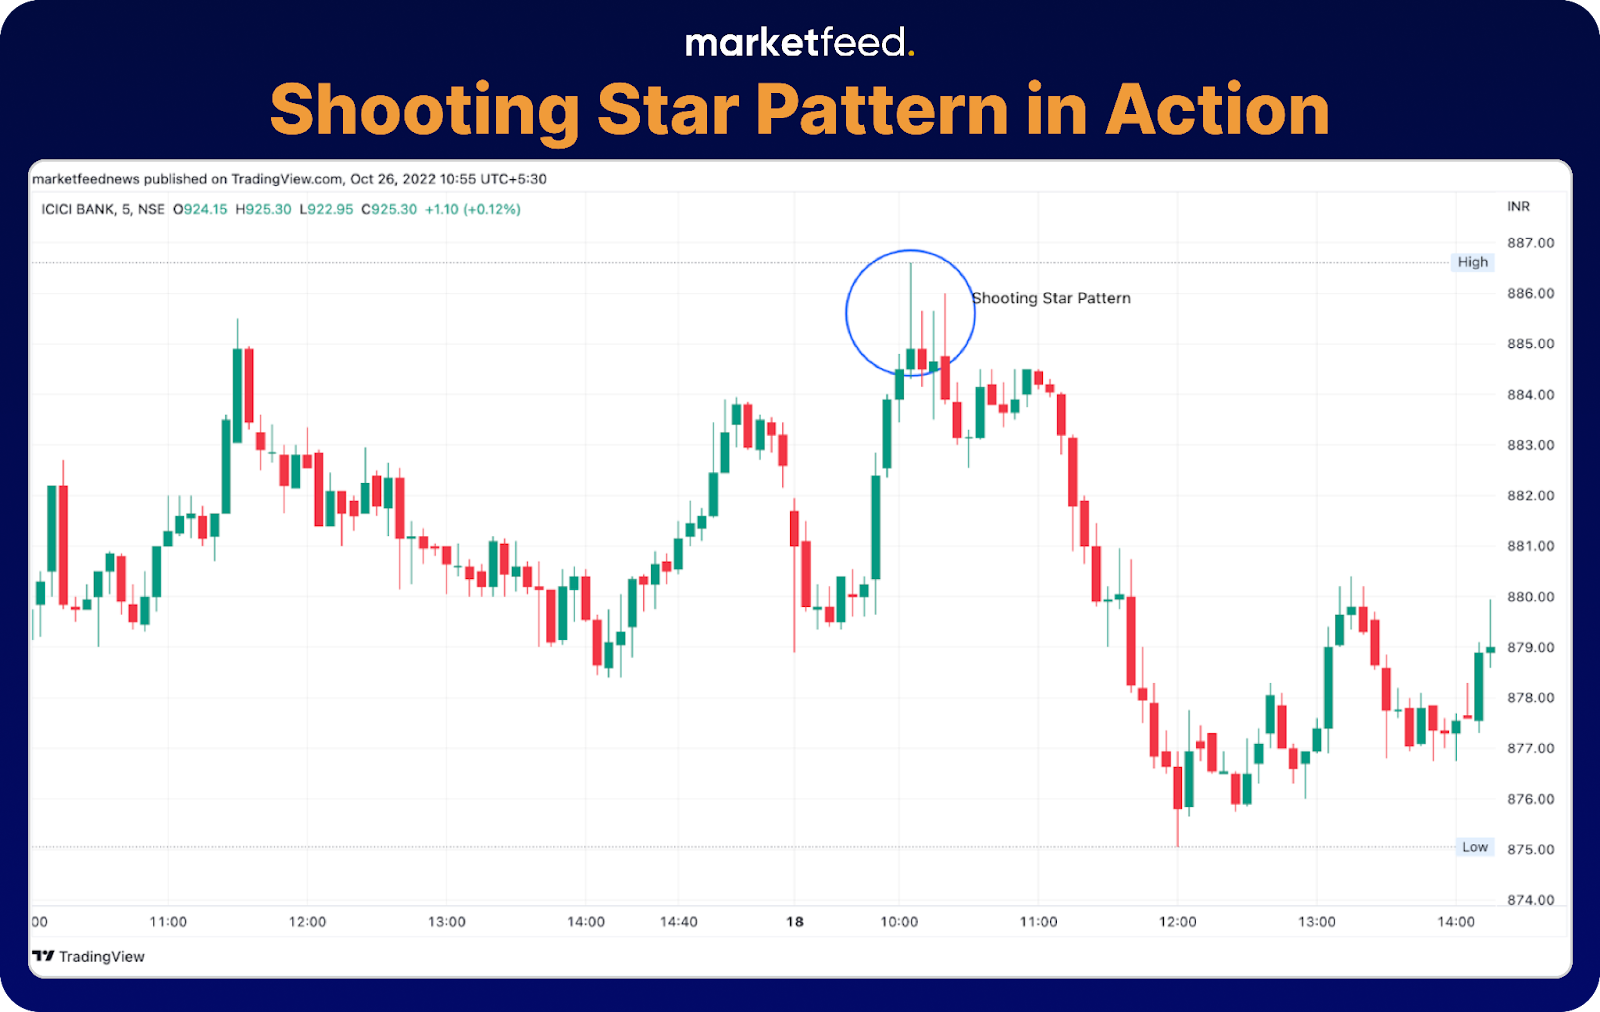
It indicates the end of bullishness at the top of a rally.

  • It has a small lower body and a long upper wick
  • The longer the wick, the higher the bearishness
  • The color of the candle does not matter, but it is more reliable if it is a red candle
Shooting Star Pattern | marketfeed

In this article, we learnt what line charts and candlestick charts are. They provide valuable insights into market trends and sentiment. This article serves as a beginner’s guide to analysing candlestick charts and exploring various patterns that help decipher market movements. It’s a great starting point to enhance your understanding and explore the fascinating world of chart analysis.

Categories
Jargons

How to Check Vehicle Insurance Status Online?

Having valid vehicle insurance is essential for all vehicle owners as it offers financial protection and security in case of accidents or damages. In India, it is illegal to drive on public roads without a valid third-party liability policy. So it’s crucial to stay updated on your vehicle insurance status to avoid losing out on benefits unintentionally when it expires. In this article, we explain the various methods on how you can check vehicle insurance online.

Methods to Check Vehicle Insurance Status Online

There are multiple ways to check your vehicle insurance status. A few of them are listed out below:

How to Check Status through VAHAN?

Below are the steps to check vehicle insurance status online through the VAHAN website:

  1. Visit the Vahan website’s homepage. 
  1. Click on the ‘Know Your Vehicle Details’ tab at the top of the page.
  1. Log in using your phone number and OTP. If you do not already have an account, create one using the registration option in the same window.
  1. Enter your vehicle registration number.
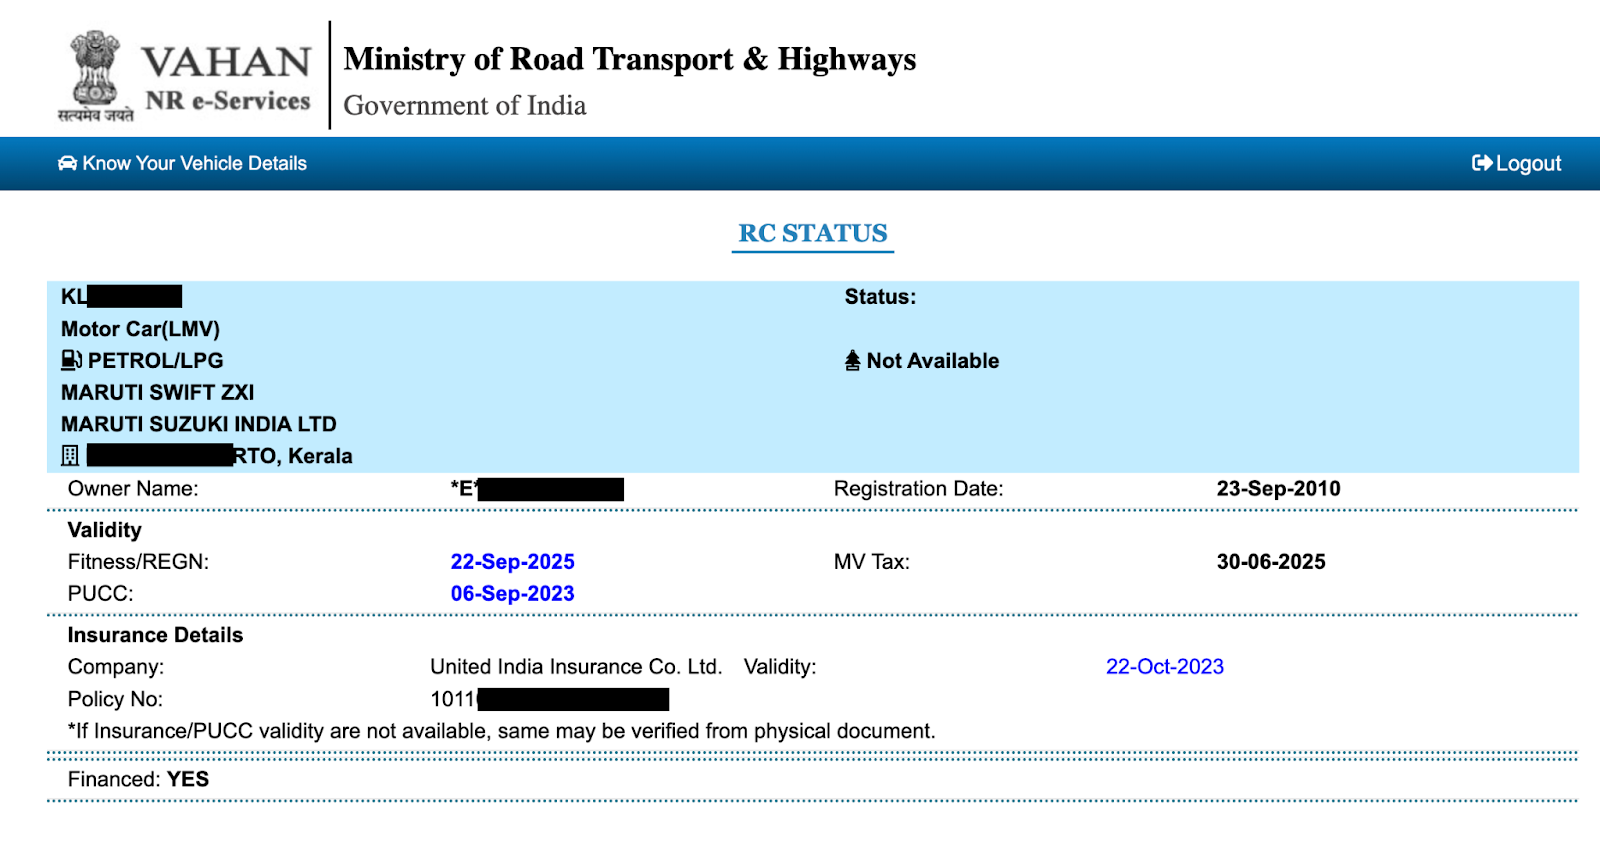
  1. Input the captcha and click on ‘Vahan Search’. The screen will display your vehicle’s registration certificate (RC) status.

You will find the insurance status and other details under ‘Insurance Details’, including the insurance company, policy number, and validity.

Checking Vehicle Insurance Status Online through VAHAN

How to Check Insurance Status on mParivahan App?

Follow the steps below to check your status on the mParivahan App:

  1. Open the mParivahan app on your mobile phone. You can download the app from the Play Store or App Store.
  1. Choose the desired language and click ‘Continue’.
  1. On clicking the ‘Continue’ button, a dashboard will open, giving you two options to check the vehicle insurance status. 
  1. Input the vehicle registration number or driving license and click ‘Search’.
  1. Now, sign in using your registered mobile number and continue.

Once signed in, you can check the status of your vehicle insurance.

How to Check Vehicle Insurance Status Online through RTO Website?

Follow the steps given below to check your vehicle insurance status online through the Regional Transport Office (RTO) website:

  1. Visit the official website of your State’s transport office.
  1. Navigate to ‘Online Services – For Citizens’.
  1. Select the ‘Vehicle Related Online Services’ option.
  1. Click on ‘VAHAN Citizen Services’.
  1. Select the details of your RTO where your vehicle is registered.
  1. Navigate to the ‘Status’ tab on the menu bar and select ‘Know Your Vehicle Details’.
  1. Enter your vehicle’s registration number, chassis number, and engine number.
  1. Fill in the captcha and click on ‘Submit’.

The screen will display your vehicle’s insurance status.

How to Check Vehicle Insurance Status Online through Parivahan Sewa?

Below are the steps to check vehicle insurance status online through Parivahan Sewa:

  1. Visit Parivahan Sewa’s website
  1. Navigate to the menu bar and select ‘Informational Services’.
  1. Click ‘Know Your Vehicle Details’ from the dropdown list.
  1. You will be redirected to VAHAN – national e-services webpage.
  1. Log in using your phone number and OTP. If you do not already have an account, create one using the registration option in the same window.
  1. Enter your vehicle registration number.
  1. Input the captcha and click on ‘Vahan Search’. The screen will display your vehicle’s RC status.

You will find the insurance status and other details under insurance details, including the insurance company, policy number, and validity.

How to Check Vehicle Insurance Status Online on IIB Portal?

This particular method is recommended for use exclusively when there is an accident. 

Below are the steps to check vehicle insurance status online on Insurance Information Bureau (IIB) portal:

  1. Log in to the Insurance Information Bureau’s (IIB) Vehicle Insurance Status Search.
  1. Input all the required data.
  1. Click on ‘Submit’ to receive the insurance details.

You will find the insurance status and other details under insurance details, including the insurance company, policy number, and validity.

Checking Vehicle Insurance Status Online on IIB Portal

In addition to the methods mentioned above, you can check your vehicle’s insurance status by checking the insurance policy document. You can also call your insurer’s customer support or insurance agent and ask for the expiry date. Setting a reminder before the expiry of the vehicle insurance policy can help you remain updated!

Categories
Jargons

Which are the Top FMCG Stocks in India?

Products that are sold quickly and at relatively low cost are known as fast-moving consumer goods (FMCG). Another name for such products is consumer packaged goods. FMCGs have a limited shelf life due to high consumer demand (such as for soft drinks and confections) or perishability (such as for meat, dairy products, and baked goods). The top three sectors of this business are Food & Beverages (19%), Healthcare (31%), and Household & Personal Care (50%), respectively. In this article, explore the top FMCG stocks in India!

An Overview of the FMCG Industry

India’s FMCG industry is the biggest in the world. It is estimated that the FMCG sector accounts for around 15% of India’s gross domestic product (GDP) and employs more than 1 crore people. Consumer electronics, food, personal care products, home goods, over-the-counter medications, and other items are all included in this industry. The FMCG industry is optimistic about at least 20% growth in 2023 after ‘exponential growth’ in 2022:

  • Favourable government policies, a growing rural market and young population, and the expansion of e-commerce platforms are some of the sector’s main development factors.
  • India has a middle-class population that is greater than the population of the USA, making it a country that no FMCG company can afford to ignore.  The FMCG market keeps expanding as more and more people begin to climb the economic ladder and the general public obtains access to the benefits of economic progress. 
  • More importantly, India’s population is getting more consumerist with growing disposable income. Government efforts to broaden financial inclusion and provide social safety nets have further contributed to this. 
  • The FMCG market in India is expected to increase at a CAGR of 14.9% to reach $220 billion by 2025, from $110 billion in 2020. 

Top FMCG Stocks in India:

S. No.Stocks5-Year Returns
1Hindustan Unilever Ltd. 62%
2ITC Ltd.72%
3. Nestle India Ltd. 123%
4Britannia Industries Ltd. 61%
5Varun Beverages Ltd.696%
(Figures are as of July 17, 2023. Past performance is no guarantee of future results)

1. Hindustan Unilever Ltd (HUL)

Home care, beauty & personal care, and foods & refreshment are Hindustan Unilever Ltd’s three main FMCG business sectors. The company sells its products largely in India and has manufacturing plants all across the nation. With over 40 brands available across 12 distinct categories, including personal care, fabric care, skincare, hair care, oral care, deodorants, cosmetics goods, beverages, ice cream, frozen desserts, and water filters, HUL is an important part of millions of Indians’ lives. Dove, Lifebuoy, Knorr, and Pears Soap are a few of their brands. Home care brings in 34% of the company’s income, followed by beauty and personal care (44%) and food & drink (19%). HUL has also forayed into the health and wellbeing segment through two strategic investments.

Over the last 5 years, the company’s revenue has grown at a CAGR of 9.35%, while profits have a CAGR of 14.6%. The company is nearly debt free and has a healthy dividend payout ratio of 99.9%. The stock has moved up 62% over the past five years. 

2. ITC Ltd

Established in 1910, ITC is the biggest cigarette producer and retailer in the nation. The five business divisions that ITC now works in are FMCG Cigarettes, FMCG Others, Hotels, Paperboards, Paper and Packaging, and Agri-Business. Aashirvaad, Sunfeast, Yippee!, Bingo!, B Natural, ITC Master Chef, Fabelle, Sunbean, and Fiama are among ITC’s top FMCG brands. Additionally, it has added frozen food items, ghee, dairy products, and premium chocolates to its collection of branded packaged meals. ITC is known for assuring precise production and packaging quality. They have a wide variety of distribution outlets in India and have gained access to the remotest of locations through a variety of stores. It is anticipated that ITC will increase its involvement in the eastern market for spices due to its most recent acquisition of Sunrise Foods Pvt Ltd. 

The company is nearly debt free and has been maintaining a debt payout of 92%. Over the past five years, the revenue had a CAGR of 7% and net income has had a CAGR of 8%. The company has delivered a poor sales growth of 10% over the past five years. ITC stock has given a decent return of 72% over the past 5 years. 

3. Nestle India Ltd. 

Nestle India Ltd. is a dominant company in the Indian FMCG market with a strong market presence in the majority of its product categories. The business, which sells various goods under the Maggi brand is a trendsetter in the food service industry. In terms of dairy and nourishment products (96% in infant cereals), drinks (Nescafe 51%), processed foods (Instant Pasta Maggi -69%), kitchen aids (Nestle everyday 44%), and confectionery (63%). The company markets its products under the EVERYDAY, NESCAFE, NESTEA, Maggi, KitKat, Munch, Nestle, POLO, Bar-One, Milkmaid, Milkybar, Alpino, and Eclairs brands, among others.

Nestle India’s revenue has given a CAGR of 11.5% over the past 5 years while the net income has grown at a CAGR of 14%. The company has maintained a healthy dividend payout of about 91%. However, it has delivered poor sales growth of 11.0% over the past five years. The company’s stock has jumped 123% over the past five years. 

4. Britannia Industries Ltd. 

Britannia Industries has a rich 100-year history. It is one of the major leaders in the Indian biscuit industry with a market share of more than one-third in terms of value. The company’s portfolio has a good proportion of each of the seven varieties of biscuits it produces, including glucose, Marie, cookies, crackers, cream, milk, and health. Additionally, the company’s whole product line includes recognisable trademarks including Milk Bikis, Tiger, Marie, and Good Day. 

Over the past five years, revenue and net income have seen a decent CAGR of 9.3% and 11.5%, respectively. Despite maintaining a high dividend distribution of 123%, the company’s growth in sales over the previous five years was just 10.5%. Britannia’s shares have risen 61% in 5 years. 

5. Varun Beverages Ltd.

Varun Beverages Ltd (VBL) is engaged in the manufacturing, sales, and distribution of PepsiCo’s beverages in pre-defined territories in India. The company is PepsiCo India’s second-largest international franchisee (after the United States) for carbonated soft drinks and non-carbonated beverages. VBL is a part of the RJ Corp group, a commercial conglomerate with holdings in quick-service restaurants, dairy products, and healthcare. Some of the key brands sold under VBL include Pepsi, Mirinda, Mountain Dew, Seven-Up, etc. In addition, the company offers its products in Nepal, Sri Lanka, Morocco, Zimbabwe, Zambia, and Mozambique.

The company has reported an impressive revenue CAGR of 27% and a net income CAGR of 48% over the past 5 years. It has delivered good profit growth of 49.2% CAGR over the last 5 years. It has been maintaining a healthy dividend payout of 17.5%. However, promoter holding has decreased by about 4% over the last 3 years. The stock has given a spectacular return of 696% in the past 5 years.

Other Top FMCG Stocks in India:

  • Marico
  • Dabur India
  • Godrej Consumer Products
  • Colgate Palmolive
  • Tata Consumer Products
  • Jyothy Labs

In conclusion, India’s FMCG market is expanding quickly. Consumers are increasingly choosy and willing to pay more money for high-quality goods than low-quality ones. The FMCG market has expanded as a result of the rising demand for branded goods. It has grown faster in rural India than in urban India as a result of the expanding number of FMCG startups. The semi-urban and rural sectors are also experiencing rapid growth for these publicly listed FMCG firms in India. This makes FMCG one of the strongest sectors with very high potential. And now you know which are the top FMCG stocks in India you could invest in!

Disclaimer: The stocks mentioned in the article are solely for educational purposes. Please do your own research before investing.
Categories
Jargons

How to Change Mobile Number in Aadhaar Card?

The Aadhaar card has become essential for accessing various services and verifying documents. To fully utilise the online features associated with Aadhaar, it is crucial to register your mobile number with the Unique Identification Authority of India (UIDAI). In this article, learn how you can change the mobile number linked to your Aadhaar card.

A registered mobile number is necessary to receive one-time passwords (OTPs) for authentication and use the mAadhaar app. If you need to change the mobile number linked with your Aadhaar card or your previously registered number is no longer valid, simply visit an Aadhaar Enrolment Centre. ​​Changing the mobile number associated with your Aadhaar card cannot be done online.

Here’s How You Can Change Mobile Number in Aadhaar Card?

Follow the easy steps below to change the mobile number on your Aadhaar Card:

  • Step 2: Request the Aadhaar executive for an Aadhaar Correction Form and fill it out.
  • Step 3: Submit the form to the authorised officer
  • Step 4: Pay the Aadhaar demographics update fee of Rs 50.
  • Step 5: You will receive an acknowledgement slip with an Update Request Number (URN), which will help you track the status of your update request.
  • Step 6: The mobile number update in Aadhaar will be complete within 30 days.

How to Check Mobile Number Update Status in Aadhaar Card

Given below are the simple steps to check the status of your mobile number update request:

  • Step 2: Input the URN that you received in the acknowledgement slip. Alternatively, you can input Service Request Number (SRN) or Enrolment ID (EID) to track the status.
  • Step 3: Enter the captcha and click on “Submit”.
  • Step 4: You will see the status of your update/mobile number change request.

How to Verify Aadhaar Card Mobile Number Online

There are two methods to verify the mobile number linked with your Aadhaar:

Method 1: Using verify email/mobile number option

  • Step 2: Navigate to ‘MyAadhaar menu’ and click on ‘verify email/mobile number’ under ‘Aadhaar Services’.
  • Step 3: Choose the verify mobile number option.
  • Step 4: Enter your Aadhaar number and registered mobile number.
  • Step 5: Enter the captcha and click on “Send OTP”.

If the mobile number you entered is linked to your Aadhaar in UIDAI’s database, a popup will be displayed saying the mobile number is verified. If it isn’t linked to your Aadhaar, the popup will say that the mobile number does not match UIDAI’s records.

Method 2: Using verify Aadhaar number option

  • Step 2: Navigate to ‘MyAadhaar menu’ and click on ‘Verify Aadhaar Number’ under ‘Aadhaar Services’.
  • Step 3: Enter your Aadhaar number.
  • Step 4: Enter the captcha and click on ‘proceed & verify Aadhaar’.

On the screen, you will see your personal details, including your Aadhaar number and registered mobile number. From this screen, you can verify your registered mobile number.

Why Should You Link Mobile Number with Aadhaar?

To use all Aadhar services, it’s necessary to link your mobile number with Aadhaar. Here are some of the vital services offered by UIDAI/Aadhaar:

  1. All online Aadhaar facilities
  2. Pancard application (new/reprint)
  3. Digilocker
  4. mAadhaar App
  5. Mobile re-verification
  6. Mutual Find linking with Aadhaar
  7. Umang App
  8. Online EPF claims and withdrawals

In short, linking the updated mobile number with your Aadhaar is simple and easy. However, if you haven’t linked any mobile number to Aadhaar, check out our article on how to easily link Aadhaar to your mobile number.

Categories
Jargons

How to Link Aadhaar With Mobile Number/OTP Online?

Aadhaar, the world’s largest biometric identification system, has become a crucial part of our daily lives. The Unique Identification Authority of India (UIDAI) issues the unique 12-digit identification number using your biometric and demographic data. In this article, we explain how you can link your Aadhaar with a mobile number.

Linking Aadhaar with a mobile number enhances security and provides easy access to essential services and the digital economy. It simplifies various government service verification processes and supports the Aadhaar eSign infrastructure. Failure to link Aadhaar with a mobile number may lead to the disconnection of mobile services, as mandated by the government.

How to Link Aadhaar with Mobile Number Online

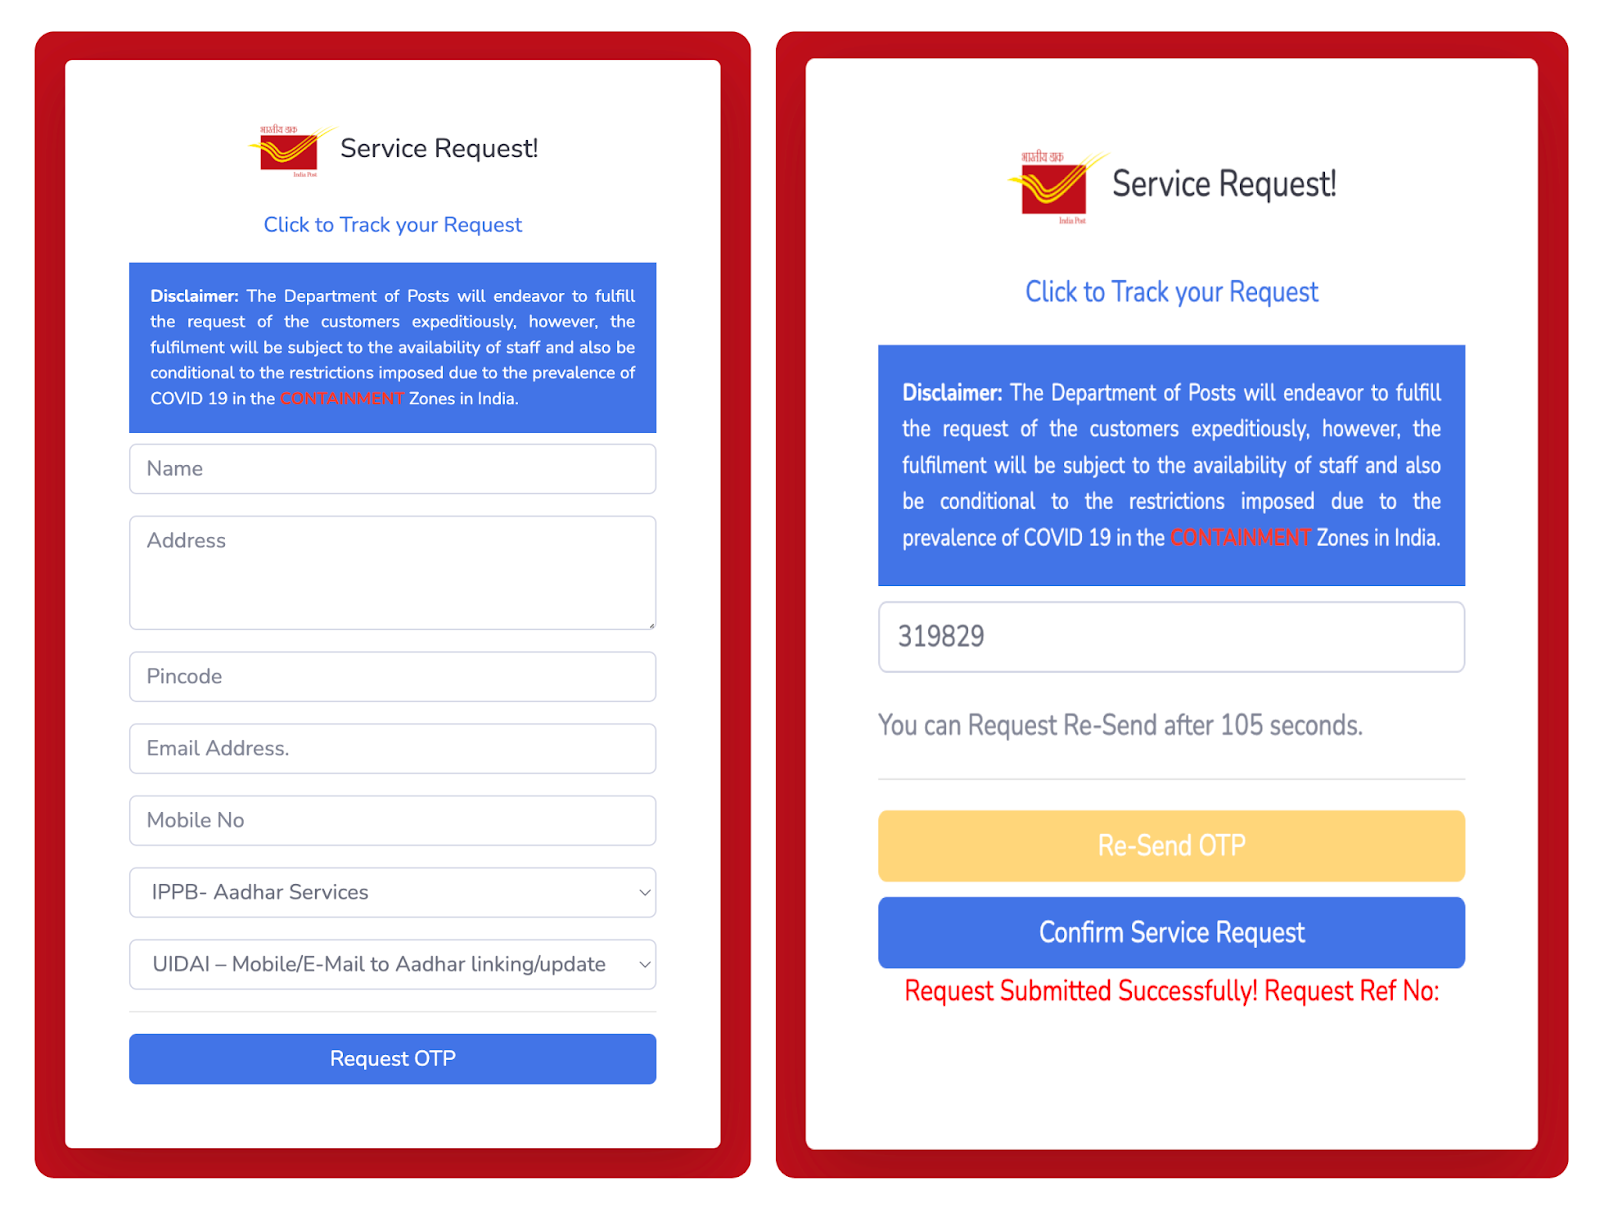
You can link Aadhaar with a mobile number on India Post’s website in 10 easy steps:

Step 1: Visit India Post’s website

Step 2: Enter basic details like name, address, mobile number, and email address.

Step 3: Select ‘IPPB – Aadhaar Services’ as the service from the drop-down menu.

Step 4: Select ‘UIDAI – Mobile/Email to Aadhaar linking/update’ as the sub-category.

Step 5: Once all the required details are filled in accurately, click the ‘Request OTP’ button.

Step 6: On the next screen, enter the OTP received on your mobile number.

Step 7: Click on ‘Confirm Service Request’. Then, you will receive a Reference Number that allows you to track the status of your application.

Step 8: Once your submission is successful, the request will be forwarded to the nearest post office to your address

Step 9: An officer designated for Aadhaar update/linking will conduct the verification process. The officer will visit your address and use a mobile biometric device (for iris scans, fingerprints, and photographs) to perform the verification process.

Step 10: Upon completion of the update/linking process, the officer will charge you a service fee of ₹50.

Post office aadhar linking

How to Link Aadhaar with Mobile Number Offline

You can link your Aadhaar with a mobile number offline by visiting the nearest Aadhaar enrolment centre or the local office of your telecom operator.

How to Link Aadhaar with Mobile Number by Visiting an Aadhaar Enrolment Center:

Step 1: Locate and visit a nearby Aadhaar Enrolment Center.

Step 2: If you haven’t already enrolled for Aadhaar, enter your mobile number in the Aadhaar Enrolment Form to link your Aadhaar with your mobile number. If you have already enrolled for Aadhaar, link/update your phone number by filling out the Aadhaar Correction Form.

Step 3: Submit the correctly filled form to the authorised officer.

Step 4: Provide your biometrics (iris & fingerprints) for authentication.

Step 5: You will receive an Acknowledgement slip, which includes an Update Request Number (URN) that can be used to track the progress of your Aadhaar update. You can track the progress by dialling UIDAI’s toll-free number: 1947.

Step 6: Click on ‘Confirm Service Request’. You will get a Reference Number that can be used to track the status of your application.

Step 7: Aadhaar reprint is not necessary after updation.

Step 8: Once the process is complete, you will begin receiving OTPs for all Aadhaar services.

How to Link Aadhaar with Mobile Number by Visiting Telecom Operator’s Office:

Step 1: Locate and visit your nearest Telecom operator’s office.

Step 2: Provide the authorised officer with a self-attested copy of your Aadhaar card.

Step 3: Provide the executive with your mobile number and Aadhaar details.

Step 4: Use the re-verification application to generate a 4-digit OTP, which will be sent to your mobile number.

Step 5: Submit the OTP to the executive and provide biometrics.

Step 6: You will receive a confirmation SMS after 24 hours. Reply “Y” to complete the e-KYC process.

Charges to Link Aadhaar with Mobile Number

A fee of ₹50 (inclusive of GST) is applicable for all types of demographic data updates, whether you do it offline or online. However, you do not have to pay any charges when you enrol for Aadhaar initially. To stay informed about the latest charges for Aadhaar-related services, you can review the UIDAI Fee Structure.

Benefits of Linking Aadhaar with Mobile Number

Here are some of the benefits of linking Aadhaar with a mobile number:

  1. Identity verification: Linking Aadhaar with a mobile number helps to confirm the authenticity of the user. It adds an extra layer of identity verification, which prevents others from impersonating you.
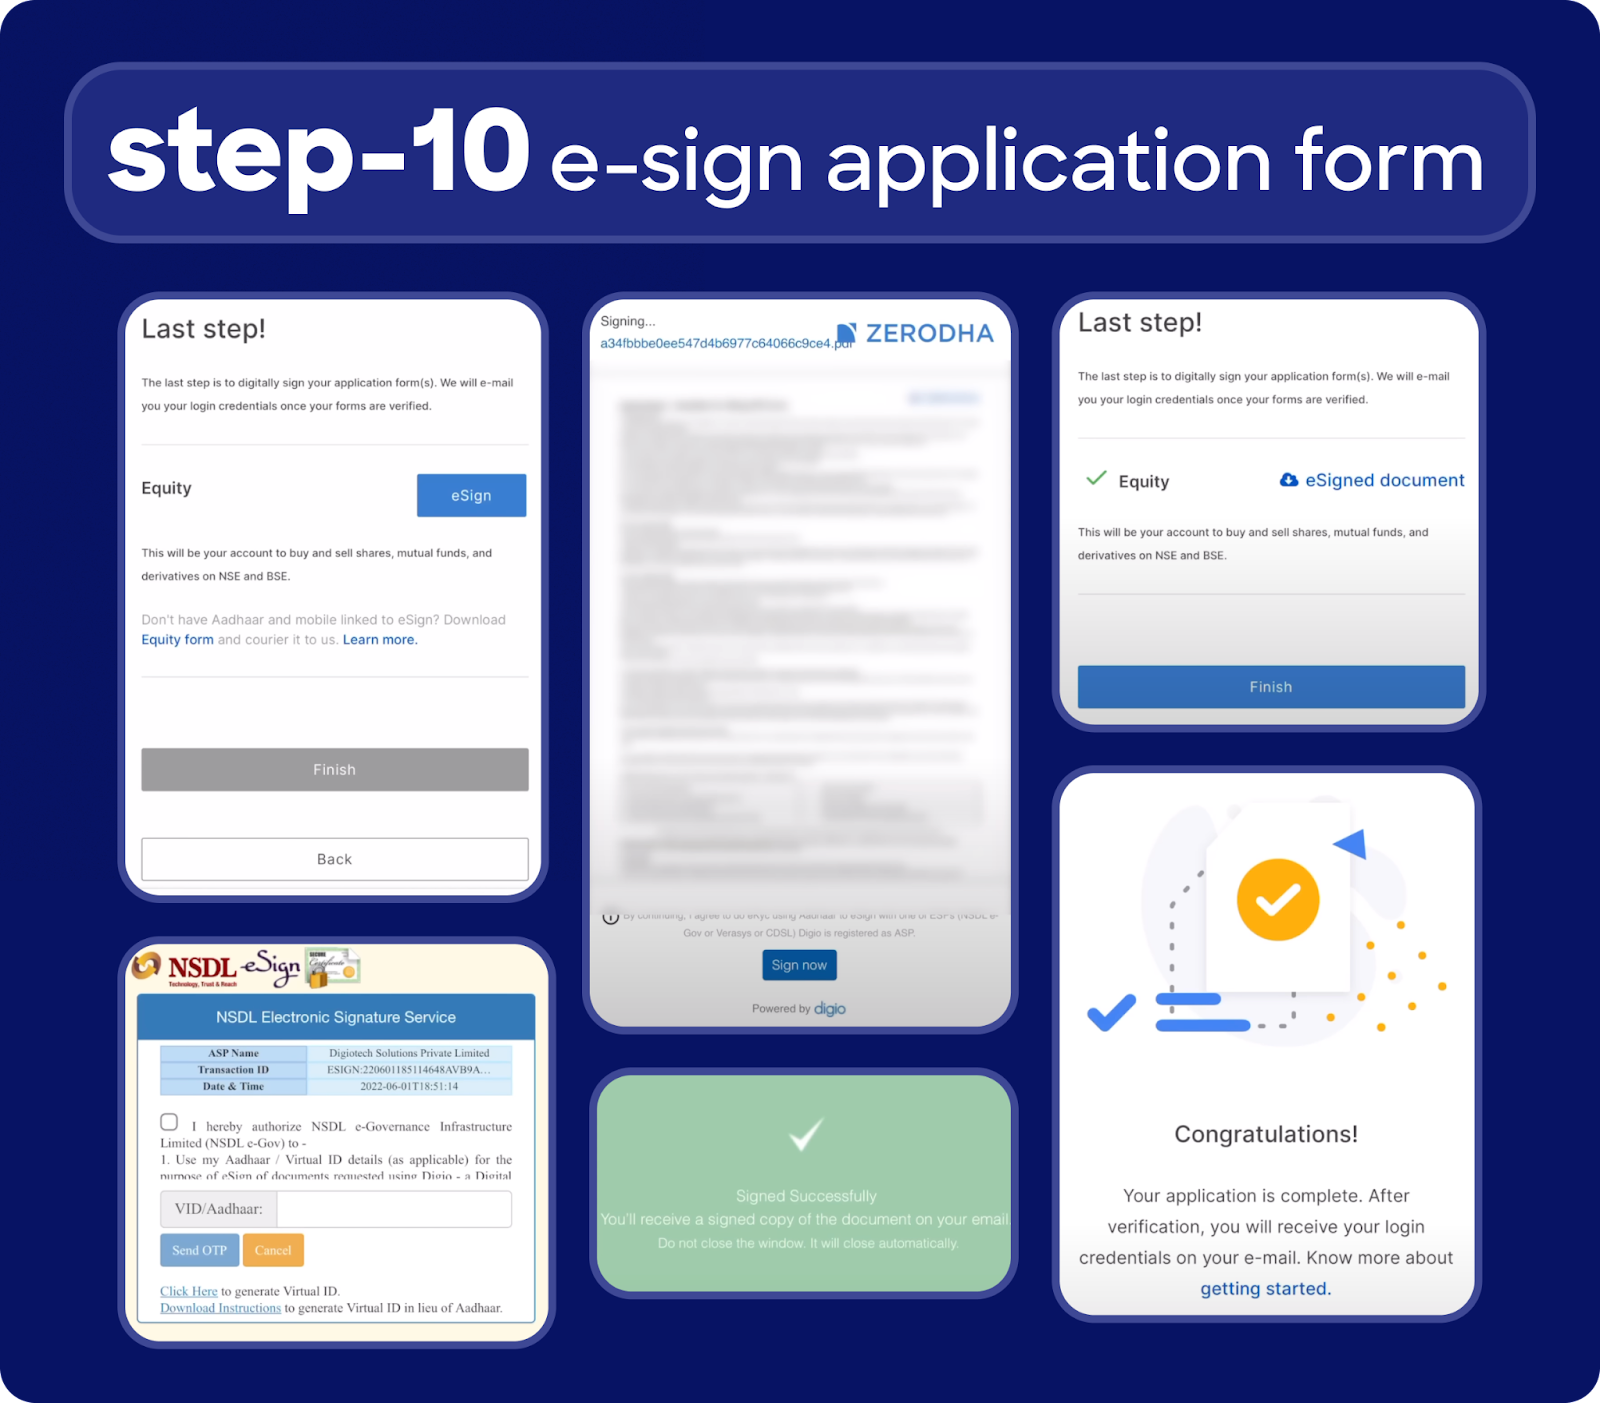
  2. Aadhaar E-sign: Aadhaar eSign is a method of digitally signing a document using an Aadhaar. Documents affixed with Aadhaar-based eSignatures have a legal value equivalent to that of hand-written signatures. eSign is used by the National Securities Depository Ltd (NSDL) for authentication requests related to trading and Demat accounts.
  3. Easy access to Government services: Many government subsidies, welfare schemes, and services require Aadhaar-based verification. By linking Aadhaar with a mobile number, individuals can easily avail of these services without the need for separate documentation.
  4. Seamless Digital Transactions: Aadhaar-linked mobile numbers enable individuals to participate in the digital economy more easily. It facilitates digital transactions, e-commerce, and online services, making it convenient to engage in various digital platforms.
  5. Enhanced security: Aadhaar-based mobile verification enhances the security of mobile communications. It helps prevent unauthorised access to mobile services and reduces the risk of identity theft or SIM card fraud.
  6. Efficient communication: Linking Aadhaar with a mobile number ensures that individuals receive important communication from government authorities, service providers, and financial institutions promptly. It helps in delivering important updates, alerts, and notifications directly to the linked mobile number.
  7. Streamlined Processes: Linking Aadhaar with mobile numbers simplifies the process of availing various services. It eliminates the need for separate identity verification during service enrollment or subscription. This saves time and effort for both individuals and service providers.

In conclusion, linking Aadhaar with a mobile number streamlines processes enhances security, and contributes to a more inclusive and digitally empowered society. It helps confirm your identity as an Indian citizen and allows the government to verify your information!

Categories
Jargons

6 Types of Chart Patterns Every Trader Should Know

Trend analysis, volume analysis, and candlestick patterns are powerful tools that help us understand how price behaves in the stock market. They allow us to take high-profitable trades. In this article, we dive into the most popular topic in technical analysis: chart patterns! We will explore 6 types of chart patterns every trader should know.

What are Chart Patterns?

Chart patterns are formations that appear in price charts and create some type of recognisable shape over time as the candlesticks keep forming. You can identify these patterns by drawing a line connecting common price points, such as the closing prices or the highs or lows during a period. Price action traders seek to identify patterns to anticipate the future price direction of a security.

These patterns are a graphical depiction of the collective market psychology at a given time as they form as a result of the behaviour of the market participants. There are few common chart patterns that appear repeatedly and often lead to similar subsequent price movements. These recurring patterns can form a basis for market analysis and price forecasting.

There are two categories of chart patterns in the market:

  1. Continuation Patterns – Continuation patterns indicate that an asset’s price trend is likely to continue in the same direction as which it was before the pattern occurred. They form during periods of consolidation.
  2. Reversal Patterns – Reversal patterns signal a change in the price trend and can be bullish or bearish.

The six most common types of chart patterns are:

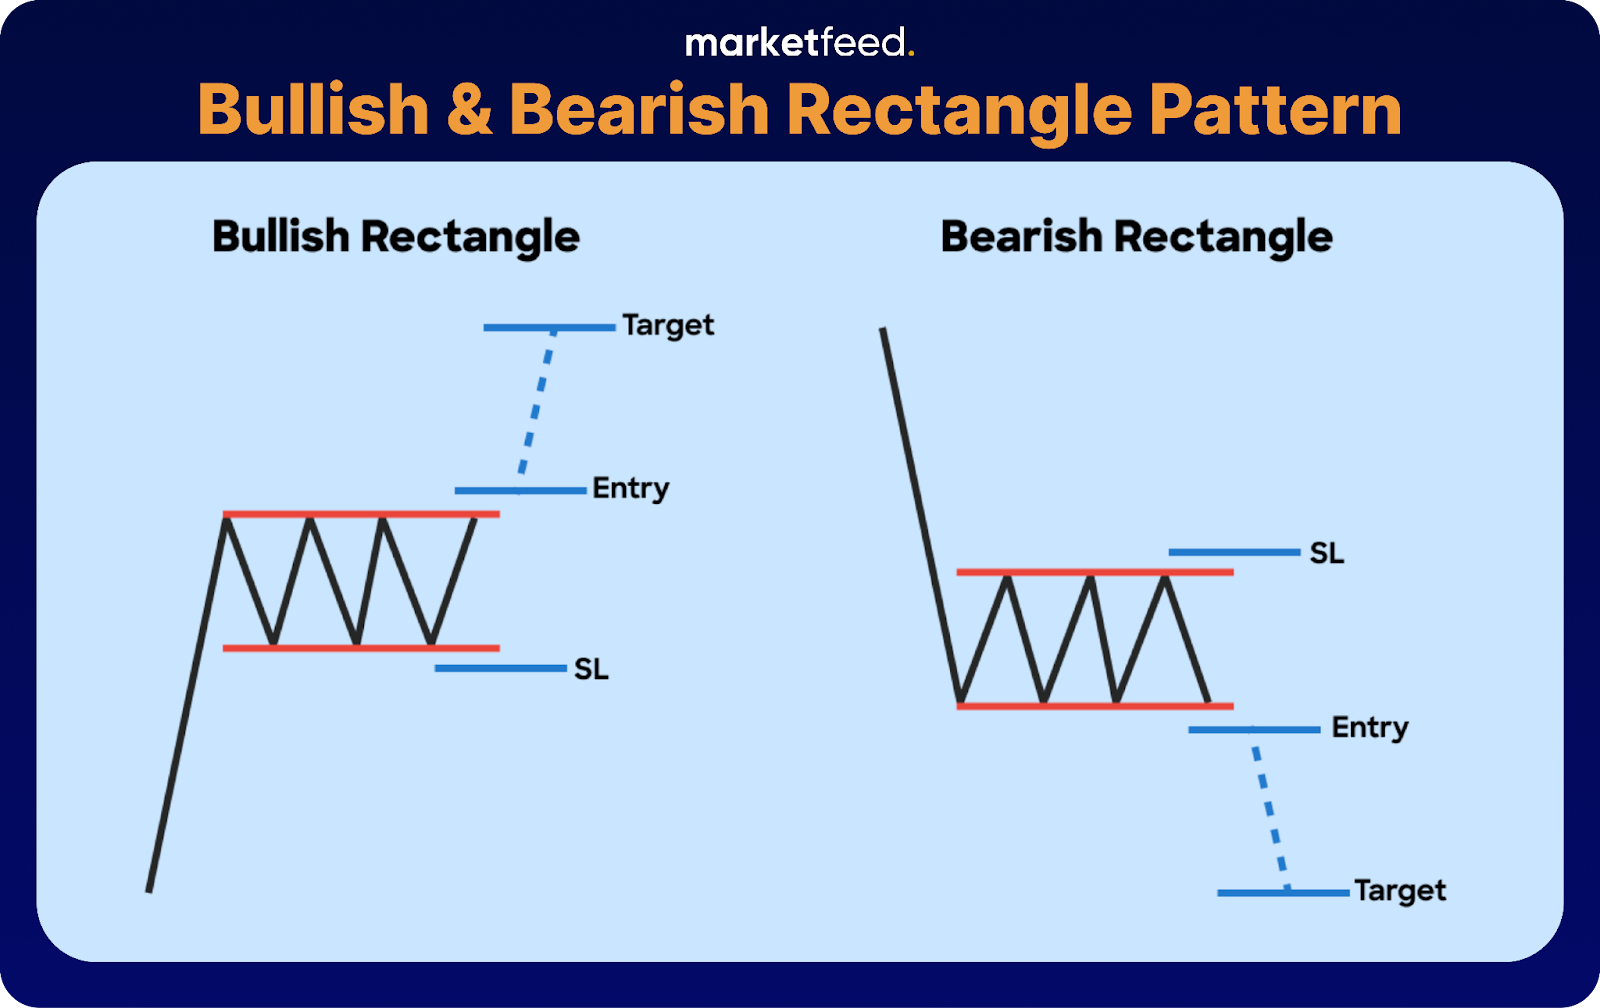
1. Bullish and Bearish Rectangle Pattern

Bullish and bearish rectangle pattern

A rectangle pattern usually develops as a continuation pattern and indicates consolidation. However, it can also be a reversal pattern. Two parallel trendlines form this pattern, one connecting the high prices and the other connecting the lows during the period. The trendline on the upper side acts as resistance, and the trendline on the bottom side acts as support.

Bullish Rectangle Pattern

A bullish rectangle pattern forms when the price consolidates in a range and tries to break out of the resistance. The horizontal resistance line that forms the top of the rectangle shows that the investors are repeatedly selling shares at that specific price level, bringing the short bullishness to an end. 

If the price breaks out of the resistance, you can consider a long trade with a stop loss (SL) below the support.

Bearish Rectangle Pattern

A bearish rectangle pattern forms when the price consolidates in a range and tries to break down from the support. The horizontal support line formed at the bottom of the rectangle shows that the investors are repeatedly buying shares at that specific price level. 

If the price breaks down from the support, you can consider a short trade with an SL above the resistance.

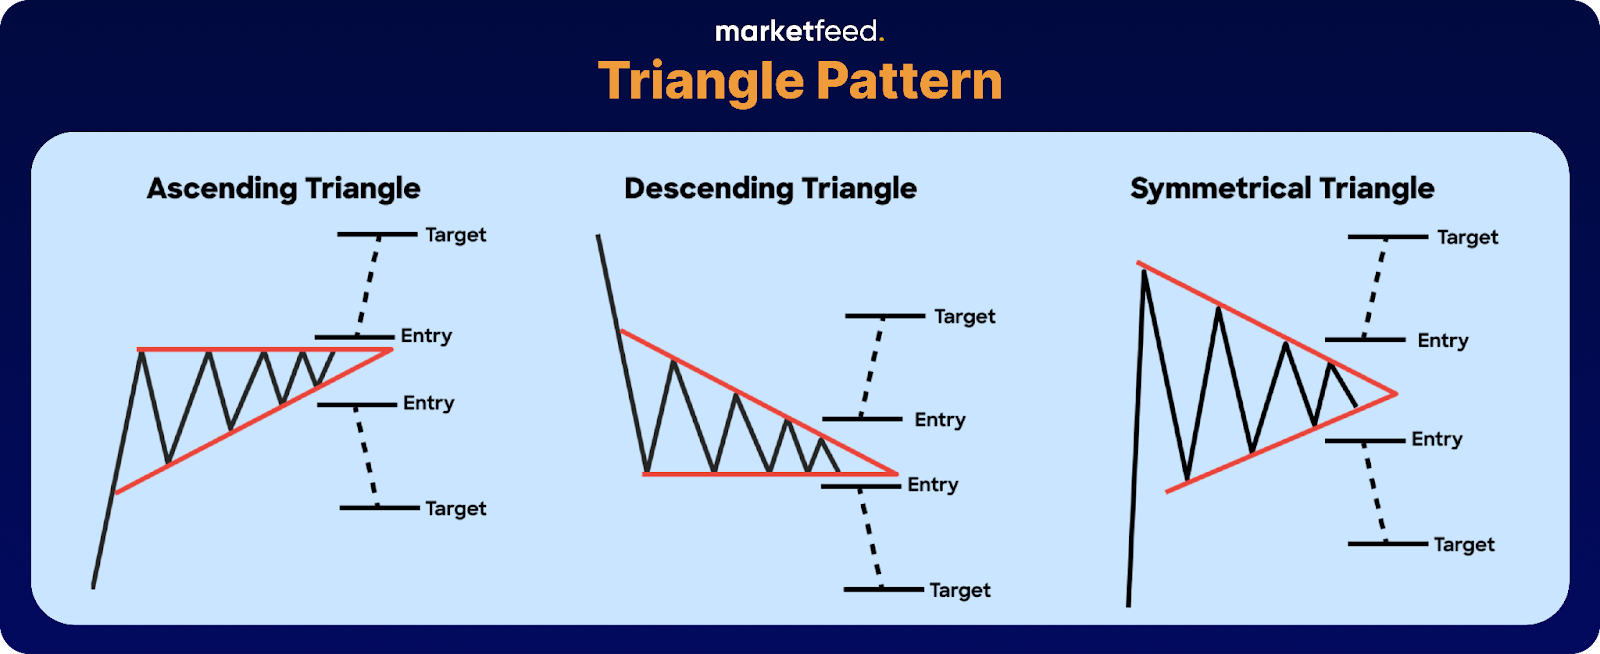
2. Triangle Patterns

Triangle pattern

A triangle pattern is a type of continuation pattern. A trendline connecting the highs and another connecting the lows forms this pattern. The upper trendline acts as resistance, and the bottom trendline acts as support. Triangle patterns are of three types:

Ascending Triangle Pattern

An ascending triangle pattern has the same highs and higher lows. The trendline connecting the high prices is horizontal, and the trendline connecting the low prices forms an uptrend. 

Descending Triangle Pattern

A descending triangle pattern has the same lows and lower highs. The low prices form a horizontal trendline, and the trendline connecting the high prices forms a downtrend.

Symmetrical Triangle Pattern

A symmetrical triangle pattern has lower highs and higher lows. The trendline formed by the highs slopes down, and the trendline formed by the lows slopes up. Both trendlines slant roughly at the same angle, creating a symmetrical pattern. 

  • If the price breaks out of the resistance, you can consider a long trade with the SL below the support. 
  • If the price breaks down from the support, you can consider a short trade with the SL above the resistance.

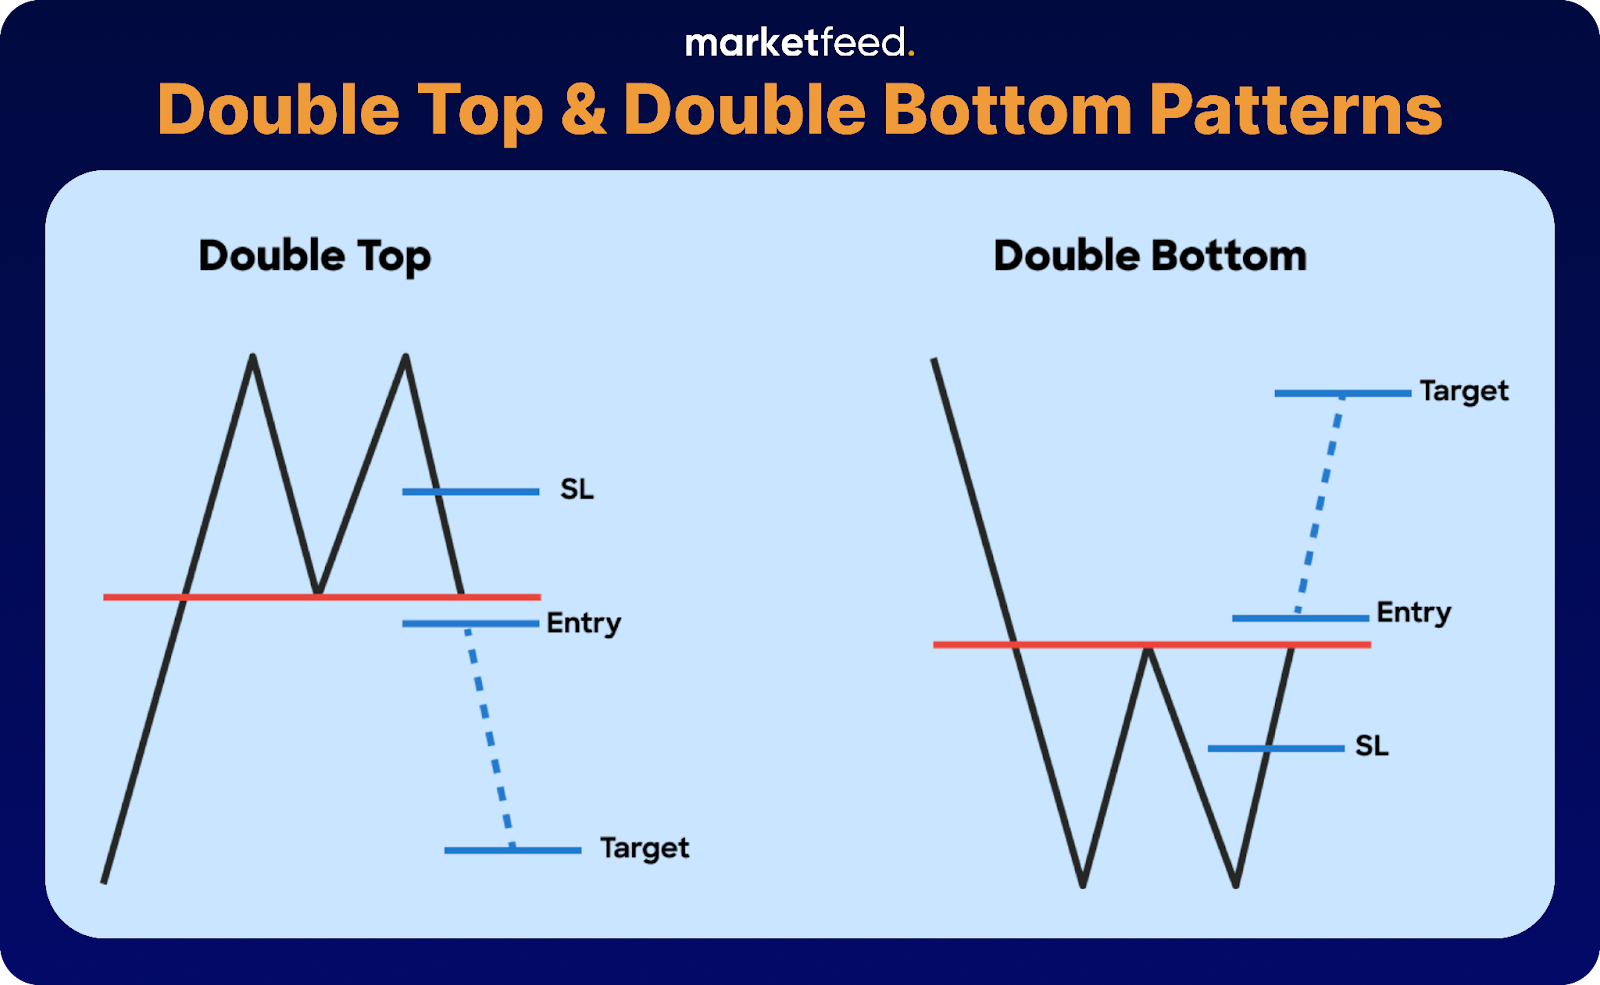
3. Double Top and Double Bottom

double top and double bottom

Double Top Pattern

A double-top pattern forms when an uptrend reverses twice at roughly the same high price level. Typically, volume is lower on the second high than on the first, signalling diminishing demand. The neckline for a double top is the horizontal line that touches the low between the two highs.

You can consider a short trade when the price breaks below the neckline, with an SL halfway between the first top and the neckline.

Double Bottom Pattern

A Double bottom pattern forms when the price reaches a low, rebounds, and then declines again to the first low level. The neckline for a double bottom is the horizontal line that touches the minor high between the two troughs.

You can consider a long trade when the price breaks above the neckline, with an SL halfway between the first bottom and the neckline.

4. Head and Shoulder Patterns

head and shoulders pattern

Head and shoulders patterns are reversal patterns and consist of three segments:

  • Left Shoulder
  • Head
  • Right Shoulder

The neckline in this pattern is formed by connecting the beginning of the left shoulder and the end of the right shoulder. It can slope up, down, or be horizontal.

Head and Shoulders Pattern

The Head and Shoulders pattern is a reversal pattern preceded by an uptrend. It is named so because it resembles a human head and shoulders, as the head is at the centre, and the shoulders are at either side.

Volume during the first advance in the left shoulder should ideally be higher than the advance in the head, showing reduced confidence in the bulls. The volume should increase during the fall from the top of the head. Additionally, there should be an increase in volume during the decline from the peak of the right shoulder, indicating a bearish sentiment.

Once the pattern has formed, the market anticipates the price to fall below the neckline.

You can consider a short trade when the price breaks below the neckline with an SL halfway between the top of the right shoulder and the neckline.

Inverse Head and Shoulders Pattern

An inverse head and shoulders pattern is the bullish version of the head and shoulders pattern. It is an upside-down head and shoulders pattern, preceded by a downtrend, and signals a possible reversal.

You can consider a long trade when the price breaks above the neckline with an SL halfway between the bottom of the right shoulder and the neckline.

5. Flag Continuation Pattern

flag continuation pattern

A flag continuation or a pennant pattern is formed by downward-slopping parallel trendlines. It is typically a short-term pattern. The market expects the price to continue the trend that it was before the pattern formation.

You can consider a long trade when the price breaks above the resistance line with an SL at the centre of the parallel channel.

6. Cup and Handle Pattern

cup and handle pattern

A cup and handle pattern resembles a cup and its handle. The price is bullish and creates a high, falls, recovers slowly over time, and climbs back up to the previously created high.

Then the price forms a small down-sloped rectangular pattern, breaks out of it, and finally breaks out of the previous high.

You can consider a long trade when the price breaks out of the high made after the pattern forms.

Pro Tips for Chart Pattern Analysis

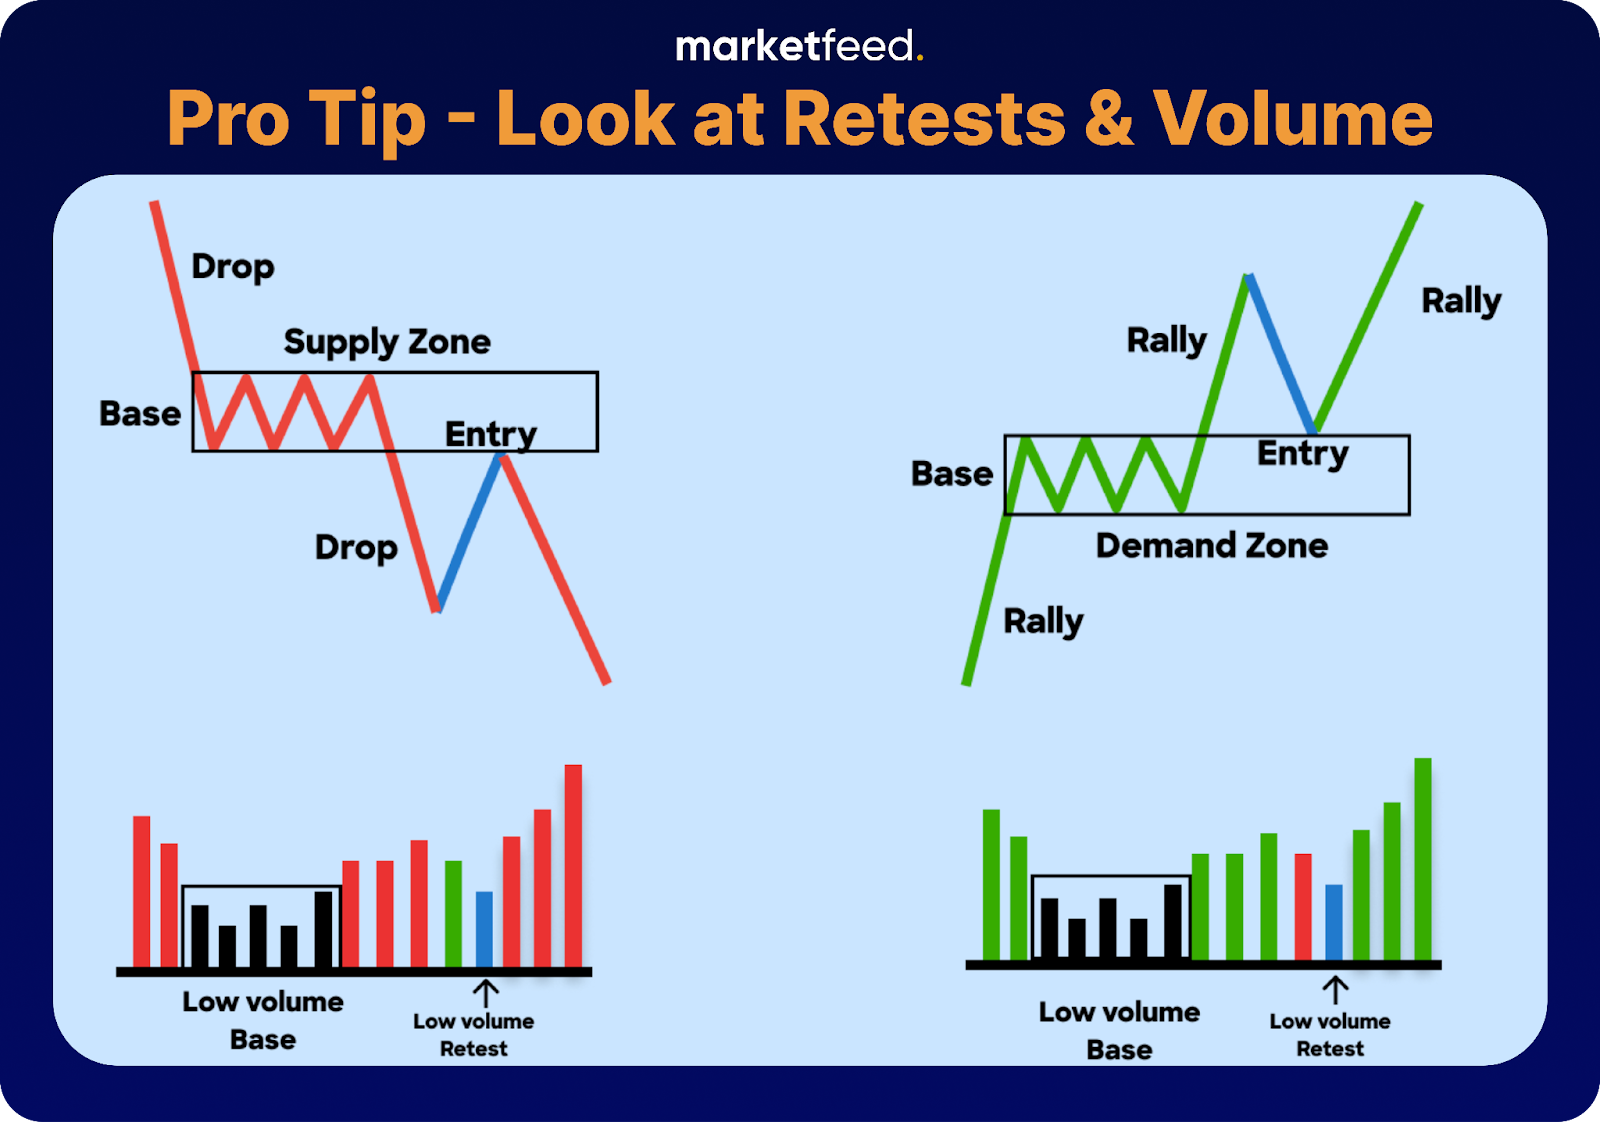
retests and volume
  • Pattern-based trading can yield better results when you combine volume analysis with retests of supports and resistances.
  • In the above bearish rectangle pattern, the volume during the consolidation is comparatively low. But it increases when the price breaks down from the lower support.
  • Most of the time, the price retests the broken support or resistance. It means that the price returns to the breakout/breakout levels.
  • The volume when the price returns for a retest should be low.
  • If the retest fails, the price moves in the direction of the breakout/breakdown with an even higher volume.
  • Traders often prefer to wait for the retest to be completed before entering a trade, as it helps decrease the probability of stop-loss (SL) being triggered by false breakouts or breakdowns.

Practical Application in Trading

  • Chart patterns can form in any timeframes. However, patterns formed over a higher timeframe tend to be stronger than in lower timeframes.
  • Before entering a trade, you should always confirm the volume during breakouts or breakdowns.
  • Technical analysis is a subjective process. Therefore chart patterns won’t always be textbook accurate. It depends on how the trader interprets the information.
  • Understanding the underlying sentiment and psychology is crucial as you gain deeper insights beyond theoretical knowledge.

These patterns are used daily by traders to find high-probability setups for trading. Practice is a must to identify patterns accurately and quickly. As an assignment, go through different charts and try to identify various patterns. Once you practice enough, you will be ready for action!

Also read: What are Candlestick Charts & How to Read Them?

Disclaimer: The information provided in this article is purely for educational purposes. Do your own research before using your hard-earned money to trade in the stock market.

Categories
Jargons

Which are the Best Index Funds to Invest in India?

Index funds have gained popularity in the world of investing, offering a simple and effective way for individuals to participate in the stock market. There are funds that invest in a broader market index like Sensex or Nifty. Index funds replicate the risk and return of the market. In this article, explore some of the best index funds to invest in India.

Index funds are those which are not actively but passively managed by the portfolio managers. If an investor invests in an index fund, the maximum return he can receive is the market return. This return is lesser than the market return because of additional costs involved in investing.

How do Index Funds Work?

Consider an index fund that follows the NSE’s Nifty Index. There will be 50 stocks in this fund’s portfolio, all of which will be distributed in the same way. The index fund makes sure to invest in each and every security that the index monitors.

A passively managed index fund attempts to replicate the returns the underlying index provides, whereas an actively managed mutual fund strives to surpass its underlying benchmark. The low expense ratio of an index fund is one of its main unique selling points (USPs). The expense ratio is a small portion of the fund’s total assets that the fund house charges for fund management services.

How are Index Funds Different from ETFs?

An exchange-traded fund (ETF) may be traded (bought and sold) easily in the stock market, while index funds can only be traded at the set price point at the end of the trading day. Since ETFs trade like shares of stock on exchanges, they may be easier for retail investors to access and trade. Furthermore, they often charge lower fees and are more tax efficient. 

What are the Pros and Cons of Index Funds? 

ProsCons
Easy diversification Cannot outperform the market
Little research/knowledge necessaryLower potential returns
Reduced risk compared to actively managed fundsLittle protection from the downside (particularly during bear markets)
Lower costs compared to actively managed fundsNo control over fund composition

Which are the Best Index Funds to Invest in India?

S. No.Index Funds3-Year CAGR
1Motilal Oswal Nifty Bank Index Fund Direct-Growth25.94%
2UTI Nifty Next 50 Index Fund Direct-Growth28.64%
3Nippon India Index S&P BSE Fund Sensex Plan -Direct Plan – Growth Plan23.08%
4Motilal Oswal Nifty Smallcap 250 Index Fund Direct-Growth36.51%
5UTI Nifty Next 50 Index Fund Direct Growth19.42%
(Returns as of July 13, 2023. Past performance is no guarantee of future results)

1. Motilal Oswal Nifty Bank Index Fund Direct-Growth

  • Motilal Oswal Nifty Bank Index Fund Direct Growth has outperformed all other funds in its category during the past three years. It gave CAGR returns of 25.94% over the last 3 years. 
  • The index fund has assets under management (AUM) of ₹403 crores. AUM refers to the current market value of the funds that the mutual fund is managing. 
  • The expense ratio for Motilal Oswal Nifty Bank Index Fund Direct Growth is comparatively low at 0.33%
  • This index fund saw a 23.7% increase in AUM during the past three months, going from ₹326.48 crore to ₹403.77 crore.

2. DSP Nifty 50 Equal Weight Index Fund Direct Growth

  • DSP Nifty 50 Equal Weight Index Fund Direct Growth has given a CAGR of 28.64% in the last three years. 
  • It has a low expense ratio of 0.4%.
  • This is an equity index fund with NIFTY 50 Equal Weight TRI as its benchmark. So an equal amount of your money is invested in the stocks of each company that makes up the index.
  • Over the last 1 month, DSP Nifty 50 Equal Weight Index Fund Direct Growth has experienced a 15.2% growth in AUM, moving from Rs 500.1 crore to Rs 576.19 crore.

3. Nippon India Index Fund S&P BSE Sensex Plan Direct Growth

  • Nippon India Index Fund S&P BSE Sensex Plan Direct Growth has given a CAGR of 23.08% over the last three years. 
  • It has one of the lowest expense ratios in the category (index funds) at 0.15%.
  • Nippon India Index S&P BSE Fund Sensex Plan – Direct Plan – Growth Plan saw a 22.1% increase in AUM during the past three months, going from ₹367.4 crore to ₹448.45 crore.

4. Motilal Oswal Nifty Smallcap 250 Index Fund Direct-Growth

  • In the last 3 years, Motilal Oswal Nifty Smallcap 250 Index Fund Direct Growth has outperformed all funds in its category giving a CAGR of 36.51%. 
  • The expense ratio for this index fund stands at 0.36%.
  • Motilal Oswal Nifty Smallcap 250 Index Fund Direct Growth saw a 7% increase in AUM during the past month, going from ₹315.36 crore to ₹337.35 crore.

5. UTI Nifty Next 50 Index Fund Direct Growth

  • The UTI Nifty Next 50 Index Fund Direct Growth has given a CAGR of 19.42% over the last 3 years. 
  • The expense ratio for this index fund is 0.33%.
  • Over the last 3 months, UTI Nifty Next 50 Index Fund Direct Growth has experienced a 17.8% growth in AUM moving from ₹1,920 crore to ₹2,260 crore.  

Which are the Sector-Specific Index Funds in India? 

The objective of sector-based funds is to make investments in companies operating in the same sector or industry. For instance, there are index funds for the banking, IT, pharma, infrastructure, and consumer goods sectors. Typically, these sectoral funds serve broader categories. However, there are index funds with considerably more narrow and specific goals. A PSU bank-only or a private bank-only index fund is an option for investors, whereas a banking sector index fund is focused on the larger banking category.

A few good examples of best sector-specific index funds to invest in would include Aditya Birla Sun Life Banking ETF, ICICI Prudential Bank ETF, Axis Banking ETF in the banking sector, Axis Healthcare ETF, ICICI Prudential Healthcare ETF in the pharma sector, and Kotak IT ETF, SBI-ETF IT in the technology sector.

Benefits of Sector-Specific Investments

  • Targeted Exposure: Investing in specific sectors allows you to focus on industries you believe will perform well, potentially leading to higher returns.
  • Expertise and Knowledge: Utilize your understanding of a particular sector to make informed investment decisions and spot opportunities others may miss.
  • Diversification within a theme: Investing in sectors related to a specific trend or theme (like renewable energy) allows you to diversify while capitalizing on growth in that area.

Risks of Sector-Specific Investments

  • Concentrated Risk: Putting all your investments in one sector increases vulnerability to industry-specific challenges or downturns, potentially resulting in significant losses.
  • Volatility: Sector-specific investments tend to be more volatile and sensitive to sector-specific factors.
  • Limited Diversification: Overemphasizing a single sector may leave you exposed to risks and missed opportunities from other industries.
  • Regulatory and Legislative Risks: Changes in regulations or laws specific to a sector can impact its performance and profitability.

Should You Choose an Index Fund?

Since Index Funds track a market index, their returns closely resemble those of the index. As a result, these funds are preferred by investors who desire consistent returns and wish to engage in the equity markets without taking on too many risks. In an actively managed fund, the portfolio’s composition is altered depending on the fund manager’s prediction of the potential performance of the underlying securities. This increases the portfolio’s level of risk. Such risks are eliminated by the passive management of index funds. The returns will not, however, be significantly higher than those provided by the index. The best choice for investors looking for greater returns is actively managed equity funds.

Disclaimer: The index funds mentioned in the article are solely for educational purposes. Please do your own research before investing.

Categories
Jargons

Which are the Best Mutual Funds in India?

A mutual fund pools money (investments) from individuals and institutional investors who have a common investment objective. This pooled sum of money is managed by a fund manager who invests in various securities or asset classes (stocks, debt instruments, etc) to generate returns for investors. Mutual funds offer professional money management, transparency, and liquidity. 

By determining a scheme’s Net Asset Value (NAV), the income or profits from this collective investment are split proportionately among investors after taking into account any applicable costs and taxes. NAV is the price of each unit of a mutual fund. It is the weighted average value of the stocks or other assets in the scheme/portfolio. The performance of the securities that the mutual fund invests in determines the value of the fund.

What are the Different Types of Mutual Funds?

1. Equity Mutual Funds

Equity mutual funds generate returns by investing in stocks of publicly listed companies across market capitalisation (small-cap, mid-cap, and large-cap). They are typically known to generate better returns than fixed deposits or debt-based funds. Equity mutual funds can be based on a particular theme such as emerging markets, dividend yield, energy funds, tax-saving, etc. It can also be based on different sectors such as financial services, automobiles, and fast-moving consumer goods (FMCG). The profits and losses generated from EMFs depend solely on the performance of the shares included in them.

2. Debt Mutual Funds

Debt mutual funds invest in fixed-income securities such as corporate bonds, treasury bills, commercial papers, and government securities. Such debt instruments have a pre-determined maturity date and interest rate that the buyer can earn at the time of maturity. It can be a preferred choice for passive investors that have a low-risk appetite.

3. Liquid Funds

These funds invest in short-term fixed-income instruments with a maturity of up to 91 days. Liquid funds carry the lowest interest-rate risk in the debt funds category.

4. Index Funds

An index mutual fund invests in a portfolio of stocks that track or imitate stock market indices such as the NSE NIFTY and BSE Sensex. They are passively managed funds that have exposure to securities present in the underlying index in the same proportion. It aims to match the returns offered by the underlying index. 

5. Balanced Funds

Balanced Funds (also known as hybrid funds) are financial instruments that invest in a mix of both equity and debt segments in specific ratios. Fund managers keep changing the allocation/ratio based on market risks. These funds often provide the best risk-reward balance and help to maximise the return on investment (RoI).

6. Fund of Funds

Fund of funds (FoFs) is a type of mutual fund that utilises the money pooled from its clients to invest in various other types of mutual funds available in the market. Thus, the returns of a FoF depend on the performance of the target fund.

7. Tax Saving Funds (ELSS)

An Equity-Linked Savings Scheme (ELSS) is a category of mutual fund that helps in saving taxes. It provides the dual advantage of wealth creation and tax saving under Section 80C of the Income Tax Act. By investing in ELSS mutual funds, you can claim a tax exemption of up to Rs 1.50 lakh from your annual taxable income.

Things to Consider Before Investing in Mutual Funds

Your Investment Objective 

Investments in mutual funds can be classified as either long-term (>5 years) or short-term (<5 years). If you plan to invest for the long term, look for funds that invest in stocks and debt instruments with potentially higher returns. However, such funds come with higher risks. If you plan to invest for the short term, seek out investments with smaller returns, minimal risk, and those that have shown consistent growth over time.

Fund Performance 

The aim of the mutual fund should be to outperform the market. So it’s crucial to assess the fund’s performance over the past few years before making an investment decision. Ideally, a five-year period of data would provide a reliable evaluation.

Fund Manager Experience 

The longer a fund manager has had effective fund management, the better. They have more experience dealing with crises like downturns in markets.

Expense Ratio

The amount used to cover the salary of the fund manager, advertising charges, and other costs related to managing a fund is known as the expense ratio. This figure should ideally be less than 1%. However, if the expense ratio is more than 1%, it means that the fund has been consistently earning good returns.

Which are the Best Mutual Funds to Invest in 2023?

S. NoMutual Funds 5-Year CAGR
1Axis Bluechip Fund Direct-Growth 12.24%
2Quant Small Cap Fund Direct Plan-Growth27.46%
3Parag Parikh Flexi Cap Fund Direct-Growth19.08%
4SBI Equity Hybrid Fund Direct Plan-Growth12.42%
5HDFC Mid-Cap Opportunities Direct Plan-Growth17.65%
(Figures as of July 10, 2023)

Axis Bluechip Fund Direct-Growth 

  • Axis Bluechip Fund Direct-Growth has 89.56% investment in domestic equities, of which 74.09% is in large-cap stocks and 3.4% is in mid-cap stocks. 
  • The fund has a 0.97% investment in government securities. 
  • The mutual fund has Assets under Management (AUM) of close to ₹33,500 crores. 
  • Since its launch in 2013, it has delivered an average annual returns of 14.6%. Axis Bluechip Fund Direct-Growth has given a CAGR of 12.24% in the last 5 years. 
  • The fund has an expense ratio of 0.62%, which is less than what most other large-cap funds charge. 

Investors who wish to invest in this mutual fund should also be prepared for the risk of experiencing moderate losses on their investments over time. This fund is appropriate for investors seeking substantial returns over at least a span of 3-4 years.

Quant Small Cap Fund Direct Plan-Growth

Quant Small Cap Fund Direct Plan-Growth is a small-cap mutual fund scheme from Quant Mutual Fund.

  • It is a medium-sized fund in its category with an AUM of ₹4,688 crores. 
  • The fund’s expense ratio is 0.62%, which is lower than that of the majority of other small-cap funds.
  • Since its launch in 2013, it has delivered 16.64% average annual returns. This mutual fund has been able to give a CAGR of 27.46% over the past 5 years. 

The scheme’s ability to deliver returns consistently is higher than most funds of its category. Its ability to control losses in a falling market is below average. The fund has the majority of its money invested in the Financial, Energy, Services, Consumer Staples, Metals & Mining sectors. It has taken less exposure in the Financial, Energy sectors compared to other funds in the category.

Parag Parikh Flexi Cap Fund Direct-Growth

Parag Parikh Flexi Cap Fund Direct-Growth is a flexi-cap mutual fund product from PPFAS Mutual Fund. It is a medium-sized fund in its category.

  • It has ₹35,965 crore in AUM. 
  • The fund’s expense ratio of 0.71% is comparable to that of the majority of other Flexi Cap funds. 
  • Since its launch in 2013, it has delivered 19.24% average annual returns and a 5 Year CAGR of 19.08%.

Parag Parikh Flexi Cap Fund Direct-Growth scheme’s ability to deliver returns consistently is in-line with most funds of its category. It has an average capacity to limit losses in a declining market. The financial, services, technology, consumer staples, and energy sectors are where the majority of the fund’s capital is invested. 

SBI Equity Hybrid Fund Direct Plan-Growth

SBI Equity Hybrid Fund Direct Plan-Growth is an aggressive hybrid mutual fund scheme from SBI Mutual Fund. It is a medium-sized fund in its category. 

  • It has an AUM of ₹57,161 crore. 
  • The fund’s expense ratio of 0.8% is comparable to that of the majority of other aggressive hybrid funds. 
  • At the moment, the fund is allocated 79.12% to equities and 18.96% to debt.
  • Since its launch, it has delivered 14.44% average annual returns and has a 5-Year CAGR of 12.42%.

The SBI Equity Hybrid Fund Direct Plan-Growth plan has a consistency of return that is comparable to the majority of funds in its class. It has an average capacity to limit losses in a declining market. Investments in the financial, healthcare, services, automotive, and communication industries make up the majority of the fund’s stock holdings. The debt portion of the fund has low credit quality indicating the quality of borrowers it has lent it to is not too great.

HDFC Mid-Cap Opportunities Direct Plan-Growth

HDFC Mid-Cap Opportunities Direct Plan-Growth is a Mid-Cap mutual fund scheme from HDFC Mutual Fund.  

  • It is a medium-sized fund in its category and has an AUM of ₹39,296 crores. 
  • The fund’s expense ratio is greater than what the majority of other mid-cap funds charge at 0.91%. 
  • It has generated returns of 20.05% on average year since its inception in 2013. It has given a CAGR of 17.65% in the last five years. 

The scheme’s ability to consistently provide returns is comparable to that of the majority of funds in its class. It performs better than average at limiting losses in a declining market. The financial, capital goods, services, healthcare, and automobile industries are where the fund has the majority of its investments. 

Conclusion 

Over the past ten years, mutual funds have been a profitable investment choice for Indian investors. They provide an easy and affordable option to diversify your portfolio and increase your wealth while lowering risk. 

However, do keep in mind that mutual fund investing entails risks such as market volatility,  potential loss of principal, and lack of control over individual holdings. Future outcomes cannot be predicted based on past performance. Investors should carefully consider their risk tolerance and objectives before investing.

Disclaimer: The mutual funds mentioned in the article are solely for educational purposes. Please do your own research before investing.
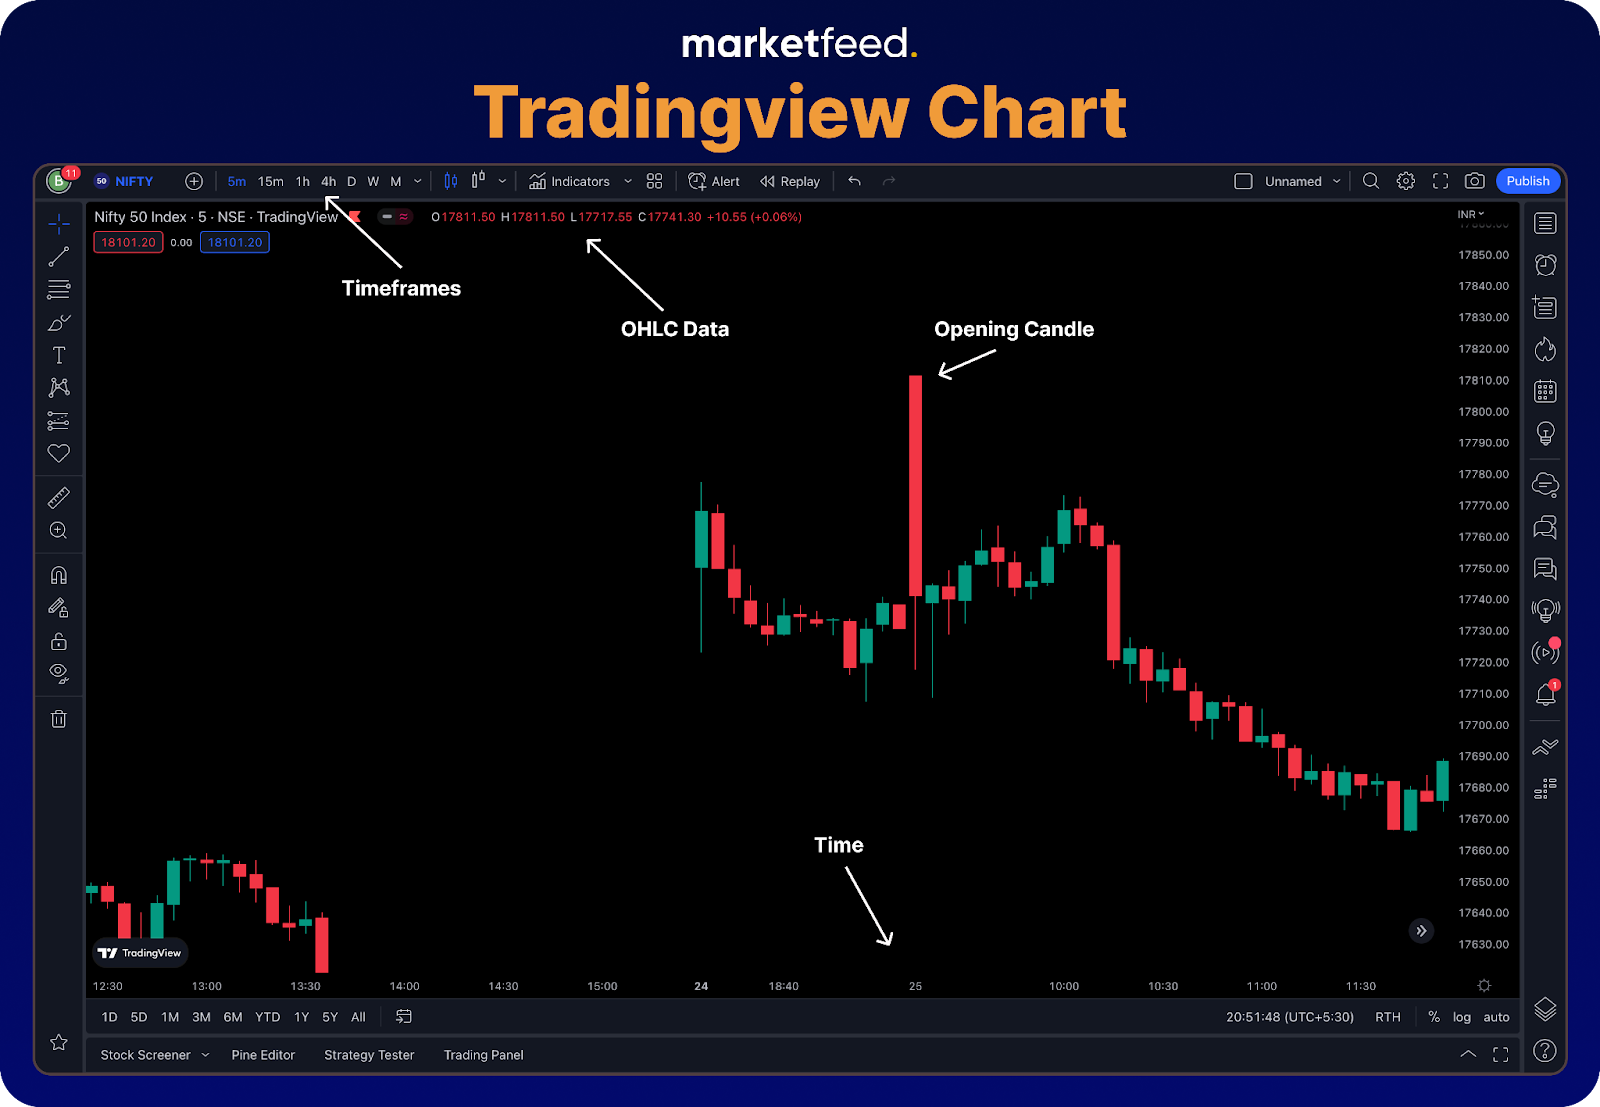
Categories
Jargons

How to Open Demat & Trading Account? Step-by-Step Tutorial in Zerodha

If you’re considering starting your trading journey and joining the investing world, having a trading and Demat account is essential. Zerodha, India’s leading discount brokerage firm, provides a seamless and user-friendly platform for investors to trade in the stock market. Opening a trading and Demat account with Zerodha is a straightforward process that can be done online. This article provides a clear, step-by-step guide on how to open a trading and Demat account with Zerodha.

How Many Demat & Trading Accounts Should You Have?

Having multiple Demat and Trading Accounts is common among successful traders and investors. You can effectively implement different strategies without confusion or mix-up if you have multiple accounts. You can also use different accounts for alternate investment portfolios. One account could be used for trading and another for investing. It’s entirely up to you.
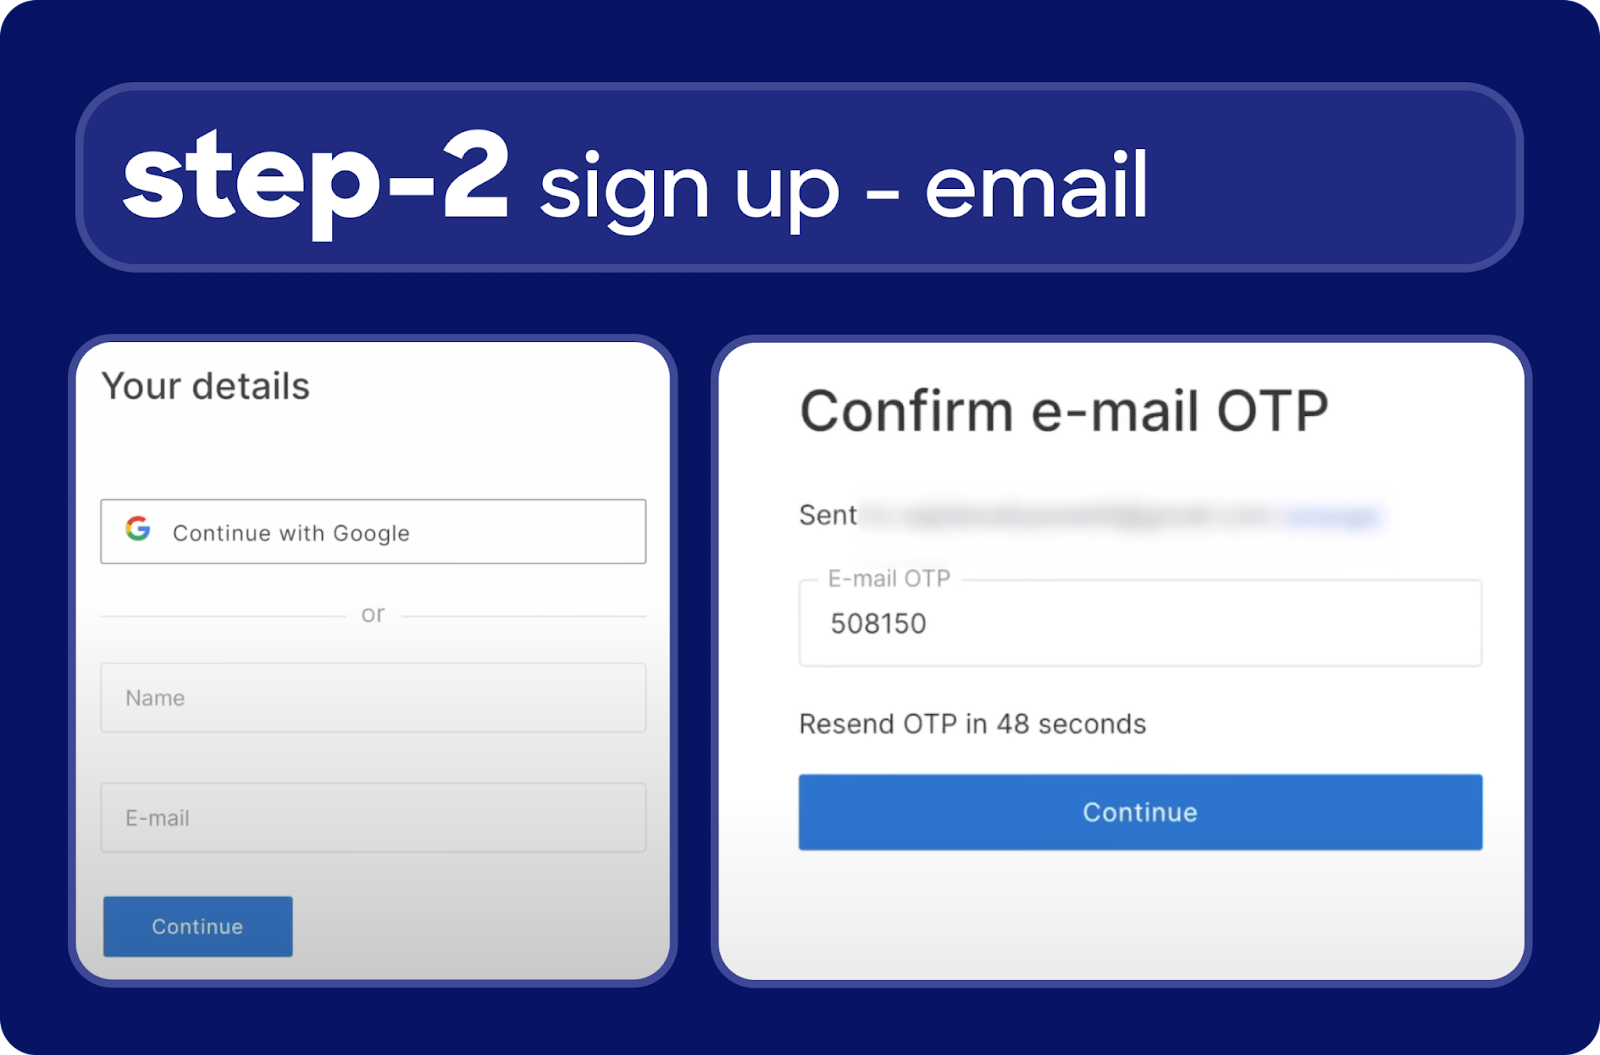
Documents Required for Opening a Demat Account:

Following are the documents required to open a Demat and trading account. Make sure you keep all these documents ready to make the account opening process smoother.

1. Self-attested copy of PAN with the signature under the applicant signature column.

2. Aadhar

3. An Aadhar-linked mobile number (mandatory to receive an OTP and ensign the account opening form)

4. Proof of bank account in your name (account statement with personal details)

5. A scanned copy of your signature (The signature must be with ballpoint or ink pens. Markers or sketch pens are not allowed)

6. Income proof

Click on the links to open a Demat and trading account with Zerodha, Upstox, and Fyers.

The link will take you to the account opening page.

Step-by-Step Tutorial to Open Demat & Trading Account in Zerodha

Step 1: Sign Up – Mobile Number

Enter the mobile number linked with your Aadhar and verify with OTP

Step 2: Sign up – Email

Enter your email address and verify with e-mail OTP.

Step 3: PAN Card & Date of Birth

Enter your Permanent Account Number (PAN) and Date of Birth (DoB), and click Continue.

Step 4: Pay the Account Opening Fee

Enable the segments that you want to trade in. We suggest you enable all the segments and open a full-fledged account with Zerodha.

Pay the account opening fee using UPI or other methods.

Step 5: Aadhar KYC

Complete Aadhar KYC by providing Zerodha access with your Aadhar details from Digilocker. Zerodha uses this to complete KYC and will not get access to your personal data. Enter your Aadhar number, verify with OTP, and click on Allow to complete the KYC process.

Step 6: Personal Details

Enter your personal details and complete your profile data. Set funds and securities settlement preference as ‘Once every calendar quarter’ and trading experience as relevant.

Step 7: Link Bank Account

Link your bank account to your Demat & Trading account using IFSC and account details. Alternatively, you can UPI-ID to link your bank account. Agree to all the terms and conditions and click continue.

Step 8: Webcam Verification (IPV)

Zerodha performs this process for user verification. Write the number displayed on the screen on clean white paper. Then hold it in front of you as shown in the image while facing the webcam. Once you finish this process, the verification will be complete.

Step 9: Upload Documents

Upload the requested documents (income statement, signature, etc.) and click continue.

Step 10: E-sign the Application Form

The application process will be complete upon signing the application. Click on the e-sign button, enter Aadhar details, and verify. Review the application for errors and click on ‘Sign Now.’ It will redirect you to another page, which will be automatically closed upon completion. Click on Finish, and voila, you’re all set!

It may take up to 72 hours for the application to be verified. After verification, you will receive your login credentials via e-mail.

Kite is Zerodha’s trading platform. You can access it via a web browser or mobile app, available for download on both the App Store and Play Store.

How to Open an Account with Other Brokers?

The procedure for opening a Demat and trading account with other stock brokers in India is very similar to that mentioned above.