Ever wondered why so many traders are drawn to gold and silver trading? Well, it’s not just about the shine! These precious metals are incredibly popular in the commodity market, thanks to their high liquidity and the big players (like jewellers and institutions) who actively trade them. In this article, we dive into everything you need to know about trading gold, silver, and bullion in the Multi Commodity Exchange of India (MCX).
How to Start Trading Gold and Silver?
One of the advantages of commodity trading is the ability to trade after regular market hours, from 5 PM to 11:30 PM in the Indian market. You can start trading through regulated brokers such as:
Zerodha
Upstox
Fyers
IIFL Securities
These established brokers provide reliable platforms for MCX trading and ensure proper regulatory compliance. When selecting contracts through your broker’s terminal, always choose MCX contracts over NSE ones due to higher liquidity in the MCX segment.
Understanding Gold Trading in MCX
Gold trading in MCX is exclusively done through derivatives contracts – either futures or options. There are four different categories of gold contracts available:
1. Gold (Main Contract): Trading unit of 1 kg 2. Gold Mini: Trading unit of 100 grams 3. Gold Guinea: Trading unit of 8 grams 4. Gold Petal: Trading unit of 1 gram
Each of these categories is tailored for different types of traders based on the trading unit, margin requirements, and liquidity. Let’s explore them in detail.
Capital Requirements for Gold Trading
Each category requires different margin amounts:
Gold (Main): Approximately ₹8 lakhs per lot
Gold Mini: Around ₹79,000 per lot
Gold Guinea: About ₹6,436 per lot
Gold Petal: Less than ₹800 per lot
While gold mini and gold futures dominate in terms of liquidity, gold guinea and gold petal contracts often experience low participation. If you’re a beginner, you could focus on gold mini contracts for better price action and stability.
Understanding Silver Trading in MCX
Similar to gold, silver trading in MCX is available through derivatives contracts with three categories:
1. Silver (Main): Trading unit of 30 kg 2. Silver Mini: Trading unit of 5 kg 3. Silver Micro: Trading unit of 1 kg
Capital Requirements for Silver Trading
The margin requirements vary significantly across categories:
Silver Main: Approximately ₹5.27 lakhs
Silver Mini: Around ₹87,000
Silver Micro: About ₹17,000
Unlike gold’s smaller contracts, Silver Micro maintains decent liquidity, making it a viable option for traders with smaller capital.
Understanding Bullion Index
The MCX Bullion Index (BULLDEX) combines gold and silver futures contracts in a ratio of 63.7% gold to 36.3% silver. While this might seem like an interesting trading instrument, it’s important to note that BULLDEX suffers from extremely low liquidity and is not recommended for active trading.
Price Impact and PnL Calculations
Understanding price impact on profit and loss (PnL) is crucial:
For Gold:
Main Contract: ₹100 PnL per ₹1 price movement
Gold Mini: ₹10 PnL per ₹1 price movement
For Silver:
Main Contract: ₹30 PnL per ₹1 price movement
Silver Mini: ₹5 PnL per ₹1 price movement
Silver Micro: ₹1 PnL per ₹1 price movement
Key Factors Affecting Gold and Silver Prices
Several factors influence precious metal prices:
1. Global Economic Conditions: Gold typically performs well during economic uncertainty as a safe-haven asset
2. Interest Rates and Inflation: Higher inflation often drives increased demand for gold
4. Geopolitical Events: Global uncertainty tends to boost gold prices
5. Supply and Demand Dynamics: Particularly important for silver, given its industrial applications
The Gold-to-Silver Ratio Trading Strategy
The gold-to-silver ratio is a valuable tool for positional trading. When the ratio exceeds 80, it suggests gold is overvalued relative to silver, indicating potential outperformance by silver in bullish markets. Conversely, a ratio below 60 suggests silver is overvalued, pointing to potential outperformance by gold.
Important Trading Considerations
1. Contract Expiry:
Gold and Silver main contracts expire on the 5th of every alternate month
Mini and micro contracts typically expire on the last trading day of the month
2. Risk Management:
Always use proper capital allocation
Never trade with 100% of available capital
Maintain reserves for potential drawdowns
3. Technical Analysis:
Price action and technical analysis work well in precious metals
Support and resistance levels are generally well-respected
Monitor global gold and silver ETF flows for additional insights
Trading precious metals can be profitable with proper understanding and risk management. Start with more liquid contracts like Gold Mini or Silver Mini, and always stay informed about global economic conditions affecting these markets.
Crude oil, often referred to as the “mother of all commodities,” plays a significant role in global trade. From powering vehicles to forming the raw material for plastics and pharmaceuticals, crude oil impacts nearly every aspect of our lives. In this article, we explore the fundamentals of crude oil trading in India! We dive into why it’s a compelling market, the capital required, and the critical data points that impact the pricing of crude oil.
Why Trade Crude Oil?
One of the most attractive features of crude oil trading is the extended trading hours, making it ideal for individuals who work during regular market hours (9:15 AM to 3:30 PM). With trading sessions running from 5:00 PM to 11:30 PM in India, crude oil offers flexibility for traders constrained by daytime work commitments.
Crude oil also exhibits high volatility, creating opportunities for directional trades. Its global significance ensures consistent demand and its pricing can act as an indicator for other commodities and even stocks.
Crude Oil Benchmarks
Crude oil prices are determined by various benchmarks based on origin and quality. The three major benchmarks are:
1. West Texas Intermediate (WTI): Sourced primarily from the United States, this is the most widely traded crude oil benchmark.
2. Brent Crude: Extracted from the North Sea region, this benchmark serves as a reference for European and global markets.
3. Dubai Crude: Predominantly produced in the GCC (Gulf Cooperation Council) countries, it represents the Middle Eastern oil market.
The primary difference between these benchmarks lies in their geographical origins and levels of impurities.
Tracking WTI Crude Oil
For traders, WTI crude oil’s price movement is a key indicator. On platforms like TradingView, WTI is labelled as “US Oil” and provides valuable insights for market analysis. Observing technical patterns on WTI charts can help traders forecast movements in domestic crude oil contracts listed on the Multi Commodity Exchange (MCX).
Understanding Crude Oil Trading on MCX
Indian traders primarily access crude oil through MCX, which offers two types of contracts:
1. Crude Oil (Standard): Contract size of 100 barrels.
2. Crude Oil Mini: Contract size of 10 barrels.
You can trade crude oil in India using any broker that offers access to MCX trading – Zerodha, Angel One, Upstox, etc.
The crude oil market on MCX is highly active, with daily trading volumes exceeding ₹3,000 crores, equivalent to approximately 8,500 barrels. Both institutional and retail traders participate, with institutions often hedging their exposure in the physical market.
WTI crude oil trades globally until 2:00 AM IST, while MCX closes at 11:30 PM (or 11:55 PM during daylight savings). This discrepancy can lead to price gaps and requires traders to account for after-market developments in global markets.
Capital Requirements for Trading Crude Oil
Crude Oil (Standard): Requires a margin of approximately ₹3.32 lakhs for one lot.
Crude Oil Mini: Requires a margin of around ₹33,340 for one lot.
For options traders, the required margin depends on the premium and lot size. Be cautious with options, as lower liquidity in the Indian market can lead to challenges in exiting trades, particularly if contracts are deep in-the-money.
Key Data Points to Monitor
Before diving into crude oil trading, closely monitor these factors:
1. Geopolitical News: Global events like conflicts or OPEC meetings can significantly impact oil prices.
2. Supply and Demand Data: Regular reports, such as the U.S. Energy Information Administration (EIA) inventories, influence short-term price movements.
3. Technical Indicators: Utilise tools like moving averages, trendlines, and support/resistance levels to forecast price patterns.
4. Currency Fluctuations: USD/INR movements can amplify or dampen the effects of international crude oil price changes.
Trading Strategies for Crude Oil
1. Futures Trading: Ideal for capturing directional moves in the market. However, ensure you understand margin requirements and risk management.
2. Options Trading: Provides flexibility but requires caution due to liquidity constraints in the Indian market.
3. Correlation Trades: Use crude oil trends to influence trades in related stocks or sectors, such as energy or logistics.
4. Hedging: For advanced traders, crude oil can serve as a hedging instrument against exposure to other assets.
Practical Tips for Beginners
Start Small: Begin with Crude Oil Mini contracts to limit risk.
Paper Trade: Use demo accounts to familiarise yourself with the market.
Stay Updated: Regularly monitor news and technical analysis platforms like TradingView.
Avoid Holding Positions Overnight: Gaps between global and domestic market hours can lead to unexpected losses.
Hedge Your Bets: Always consider strategies to minimise risk, especially in volatile markets.
Conclusion
Trading crude oil could be rewarding for disciplined and informed traders. Its global significance, high volatility, and accessibility on platforms like MCX make it a preferred choice for many. By understanding benchmarks, monitoring essential data points, and employing sound strategies, you can navigate the complexities of crude oil trading with confidence.
Embark on your journey into crude oil trading today and harness its potential for growth. Remember, informed decisions and consistent learning are key to success in this dynamic market.
Disclaimer: Trading in commodities, including crude oil, involves risk and may not be suitable for all investors/traders. The information provided in this guide is for educational purposes only and should not be considered as financial, investment, or trading advice.
Volume is one of the most critical elements when analysing a stock’s price chart. Traditionally, traders analyse volume with respect to time. However, what if you could analyse volume with respect to price instead? This perspective unlocks a new layer of understanding in trading. Enter the Volume Profile—a versatile tool that gives traders insights into price levels with significant trading activity. In this article, we dive deep into understanding, using, and applying volume profile in trading.
What Is Volume Profile?
Volume Profile is a charting tool that plots trading volume against price rather than time. By doing so, traders can identify crucial price levels where significant activity has occurred. These levels often serve as strong support and resistance zones. Unlike traditional volume indicators, Volume Profile highlights areas of high liquidity where the price tends to gravitate and zones of low liquidity where the price can move rapidly.
Let’s Look at an Example:
Consider Raju, an onion wholesaler. Raju deals with highly volatile onion prices daily. He wants to know at what prices he sells the maximum and minimum quantities. By visualising onion prices and quantities sold on a chart, he discovers the most significant price levels. Similarly, traders can use Volume Profile to identify the most traded price levels for a stock, helping them understand key support and resistance zones.
Key Components of Volume Profile
1. Point of Control (POC): The price level where the highest volume of trades occurred. This level often acts as a pivot point for price action.
2. High-Volume Zones: Zones with significant trading activity. These areas create a “gravitational pull,” slowing down price movement.
3. Low-Volume Zones: Zones with minimal trading activity. Prices can move quickly through these areas due to low liquidity.
4. Fair Value: The range where 70% of all trades occur. Prices often oscillate within this range, creating a balance zone.
Volume Profile provides actionable insights by uncovering patterns hidden within price and volume data. Next, let’s discuss how traders can interpret various scenarios.
Candlestick Analysis with Volume Profile
1. Bullish Candle: If the price closes above the fair value zone, the candle is bullish. Buyers demonstrate strength by breaking out of high-liquidity areas, suggesting upward momentum. For example, if a green candle closes above its POC, the POC may act as a strong support level in subsequent sessions.
2. Bearish Candle: A red candle closing below the fair value zone indicates bearish sentiment. Sellers overpower buyers, pulling the price down. In this case, the fair value acts as a resistance zone.
3. Neutral Candle: When the price closes near the fair value, the candlestick is neutral, signalling indecision. Analysing multiple candles in such cases is essential to identify the prevailing trend.
4. Trend Reversal Candles: In some cases, the price moves strongly during the day but gets trapped in the fair value zone by the close. For instance:
(i) Bullish to Neutral Reversal: Price rises quickly in a low-liquidity zone but closes in the fair value range. (ii) Bearish to Neutral Reversal: Price falls rapidly through low liquidity but closes in the fair value range.
These scenarios indicate potential reversals for the next trading session.
Intraday and Swing Trading with Volume Profile
Intraday Traders: Analysing the previous day’s Volume Profile helps anticipate trends for the next session. Key levels like POC and high-volume nodes provide critical zones for support and resistance.
Swing Traders: Longer-term trends can be identified by studying the Volume Profile over a week or month. Consolidation patterns and high-volume zones help traders understand upcoming support and resistance levels.
Step-by-Step Guide to Using Volume Profile
1. Open Your Charting Platform: On platforms like TradingView, navigate to the “Forecasting and Measurement Tools” section.
2. Select Fixed Range Volume Profile: This tool is ideal for analysing volume over two fixed price ranges.
3. Plot the Volume Profile: For instance, when analysing Cochin Shipyard stock, you can plot the day’s Volume Profile to identify key levels.
4. Adjust the Fair Value Range: By default, 70% of trades are highlighted. Reducing this to 35% narrows the focus, enabling better insights into key zones.
5. Analyse the Data: Use the plotted profile to identify the day’s fair value, POC, and high/low-volume zones.
Example: Suppose Cochin Shipyard’s stock forms a red daily candle and closes inside its fair value zone. This indicates a potential reversal, as sellers couldn’t sustain their momentum. The next day’s trend might see the price bounce upward from this fair value zone.
(Volume Profile in action in TradingView)
Why Volume Profile is Essential
1. Enhanced Market Understanding: By analysing volume at price levels, traders gain a clearer picture of market dynamics.
2. Improved Accuracy: The tool helps pinpoint high-probability support and resistance zones.
3. Combination with Other Tools: Volume Profile complements other technical analysis techniques, enhancing their effectiveness.
Conclusion
Mastering the Volume Profile can significantly improve your trading strategy. By understanding volume in relation to price rather than time, you unlock new dimensions of analysis. Whether you are an intraday trader or a swing trader, incorporating this tool into your arsenal will increase your trading success rate. So why wait? Start exploring Volume Profile today and take your trading skills to the next level!
Commodity trading is an exciting segment of financial markets that many traders in India are unaware of. While Indian equity markets operate from 9:15 a.m. to 3:30 p.m., the commodity market offers extended trading hours from 9:00 a.m. to 11:30 p.m., divided into two sessions. This is especially beneficial for working professionals who can trade after office hours. However, entering this market requires a clear understanding of its dynamics, benefits, and risks. In this article, we dive into everything you need to know about commodity trading in India.
What is Commodity Trading?
Commodity trading involves buying and selling commodities, such as natural resources or agricultural products, on exchanges. This can include energy sources like crude oil and natural gas, metals such as gold and silver, and agricultural products like wheat and cotton. The primary goal in commodity trading is to profit from fluctuations in the price of these commodities.
Why Does Commodity Trading Exist?
Unlike equity markets that exist for companies to raise funds, the commodity market primarily serves to allow businesses to hedge against price fluctuations. For example, consider a gold shop owner named Charlie. He holds 10 kg of gold, hoping to profit from making jewellery. If the price of gold falls significantly from ₹80,000 per 10g to ₹60,000, Charlie may incur losses that outweigh his profits from jewellery sales. But if the price of gold goes way up (say ₹1 lakh per 10g), he might earn more, but it will also cost him more to restock. Thus, commodity trading allows Charlie to hedge his risk by using futures contracts to balance potential losses or gains.
[A futures contract is an agreement to buy or sell something (like gold, oil, or stocks) at a fixed price on a future date. It helps buyers and sellers protect themselves from price changes—buyers lock in lower prices if they expect a rise, while sellers secure higher prices if they expect a drop.]
How to Get Started in Commodity Trading in India?
To begin trading commodities, you need to understand the basics, including the types of commodities available, how trading works, and the exchanges involved.
In India, there are two primary exchanges for commodity trading:
National Commodity & Derivatives Exchange Ltd (NCDEX): This platform primarily deals with agro-based commodities like wheat, spices, and cotton.
Multi Commodity Exchange (MCX): This is where non-agro commodities like gold, silver, zinc, and crude oil are traded.
Both exchanges are regulated and provide a safe environment for trading. It is crucial to avoid unregulated platforms or apps that do not adhere to SEBI guidelines!
All major brokers in India like Zerodha, Upstox, Fyers, etc. support commodities trading. You should activate the commodities segment separately in your broker/trading account.
Types of Contracts
Commodity trading mainly involves derivatives, specifically futures and options:
Futures Contracts: Agreements to buy or sell a commodity at a future date at a predetermined price.
Options Contracts: Rights to buy or sell a commodity at a specific price before a set date.
Unlike stocks, commodities can’t be held forever. Every futures or options contract has an expiry (settlement) date. As a thumb rule, never let your commodity trades enter into a settlement phase. It’s better to square off your positions at least 2-3 days before the settlement date.
Popular Commodities and Contracts
Some of the most actively traded commodities include:
Gold: Available in various contract sizes, including 1 kg, 100 g, and 8 g.
Silver: Typically traded in contracts of 30 kg or smaller sizes.
Crude Oil: A significant commodity often influenced by global market conditions.
Natural Gas: Another volatile commodity that attracts traders.
The capital needed to trade commodities depends on the type of commodity and the broker’s policies. Brokers often have specific margin requirements for commodities.
Commodity trading offers high leverage. For example, a gold mini contract worth ₹7.2 lakh may only require ₹72,000 as margin. Leverage amplifies both profits and losses, so it’s essential to have proper risk management strategies in place!
Commodity Indices in India
Similar to equity indices like Nifty50, commodity markets also offer indices for trading:
Bullion Index: Tracks gold and silver prices.
Metal Index: Tracks aluminium, copper, lead, zinc, and nickel prices.
Energy Index: Tracks crude oil and natural gas prices.
These indices allow traders to speculate on overall market movements rather than individual commodities.
Advantages of Commodity Trading
Commodity trading offers several benefits that can attract both individual and institutional traders:
High Liquidity: Many commodities, especially gold and crude oil, have high trading volumes. These markets tend to follow price action well.
People who are unable to trade during the daytime (office-goers) can use the opportunity to make potential extra income!
Less Price Manipulation: Commodities are traded globally, reducing the chances of price manipulation compared to more localised markets.
Hedging Opportunities: Businesses can hedge against price fluctuations to stabilise costs and revenues.
Disadvantages of Commodity Trading
While there are many advantages, there are also significant risks and drawbacks to consider:
High Price Volatility: Commodity prices can change rapidly due to geopolitical factors or supply and demand shifts, which may result in substantial losses for unprepared traders.
Leverage Risks: Trading with leverage can amplify losses. Commodity traders must understand how to manage leverage effectively.
Liquidity Issues: Not all contracts have the same level of liquidity, which can complicate trades and lead to slippage.
Geopolitical Sensitivity: Commodity markets are often the first to react to global events, requiring traders to stay informed about international affairs.
Conclusion
Commodity trading presents a unique opportunity for investors looking to diversify their portfolios and take advantage of market fluctuations. Also, profits from commodity trading are treated as business income (same as F&O). You’ll have to pay tax based on your tax slab.
Approach the commodities market only after a thorough understanding of the risks involved, the mechanics of trading, and the specific commodities you wish to trade. Always start small, educate yourself continuously, and consider consulting with financial advisors to navigate the commodities market effectively.
As you venture into commodity trading, remember to keep your capital allocation conservative, especially if you’re new to the field. With the right strategies and knowledge, you can successfully navigate the volatile waters of commodity trading and potentially achieve significant returns. Happy trading!
Imagine a value investing strategy that claims to have returned investors a 30% Compound Annual Growth Rate (CAGR) over 26 years. If you had invested ₹1 lakh into this strategy, it says you would have turned into over ₹9 crore! Sounds incredible, right? That’s the Magic Formula investment technique. In this article, we will dive deep into this investment strategy, exploring its origin, the nine key rules it follows, backtesting data, and its relevance in both the U.S. and Indian markets.
The Origins of the Magic Formula
Joel Greenblatt, a renowned asset manager since the 1980s, wrote a book titled The Little Book That Beats the Market, where he presented the magic formula for value investing. Greenblatt is a professional investment manager with an impressive $6.3 billion in Assets Under Management (AUM). His magic formula is said to be a simplified version of the value investing strategies used by legends like Warren Buffett and Charlie Munger.
In his book, Greenblatt outlines how investors can generate market-beating returns by following a set of simple rules. His confidence in the strategy led to a follow-up book, The Little Book That Still Beats the Market, further emphasising its relevance. The formula has been consistently applied for over two decades and claims to outperform traditional market benchmarks.
What is the Magic Formula?
The magic formula is a stock-picking strategy based on two financial metrics: earnings yield and return on capital (ROC). The strategy focuses on buying good companies at bargain prices, similar to Warren Buffett’s approach, but Greenblatt simplifies the process into an easy-to-follow method.
The key idea behind the formula is to select companies with a high earnings yield (indicating that the company is undervalued) and a high return on capital (showing that the company is efficiently using its capital to generate profits). These two metrics help identify companies that have strong earning potential and are available at a relatively cheap price.
Why Use the Magic Formula?
Greenblatt wanted to simplify stock picking to make it understandable even to a teenager. The book is written in simple language and provides a clear framework to follow, making value investing more accessible to beginners. As Greenblatt famously said, “Choosing individual stocks without any idea of what you’re looking for is like running through a dynamite factory with a burning match. You may live, but you’re still an idiot.”
In short, the magic formula provides a structured way to invest in the stock market, ensuring that investors are not making random picks but are following a tested and data-driven strategy.
The Nine Rules of the Magic Formula
Now that we have a basic understanding of the magic formula, let’s break down the nine rules that form the foundation of this strategy:
1. Market Cap Greater Than $50 Million
The formula requires that you only assess companies with a market cap greater than $50 million. In the Indian context, this translates to about ₹400 crore. However, we’ll focus on companies with a market cap of over ₹1,000 crore to account for inflation and currency depreciation.
2. Exclude Utility and Financial Stocks
Greenblatt’s strategy excludes utility and financial companies. Although he doesn’t provide a specific reason, it is likely because these industries tend to carry high debt levels, which may misrepresent/skew the financial metrics the formula relies on.
3. Avoid International Companies
The formula excludes international companies. Since there are very few foreign companies listed in our country, this rule is easily applicable in the Indian market.
4. Calculate Earnings Yield
Earnings yield can be calculated as earnings per share divided by the current share price, or using the formula EBITDA divided by enterprise value. The goal is to understand the company’s earnings capacity, essentially evaluating how well it is managing its profits relative to its price.
5. Calculate Return on Capital (ROC)
Return on capital measures the company’s profitability relative to the capital invested in the business. This metric reveals how efficiently the company is using its resources. Think of Coca-Cola, which can generate high profits with relatively low capital due to the brand’s long-standing moat. This rule is designed to simplify Buffett’s approach to analysing a company’s earnings potential.
6. Rank Companies Based on Earnings Yield and ROC
Once you’ve calculated the earnings yield and return on capital for each company, rank them accordingly. Companies with the highest combined earnings yield and ROC should be prioritised.
7. Invest in Top 20-30 Companies
After ranking the companies, invest in the top 20-30 based on their earnings yield and ROC. In the second edition of the book, Greenblatt introduced a small tweak: invest only in companies with a price-to-earnings (P/E) ratio greater than five. This helps to avoid low-quality or overly volatile stocks.
8. Rebalance Your Portfolio Annually
Greenblatt suggests rebalancing your portfolio once a year. He also introduces a useful tax-saving tip: sell loss-making stocks in the 51st week to account for short-term capital losses, which can be offset against other gains. Hold profitable investments for over 52 weeks to benefit from lower long-term capital gains taxes.
9. Stick to the Strategy for 5-10 Years
Finally, the magic formula requires patience. You need to stick to this strategy for at least five to ten years to see the compounding effect and generate significant returns. Short-term fluctuations in the market can cause temporary losses, but the long-term benefits are where the real value lies.
Backtesting the Magic Formula
Backtesting of the magic formula has shown positive results in different markets. Studies have consistently proven that the strategy outperforms the market over time, especially in non-bearish market conditions. Greenblatt’s own backtest of the U.S. market suggests that the formula has outperformed benchmarks like the S&P500 by a significant margin.
A study conducted in India in 2022 by professors from the University of Delhi revealed that the magic formula worked well in the Indian market. Over a period from July 2012 to 2020, the BSE Sensex gave returns of around 99.8%, while Greenblatt’s magic formula returned more than 1% CAGR during the same period.
This shows that the magic formula is not only relevant in the U.S. market but can also be applied successfully in India. With backtested data supporting its credibility, the magic formula stands as a proven, easy-to-implement value investing strategy.
How to Use the Magic Formula Screener in India?
To implement magic formula investing effectively, you can use online tools such as screener.in. This stock screener platform allows you to filter companies based on specific criteria aligned with the Magic Formula’s rules. Here’s how you can set up the screener:
1. Set a market capitalisation filter of greater than ₹1,000 crore. 2. Set a return on invested capital (ROIC) filter of greater than 25%.
After applying these filters, you’ll generate a list of potential quality companies to evaluate. The next step involves exporting this data into an Excel sheet for further analysis.
Once you have your list of companies, the next step is ranking them based on their ROIC and earnings yield. Use Excel’s rank function to assign ranks to each metric. After ranking, add up the ranks to derive a combined score that reflects both the earnings yield and ROIC. The companies with the lowest total rank are your best candidates for investment.
With your ranked list in hand, it’s essential to conduct a thorough analysis of each company. Look for any “shady” companies that might not align with the quality standards outlined in the Magic Formula. For instance, while a company may appear at the top of the list, further investigation might reveal potential red flags.
As emphasised in the rules, it’s crucial to rebalance your portfolio annually. This involves selling off underperforming stocks and maintaining a long-term investing outlook. Adhering to magic formula investing over a 5 to 10-year horizon can help mitigate short-term volatility and potentially yield higher risk-adjusted returns.
Disadvantages of the Magic Formula
While the Magic Formula presents a structured approach to systematic value investing, it’s not without its drawbacks:
Return Expectations: The promised 30% CAGR may not be replicable in the current market environment, particularly in India.
Complexity of Smaller Companies: Some smaller market cap companies may have less transparent financials, making them harder to analyse.
Market Conditions: The formula tends to outperform during bullish markets but may lag in bearish conditions.
Conclusion
Joel Greenblatt’s magic formula is a time-tested value investing strategy that simplifies stock picking for long-term investors. By focusing on high earnings yield and return on capital, the formula helps investors find good companies at reasonable prices. The nine rules of the formula make it easy to implement, even for beginners, and the strategy has been backtested successfully in both the U.S. and Indian markets.
If you’re looking for a simple yet effective stock-picking method, the magic formula could be a great starting point for your investment journey!
Disclaimer: We are not SEBI-Registered Investment Advisors. The investment strategy mentioned in this article is purely for educational purposes. Please do your own research before investing!
Automation is rapidly changing how we handle money and business today. Nowadays, computer programs or “algorithms” seamlessly execute multiple jobs that people used to do, making financial tasks faster and easier for everyone. Robo advisors are a prominent, new-age solution that can help you grow your wealth effortlessly. In this article, we discuss the world of robo advisors and their benefits (especially in the Indian context)!
What is a Robo Advisor?
A robo-advisor is a digital platform that offers automated, algorithm-driven financial planning and investing services without human supervision. A typical robo-advisor will conduct an online survey to inquire about your financial condition and future objectives. It uses this data to offer personalised investment plans based on risk tolerance, time horizon & financial goals and executes them automatically in your own account.
How Does a Robo-Advisor Work?
If you want to avail the services of a robo-advisor, you’ll need to complete a quick questionnaire. Usual questions include the client’s age, gender, income, investing goals, liabilities, current assets, and degree of risk tolerance. These data points are utilised to allocate assets in a portfolio.
Robo-advisors analyse these replies using an algorithm and complex software to build a diversified portfolio of exchange-traded funds, index funds, direct equity, and other assets.
The algorithm automatically rebalances the portfolio once the money is invested, to ensure it remains close to the target allocation.
Some robo-advisors include live consultations or access to a licensed human financial planner who can help you prioritise your goals and give strategies for reaching them. Users can log in to their investing accounts to track progress.
What are the Benefits of Robo Advisors?
There are various benefits that Robo Advisors offers:
1. Accessibility: Robo-advisors make investing easier for everyone, even those who might not have a lot of money or experience. Their sign-up and investment processes are much easier than the heavy paperwork involved with human advisors. You can start investing with a small amount and manage your portfolio from your phone or computer.
2. Low Cost: Robo-advisors often charge lower fees than traditional financial advisors. A majority of robo-advisors in the US charge between 0.25-0.5% of the specified investment amount as annual fees. (Robo-advisory platforms in India usually charge a flat monthly, quarterly or annual fee). In contrast, the usual fee charged by a human financial advisor ranges from 1-2% or even more for commission-based accounts.
3. Personalised Advice: Robo-advisors use algorithms to understand your financial goals and risk tolerance. They then create a personalised and diversified investment portfolio just for you.
4. Automated Portfolio Management: The automated algorithms used by robo-advisors continuously monitor the market and rebalance portfolios based on predetermined strategies, eliminating the need for constant manual adjustments.
What are the Disadvantages of Robo Advisors?
1. Lack of Human Touch: Robo-advisors lack the personal touch that human financial advisors can provide. This can be particularly important for investors who prefer face-to-face interactions or require complex financial planning advice.
2. Risk of Technical Issues: Like any tech-driven service, robo-advisors are not immune to problems. These may range from platform outages and data breaches to errors in their underlying algorithms.
3. Challenges with Complex Financial Needs: Robo-advisors excel in simple investment scenarios but may struggle with more intricate financial tasks like tax planning, estate management, or specialised investment strategies. In these situations, human expertise is often essential.
Do Robo Advisors Exist in India?
Yes, robo-advisors do exist in India. However, they operate differently compared to the ones in the US:
Robo-advisor services in the US are typically fully automated, with capital being allocated and invested without the need for user involvement. However, Indian regulations allow automation only for the initial investing process. For any changes to a user’s portfolio beyond the initial investment (like re-balancing or tax loss harvesting), the platform must obtain explicit consent from the customer/user for each transaction.
US-based robo-advisors typically focus on passive investment strategies using ETFs. In contrast, Indian robo-advisors (like Scripbox and FundsIndia) often prioritise actively managed mutual funds.
Robo-advisors in the US usually charge a transparent annual fee based on assets under management (AUM), typically between 0.25-0.50%, aligning with the performance of the investments. In India, fee structures vary, often involving flat quarterly/annual fees or commissions per transaction.
As India’s financial markets continue to evolve, investors are seeking ways to make informed investment decisions with minimal effort. Robo-advisors, with their automated investment strategies, offer a promising solution to meet this growing demand.
However, do keep in mind that robo-advisory platforms you come across in India are technically “semi-robo advisors” — they do not offer complete automation of your investments. While the Securities and Exchange Board of India (SEBI) has established regulations for traditional investment advisors, it hasn’t yet implemented a comprehensive framework specifically addressing automated financial advice platforms. Looking ahead, the evolution of India’s regulatory landscape will likely play a crucial role in shaping the future of robo-advisors!
In the world of investing, understanding how to build a profitable investment portfolio is key to achieving long-term financial success. Especially during market cycles like bull runs, investors often get caught up in a state of excitement, only to suffer losses when the market inevitably crashes. In this article, we’ll explore key strategies like diversification, risk management, and portfolio rebalancing to help you protect your investments, ensure steady growth, and reduce volatility.
The Bull Run Trap: How Investors Get Caught
During a bull run, two main things happen:
1. Existing investors pour more money into the market, pushing prices higher. 2. New investors jump into the market at high prices, hoping to ride the wave of profits.
The result is widespread market euphoria. But this is also the point where market crashes often occur, leaving both seasoned and new investors trapped. Those who bought at higher prices or averaged up their investments during the bull run suffer the most when the market reverses/falls.
This is why building a well-diversified and balanced portfolio is essential for safeguarding your investments during both bullish and bearish markets.
Why Diversification Matters?
Diversification is a term you’ve likely encountered in various financial discussions. But what does it truly mean? In essence, diversification involves spreading your investments across different asset classes to create a balanced portfolio. This strategy aims to shield your investments from the inevitable ups and downs of the market. Let’s break down the concept of diversification with an example:
If you’re heavily invested in the Nifty50 index and also have investments in small-cap and mid-cap stocks, you may think your portfolio is diversified. However, when the Nifty50 falls, small-cap and mid-cap stocks tend to fall as well. In this case, you’re exposed to a similar risk across different segments of the market, which doesn’t truly represent a diversified portfolio.
Non-Correlating Assets: The Key to True Diversification
True diversification means investing in non-correlating assets—assets that don’t move in the same direction as the rest of your portfolio. For instance, pairing Nifty50 stocks with government securities like Gilt funds can create a balanced portfolio.
When the stock market falls, government bonds, particularly top government security bonds (G-Secs), tend to rise. This inverse relationship between equities and bonds means that even if your equity investments take a hit during a market downturn, the bond portion of your portfolio may provide stability and potentially offset the losses.
How Much Should You Diversify?
When considering diversification, a common rule of thumb is to allocate your investments using the 100 minus your age formula. This means if you’re 30 years old, you should invest 70% in equities and the remaining 30% in bonds or other debt instruments.
While this is a basic approach, there are additional factors to consider when building your portfolio. These include:
Your age and life stage
Investment goals and time horizon
Risk tolerance
Number of dependents and financial responsibilities
The combination of these factors will help you assess how much to allocate to equities, bonds, and other asset classes. Your investment strategy should evolve based on where you are in life. For example, when you’re younger and earning less, you may be willing to take more risks and invest heavily in equities. As you grow older and your income and responsibilities increase, it might make sense to allocate more towards debt and gold to ensure stability in your portfolio.
One key takeaway here is that investment strategies are not set in stone. They should evolve as your financial situation, goals, and risk tolerance change.
The 80-20 Portfolio Rule
An advanced version of the traditional “100 minus your age” formula is the 80-20 rule, which has gained popularity among investors looking for both growth and stability. This rule suggests that you allocate 80% of your investments to equities and 20% to safer assets like government securities and gold.
This 80-20 allocation allows you to take advantage of the growth potential in equities while keeping a portion of your portfolio in safer assets. In times of market corrections, you can tap into your bond and gold investments and reallocate them into equities when prices are lower.
Portfolio Rebalancing: Maintaining Stability Over Time
Over time, your portfolio will shift due to market movements. For instance, during a stock market rally, the equity portion of your portfolio may grow from 80% to 90%, increasing the overall risk. In such cases, rebalancing your portfolio becomes necessary.
Rebalancing involves selling a portion of your over-performing assets (maybe equities) and reinvesting the proceeds into underperforming assets (bonds or gold) to restore your original allocation. This process helps reduce risk and ensures that your portfolio remains aligned with your investment strategy.
However, constantly buying and selling assets can trigger tax liabilities and transaction fees. To avoid this, consider increasing your allocation to safer assets (like bonds) during market rallies rather than selling your equities outright. This keeps your portfolio balanced without incurring unnecessary costs.
The Role of Risk Management in Investing
Risk management is an essential part of investing. Never invest 100% of your funds in equities, even if your goal is long-term growth. By having a diversified investment portfolio, you’re better prepared for any market condition.
For example, if you’re saving for retirement and have invested everything in equities, a market crash just before retirement could severely impact your savings. A diversified approach ensures that you have a mix of assets that can withstand market volatility and provide liquidity when needed.
Final Thoughts
Building a profitable portfolio requires careful consideration of your investment strategy, risk tolerance, and market conditions. By diversifying across various asset classes and regularly rebalancing your portfolio, you can create a resilient investment strategy that withstands market fluctuations.
As you embark on your investment journey, remember to adapt your strategy based on your evolving circumstances and financial goals. Whether you’re a seasoned investor or just starting, maintaining a balanced and diversified portfolio is key to long-term financial success.
Investing in the stock market can be a daunting task, especially with numerous complicated strategies and theories out there. A simple approach that has gained popularity among traders and investors is momentum investing. This strategy involves buying stocks that are on an upward trend and selling them when they reach a higher price. Unlike the traditional “buy low, sell high” mantra, momentum investing focuses on “buying high and selling higher.” In this article, we dive into why this strategy works and how you can implement it in your trading portfolio.
What is Momentum Investing?
Momentum investing, or “riding the wave,” capitalises on the psychological and technical factors that drive stock prices. The idea is simple: instead of trying to swim to the shore against the tide, ride the wave that takes you there. The key to momentum investing is understanding why stocks continue to rise after hitting new highs. It’s a strategy that involves buying stocks that are trending upward and selling them once they reach a higher price. By riding the wave of momentum, investors aim to maximise profits in a shorter timeframe.
Imagine being a surfer riding a wave toward the shore. Instead of struggling against the current, you harness the power of the wave to propel you forward. Similarly, momentum investing allows traders to benefit from the prevailing market direction. The strategy is built on three core principles:
1. Herd Mentality
One of the primary reasons momentum investing works is due to herd mentality. When a stock’s price rises significantly, it often attracts the attention of retail investors. This phenomenon, commonly known as FOMO (Fear of Missing Out), drives more investors to buy into the stock. This further pushes its price upward. Headlines often highlight increased market participation during all-time highs, showcasing the surge of new investors.
2. Technical Factors
Technical analysis plays a crucial role in momentum investing. For instance, if a stock or index breaks through a significant resistance level, such as the Nifty 50 crossing 22,150, it can trigger a short squeeze. Short sellers, who have bet against the stock, may be forced to buy back shares to cover their losses, adding more buying pressure and driving the stock price even higher. This is similar to the infamous GameStop short squeeze, where retail investors caused a massive rally by buying up shares.
3. Insider Activity
Insider trading, though illegal, still occurs and can significantly impact stock prices. Insiders with privileged information may buy shares ahead of a positive announcement, causing the stock price to rise before the news becomes public. This early buying creates momentum, which can attract other investors who follow the price and volume data, unaware of the underlying reason for the price increase.
Research Supporting Momentum Investing
Numerous studies have shown that investing in stocks with positive momentum often yields better returns than buying stocks at 52-week lows. This trend can be attributed to the reasons mentioned above, where the market’s collective behaviour pushes the stock price higher. However, it’s essential to note that momentum investing can work both ways. The same factors that drive a stock up can also accelerate its decline, especially when the market turns bearish.
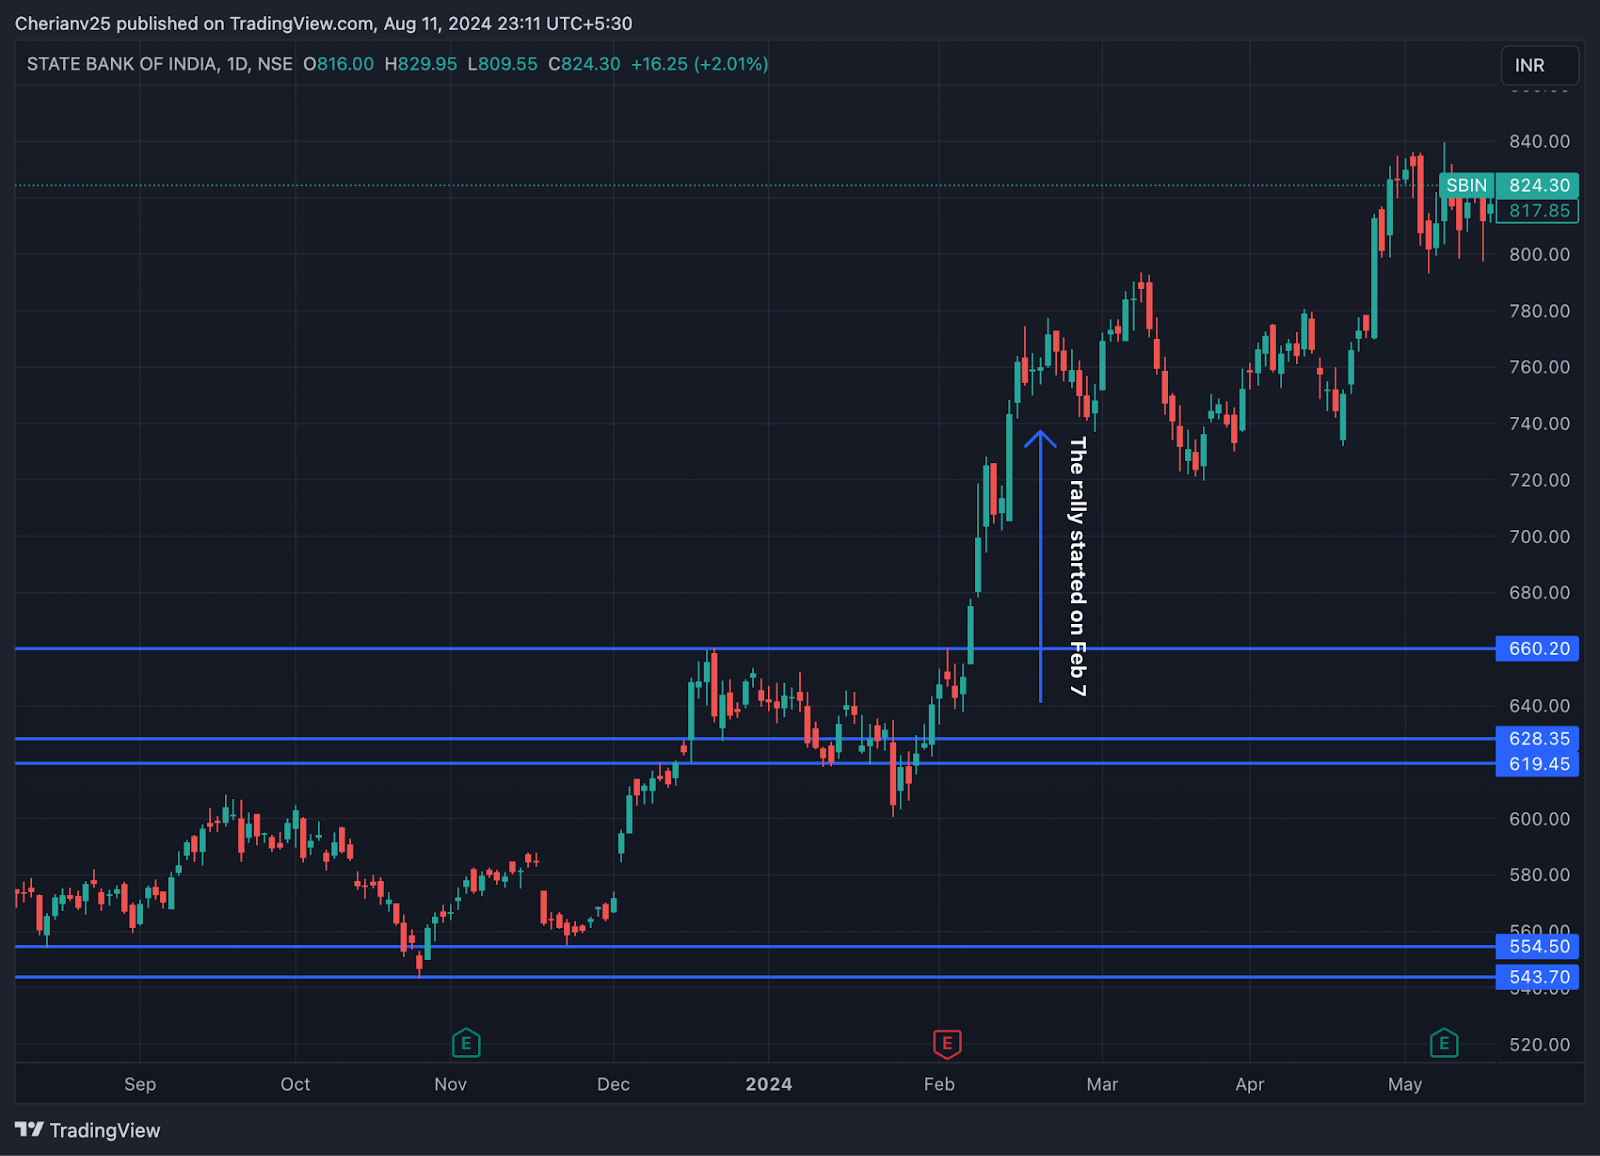
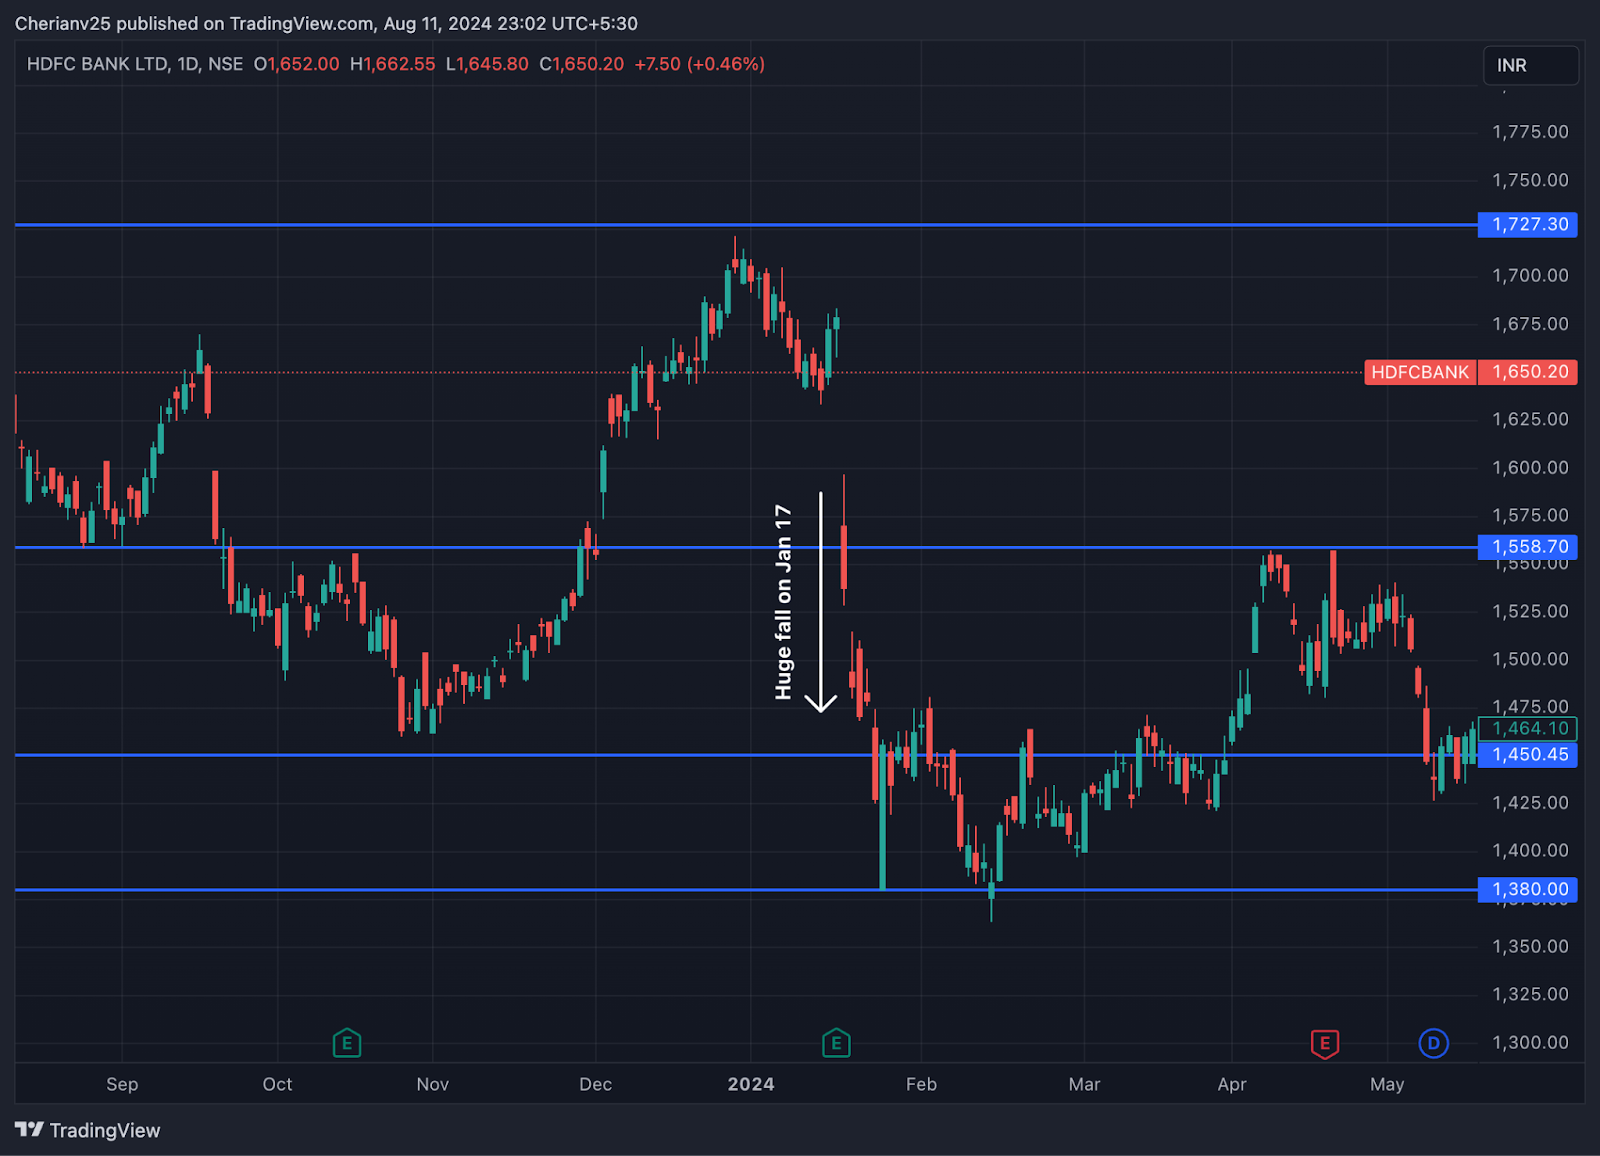
Practical Examples
To illustrate the effectiveness of momentum investing, let’s look at two prominent examples: SBI and HDFC Bank.
1. SBI: On February 7, 2024, the stock broke its all-time high. Within 7-8 days, it delivered a return of 12.86%. This surge was fueled by the factors discussed earlier, showcasing the power of momentum in a bullish market.
2. HDFC Bank: In contrast, HDFC Bank experienced a breakdown, resulting in an 8% decline. This example highlights the risks associated with catching a “falling knife,” where buying into a declining stock can lead to further losses.
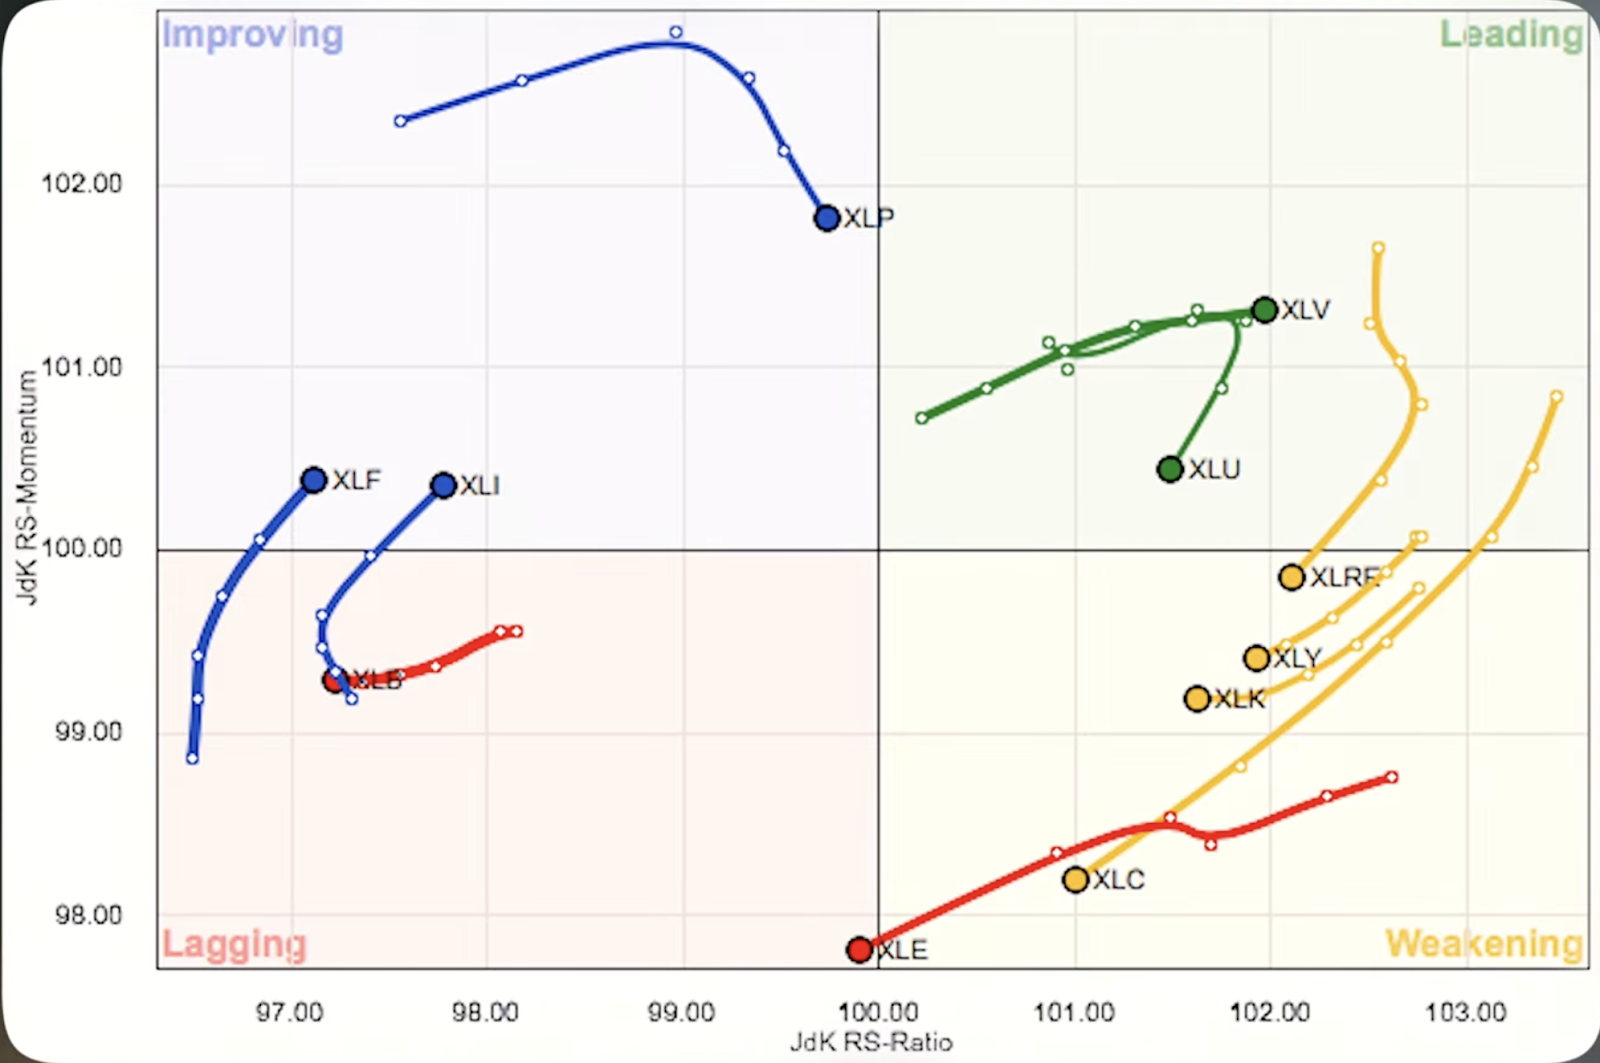
Sectoral Rotation and Momentum Investing
Sectoral rotation involves shifting investments across different sectors based on their performance. The market can be divided into four quadrants: leading, weakening, lagging, and improving. Investors often debate whether to invest in leading sectors or chase lagging sectors for potential rebounds. For momentum investors, the focus is generally on stocks in the leading quadrant, as they are more likely to continue their upward trajectory.
Sectoral Rotation of Stock Markets – Quadrants
How to Identify High-Momentum Stocks?
To identify stocks with strong momentum, follow these steps:
1. Look for unusually high price changes: Start by identifying stocks with significant price changes, typically 3-5% in a day (focus on Nifty 500 stocks, avoid micro-caps.). This change should not be due to news or result announcements, as these can be temporary. 2. Check for high trading volume: Ensure that the stock has unusually high trading volume, indicating strong investor interest. Compare the volume on the day of the breakout with the average volume over the last several days. 3. Breakout Confirmation: Confirm the breakout by analysing the stock’s chart patterns, such as trend lines or horizontal lines. Be cautious of fake breakouts and set appropriate stop-loss levels to mitigate risks.
Simply add these filters on a stock screening platform (like screener.in) to identify momentum stocks.
Limitations of Momentum Investing
While momentum investing can be highly profitable, it does have its limitations. This strategy tends to work best in trending or bullish markets. In contrast, long-term consolidation phases can lead to false breakouts and increased risk.
Here are some strong measures you can take to mitigate risks while momentum trading:
Set stop-loss orders to protect against downturns.
Monitor market conditions to identify trends.
Use daily candlesticks for short-term trades.
Apply weekly or monthly charts for longer-term analysis.
Avoid this strategy during periods of long-term consolidation
Conclusion
Momentum investing is a powerful strategy that can yield substantial returns in the short and medium term. Investors can make informed decisions by understanding the psychological and technical factors driving stock prices. Always remember to use screeners and implement robust risk management strategies to enhance the effectiveness of momentum investing!
As you explore momentum investing, remember to stay updated on market trends and be prepared to adapt your strategies as conditions change. With careful analysis and a commitment to continuous learning, you can harness the power of momentum investing in your stock market journey!
As an investor, you may be constantly looking out for strategies that offer consistent returns with manageable risks. One such strategy that offers a unique approach to generating income is the covered call strategy. It’s widely recognised globally, but not as popular in India. This approach could be particularly appealing to those who prefer a less hands-on investment method. In this article, we will dive into the covered call strategy, explain its mechanics, and explore its advantages and disadvantages.
The Basics of a Call Option
Before diving into the covered call strategy, it’s crucial to understand what a call option is. A call option is a financial contract that gives a buyer the right, but not the obligation, to buy an underlying asset (like a stock) at a predetermined price (strike price) within a specified time frame. For this right, the buyer pays a premium to the seller.
Let’s look at a simple example. Imagine you’re interested in buying a used car. You negotiate with a seller and agree to pay a token amount to secure the right to buy the car at a specified price by the end of the month. This token amount is similar to the premium paid for a call option. If you decide to buy the car, you pay the agreed price. But if you choose not to, the seller keeps the token amount.
In the stock market, when you purchase a call option for a stock, you are essentially paying for the right to buy that stock at a predetermined price within a specific timeframe. If the market price exceeds this strike price, you can exercise your option and purchase the stock at a lower price.
The Covered Call Strategy Explained
The covered call strategy involves owning shares of a fundamentally strong stock while simultaneously selling call options on that stock. This approach is similar to earning rental income from a property; just as a landlord collects rent from tenants, you can collect premiums from the options you sell.
How to Deploy a Covered Call Strategy?
1. Select a Stock: The first step in deploying a covered call strategy is to choose a fundamentally strong stock. For instance, HDFC Bank, a well-established Nifty 50 company, is an ideal candidate due to its robust fundamentals and steady growth potential.
2. Buying the Stock: Purchase the stock in sufficient quantities to form at least one lot (e.g., 550 shares of HDFC Bank) at say ₹1,500 per share. This investment is similar to acquiring a commercial property.
3. Selling Call Options: After buying the stock, sell call options on it. Going back to our example, we can sell HDFC Bank call options with a strike price of ₹1,700. This strike price is chosen based on the expectation that the stock will not exceed this price significantly within the option’s timeframe (there will be an expiry date for the contract).
4. Generating Income: The premium received from selling call options acts as rental income. If the stock price remains below the strike price, the call options expire worthless, and you retain the premium. If the stock price exceeds the strike price, you sell the stock at the strike price, thus capping your profit but still securing a gain.
When selling call options, suppose you receive a premium of ₹8 per share for a 1.5-month period. Over a year, this could amount to approximately ₹25,000 to ₹30,000 in premium income. This translates to an expected return on investment (ROI) of about 3.8% to 4% annually, a figure comparable to returns from traditional commercial real estate investments.
Advantages of the Covered Call Strategy
Consistent Income: By selling call options regularly, you can generate consistent income from the premiums, similar to earning rent from a property.
Downside Protection: The premium income can offset potential losses if the stock price declines slightly.
Limited Risk: The primary risk is the opportunity cost of missing out on substantial gains if the stock price rises significantly above the strike price.
Long-Term Investment: The strategy encourages a long-term investment approach, holding fundamentally strong stocks that are likely to appreciate over time.
Disadvantages of the Covered Call Strategy
Limited Upside Potential: Your profit is capped at the strike price of the sold call option. If the stock price soars, you miss out on higher gains.
Stock Selection: The success of this strategy hinges on selecting the right stock. Buying a stock at an overvalued price can lead to losses.
Capital Requirements: This strategy requires a significant initial investment to buy the necessary stock quantities.
Management Complexity: While the strategy reduces the need for constant monitoring, it requires understanding market conditions and adjusting positions accordingly.
Investors must be aware of these risks and ensure they have a solid understanding of market conditions before implementing this strategy. Proper stock selection is crucial, as buying at a high price can significantly impact overall returns.
Enhancing Returns with Margin Pledging
One additional advantage is the ability to pledge the stock holdings to obtain margin (capital) for further trades. For instance, if you invest ₹8.25 lakhs in HDFC Bank shares, you can pledge these shares to get a margin for intraday or positional trades. This margin can be used to generate additional returns, enhancing the overall profitability of your investment.
Conclusion
The covered call strategy offers a unique blend of consistent income and long-term growth potential. This makes it an attractive option for investors seeking a stock market alternative to traditional rental income. By understanding the mechanics and carefully selecting stocks, investors can unlock significant value and generate steady returns with manageable risks.
While there are risks involved, the potential for steady income and long-term capital appreciation makes this strategy worth considering. As with any investment strategy, it’s essential to conduct thorough research, understand market conditions, and consult with financial advisors if necessary.
Whether you’re an experienced trader or a beginner looking to explore new avenues, the covered call strategy could be a valuable addition to your investment portfolio. With proper execution and management, it can help you achieve your financial goals while minimizing risk!
Investing in US stocks is become increasingly popular among Indian investors, especially the younger generation. Despite the Indian stock market’s impressive bull run over the past few years, many are drawn to the potential higher returns of prominent US stocks like Amazon, Tesla, and Nvidia. Unfortunately, many investment apps have high fees and complicated terms that can discourage people from using them. In this article, we will explore a low-cost and efficient way to invest in US stocks from India.
Why Invest in US Markets?
Here are four compelling reasons why you can consider investing in US stocks:
1. Diversification
Diversification is a fundamental investment strategy that involves spreading investments across various assets to reduce risk. When one asset class performs poorly, another may perform well, balancing your overall portfolio. For instance, when stock markets decline, commodities like gold often rise. The US and Indian markets have low correlation, meaning their performance is not closely tied. This lack of correlation opens opportunities for true diversification. If the Indian stock market underperforms, your US investments can potentially offset those losses.
2. Currency Depreciation
The performance of the Indian Rupee against the US dollar can significantly impact investment returns. For example, if you bought US dollars when the exchange rate was ₹70 and the rate increased to ₹84, your investment appreciates without any stock market gains. This currency strength can enhance your overall returns.
3. Lower Volatility
The US market is more mature and stable compared to the Indian market. This maturity results in lower daily volatility, making it a less risky investment option. However, do remember that no investment is entirely without risk!
4. Better Valuations
US stocks often have better valuations compared to Indian stocks. Price-to-earnings (P/E) ratios in the US are generally more favourable, providing more value for your investment. For example, many US-listed companies have lower P/E ratios than Indian companies, indicating better value potential.
How to Start Investing in the US Stock Market from India?
Many investors may wonder how to begin their investment journey in US stocks with minimal capital. Here’s a straightforward approach:
Investing Through Mutual Funds
One of the most effective ways to invest in US tech stocks is through mutual funds, specifically those focused on the NASDAQ index. The NASDAQ is renowned for its tech-heavy listings, including major players like Apple, Amazon, and Nvidia.
Here are two mutual funds that are ideal options for investing in US markets:
1. Motilal Oswal NASDAQ 100 Fund of Fund
The Motilal Oswal NASDAQ 100 Fund of Fund is a popular choice for Indian investors. This fund invests in another mutual fund that directly targets NASDAQ-listed companies. Here are some key points:
CAGR Returns: The fund has delivered an impressive Compound Annual Growth Rate (CAGR) of around 25% over the last five years.
Expense Ratio: The expense ratio is relatively low, ensuring that you get more out of your investments.
Minimum Investment: You can start investing with as little as ₹500.
Performance: Over the last year, the fund has provided more than 30% returns, demonstrating the potential of US markets.
2. ICICI Prudential NASDAQ 100 Index Fund
This fund also invests in NASDAQ companies and offers similar benefits:
Returns: The fund has delivered a return of 29.21% over the last year.
Expense Ratio: The expense ratio is slightly higher at 0.52%, but still reasonable.
Portfolio: The fund invests in leading tech companies like Microsoft, Apple, Nvidia, and Amazon, in proportions that mirror the NASDAQ index.
Other Options to Invest in US Stocks
In addition to the NASDAQ-focused funds, you can consider the following options:
Motilal Oswal S&P 500 Index Fund: This fund invests in the S&P 500 index, which includes major US companies like Microsoft and Amazon. The investment ratios differ from those in NASDAQ funds, providing additional diversity.
Sector-Specific Funds: Explore funds that focus on specific sectors, such as technology or healthcare, to align with your investment strategy.
How Much to Invest?
While investing in US stocks can be beneficial, it’s essential to balance your portfolio. Moderation is key! A recommended strategy is to invest no more than 15-20% of your total portfolio in US stocks. This allocation provides diversification benefits while keeping the majority of your investments within familiar markets.
Investing too heavily in foreign markets can expose you to risks you may not fully understand. While major US tech companies show strong growth potential, diversification is essential to safeguard your investments. Balancing your portfolio with a mix of domestic and international assets can lead to more stable long-term growth.
Conclusion
Investing in US markets offers numerous benefits, from diversification to access to leading technology companies. However, it’s vital to approach this opportunity with caution. Mutual funds provide a transparent and efficient means to invest, minimising risks associated with direct stock purchases.
As you embark on your investment journey, remember to conduct thorough research and consider your risk tolerance. The US market presents a wealth of opportunities, but informed decisions are crucial for success. Share this guide with fellow investors to help them navigate the complexities of investing in US stocks.
Stay informed, stay diversified, and enjoy the journey of investing in the global market!
Finance Minister Smt. Nirmala Sitharaman presented the Union Budget for the financial year 2024-25 in Parliament on July 23, 2024. Let us take a look at some of the key highlights from the Budget presentation.
The 9 priorities of the budget are:
1. Agriculture Transformation:
The Indian govt aims to transform agricultural research and productivity. It will support the public and private sectors by introducing 109 high-yielding crop varieties and 32 new releases of horticulture. One crore farmers will be encouraged to take up natural farming based on certification and branding. There’s a proposal to establish 10,000 bio-input centers to create a national-level micro-fertilizer and pesticide manufacturing network. There will also be efforts to increase the production, storage, and marketing of oilseeds like mustard, sesame, soybean, and sunflower.
Besides this, 400 districts and six crore farmers will be added to land registries, while Kisan Credit Cards will be enabled in five states. Shrimp production and exports will be increased under NABARD’s national cooperation policy.
The Centre will allocate ₹1.52 lakh crore to the agriculture and allied sectors.
Do look out for the stocks in the agriculture sector: UPL, Coromandel International, Rallis India, Avanti Feeds, Kaveri Seed Co, PI Industries, and Bayer CropScience.
2. Employment and Skilling
To meet the challenges on the employment front, the government has introduced three schemes:
1. All first-time entries into jobs in every formal sector will be paid one month’s wages in advance— up to ₹ 15,000, subject to a total of 2.1 crore youth (Scheme A).
2. Incentives will be provided directly to both employees and employers on a specified scale for their EPFO contribution in the first 4 years of employment. (Scheme B).
3. The government will reimburse EPFO contributions of employers up to ₹3000 per month for 2 years for all new hires. – Expected to generate 50 lakh jobs (Scheme C).
Measures that attempt to increase female workforce participation include the establishment of women’s hostels and specific programs for skilling. Over the next five years, 20 lakh youth will be skilled, with 1,000 training institutes upgraded. New courses will cater to emerging sectors, and loans up to ₹7.5 lakh will support 25,000 students annually.
3. Human Justice and Regional Development
Development initiatives have been planned under the Purvodiya program, with a focused attention on the eastern states like Bihar, Jharkhand, West Bengal, Odisha, and Andhra Pradesh. An investment of ₹26,000 crore in roadways and ₹21,400 crore in power projects will provide better connectivity through infrastructure projects. New airports and medical colleges will be established in Bihar. The govt will support the Polavaram irrigation project in Andhra Pradesh to ensure food security.
4. Manufacturing and Services
The govt has proposed to give special attention to Micro, Small & Medium Enterprises (MSMEs) through a ₹100 crore credit guarantee scheme, a new way of judging credit, and enhanced Mudra loans of up to ₹20 lakhs for those having repaid their loans earlier. An internship scheme associated with the PM package will offer one crore youth the opportunity to work in top companies for five years, with a stipend amount of ₹5,000 per month.
Under the PPP (Public-Private Partnership) mode, rental housing schemes shall be developed for industrial workers. The shipping industry will benefit from the Critical Mineral Mission aligned with technology and skill in manpower development.
5. Urban Development
Growth in urban areas will be driven by developing cities as hubs with transit-oriented plans in 14 large cities. Housing needs for one crore members will be addressed with a ₹10 lakh crore investment. This is accompanied by initiatives for transparent rental markets and improved water supply & sanitation across 100 cities through bankable projects.
6. Energy Security
The PM Surya Ghar Muft Bijli Yojana will promote rooftop solar installations for one crore households. The govt has proposed to speed up policy implementation for pumped storage, nuclear R&D, and advanced thermal power plants. The govt will scale up energy audits in industrial clusters. A joint venture between NTPC and BHEL will set up a full-scale 800-megawatt (MW) commercial plant.
Top energy-related stocks may include NTPC, SJVN, NHPC, Tata Power, Adani Green Energy, Adani Power, Bharat Petroleum, Indian Oil Corporation, ONGC, and JSW Energy.
7. Infrastructure
The Centre will spend₹11.11 lakh crore on infrastructure in the next five years (which accounts for 3.4% of our GDP.) The state resource support for infra allocation is coming to a total of ₹1.5 lakh crore, including the 4th phase of Gram Sadak Yojana to improve rural connectivity. The Centre will launch Phase IV of Pradhan Mantri Gram Sadak Yojana (PMGSY) to provide all-weather connectivity to 25,000 rural habitations.
Projects at Vishnupad and Mahabodhi temples in Bihar and Nalanda will boost tourism. Financial support for projects with an estimated cost of ₹11,500 crore such as the Kosi-Mechi intra-state link and 20 other ongoing and new schemes will be provided. The govt will provide assistance for flood management and related projects in Assam, Sikkim & Uttarakhand and reconstruction and rehabilitation in Himachal Pradesh.
These are a few stocks to look out for in the Infrastructure sector: NBCC, HFCL, IRB Infra, PNC Infra, KNR Construction, PNC Infratech, RITES, Ahluwalia Contracts, and Larsen & Toubro Ltd.
8. Innovation and R&D
This priority includes a National Research Fund with a funding pool of ₹1 lakh crore to incentivize innovation and a Space Economy Venture Capital Fund of ₹1,000 crore. The Central Govt will operationalise the Anusandhan National Research Fund to support basic research and prototype development.
9. Reforms for the Next Generation
The govt aims to introduce a new Economic Policy Framework to guide reforms focused on improving employment opportunities and sustaining high growth. This framework will boost productivity across land, labour, capital, and entrepreneurship by leveraging technology and collaboration between the Centre and states. The Centre will work on land-related reforms such as assigning Unique Land Parcel Identification Numbers (ULPIN) and digitising maps for rural areas. Urban areas will see digitisation of land records with GIS mapping. Meanwhile, the Jan Vishvas Bill 2.0 will emphasise digitisation and ease of doing business.
What are the Updates on GST?
Medicine and Medical Equipment: GST rate cut for three more cancer medicines.
X-Ray Tubes: Revision in Basic Customs Duty (BCD) on certain items to help ‘Healthcare’.
Critical Minerals Reduction in Customs Duty on 25 minerals to make them more easily available for Medical use.
Marine Products, Leather and Textile BCD on real down filling materials from duck or goose reduced to aid these industries.
Precious Metals BCD on gold and silver reduced to 6% and platinum to 6.4% making them cheaper
Oxygen-Free Copper Abolition of BCD on Oxygen-Free Copper used in the manufacture of resistors and connectors to increase capacity.
Ammonium Nitrate: Hiked from 7.5% to 10% to control usage.
Plastics and PVC: Increased BCD to control environmental pollution.
Telecom Equipments: Increased BCD from 10% to 15% on certain items to encourage domestic manufacturing.
Direct Tax Reforms in Union Budget 2024-25 & Other Updates
Standard Deduction for salaried employees: Increased from ₹50,000 to ₹75,000. [Standard deduction is a fixed amount of money that salaried individuals can subtract from their total income before calculating their taxes.]
Family Pension Deduction: Increased from ₹15,000 to ₹25,000.
Mutual Funds and Unit Trust of India (UTI): Abolished tax deducted at source (TDS) to attract investors.
Angel Tax: Abolished for all classes of investors to foster the growth of startups.
The Centre has proposed to remove the indexation benefit available for calculating any long-term capital gains (LTCG) presently available for property, gold and other unlisted assets (this will severely impact people who have invested in such assets as to sell during retirement). Meanwhile, the LTCG tax on immovable properties will fall from 20% to 12.5%. – Effective from July 23, 2024.
[Indexation adjusts the purchase price of an asset to adjust for inflation, thus reducing the gains and ultimately tax liability.]
Revised Tax Slabs – New Tax Regime
Income Range
Rate of Tax
Up to ₹3 lakh per annum
Nil
₹3 lakh to ₹7 lakh per annum
5%
₹7 lakh to ₹10 lakh per annum
10%
₹10 lakh to ₹12 lakh per annum
15%
₹12 lakh to ₹15 lakh per annum
20%
Above ₹15 lakh
30%
With the new tax slabs, salaried taxpayers can now save up to ₹17,500.
Revised Tax Rates for Stock Market Participants
1. Capital Gains Tax
Short-Term Capital Gains (STCG): The tax rate has been increased from 15% to 20%.
Long-Term Capital Gains (LTCG): The tax rate has been revised from 10% to 12.5%. The exemption limit of LTCG now stands at ₹1.25 lakh per annum.
2. Securities Transaction Tax (STT)
With effect from Oct 1, STT on the sale of options will be increased from 0.0625% to 0.01% of the option premium.
STT on sale of futures futures will go up from 0.0125% to 0.02% of the price at which such futures are traded.
The Way Ahead
The Union Budget 2024-25 outlines strategies to boost India’s economic growth across key sectors. It focuses on agriculture, employment, infrastructure, and innovation to create a resilient and inclusive economy. Key initiatives include agricultural transformation, employment schemes, regional development (especially in eastern states), MSME support, urban development, and energy security measures. These efforts, along with investments in skilling and innovation, reinforce the ‘Make in India’ initiative and promote sustainable growth.
Tax reforms, GST updates, and new policies aim to improve the business environment. While the plans are ambitious, their effective implementation will be crucial in shaping India’s economic future, driving growth, creating jobs, and enhancing societal well-being in the coming years.
Now let’s look forward to seeing how these strategic plans are implemented!
Disclaimer: The stocks mentioned in the article are solely for educational purposes. Please do your own research before investing.
As an investor, you’ve likely accumulated shares and mutual funds across multiple demat accounts. You could be using different brokers, opening new accounts for better services, or promotional offers. Managing this scattered portfolio can be a daunting task, but the good news is that you can now transfer your holdings from one demat account to another with ease. In this comprehensive guide, we’ll walk you through the updated process of transferring shares, stocks, and mutual funds using the CDSL Easiest platform.
What is CDSL Easiest?
Central Depository Services (India) Ltd (CDSL), India’s largest depository, offers a user-friendly platform called CDSL Easiest that streamlines the process of transferring your investments between demat accounts. Whether you’re consolidating your portfolio, gifting shares to loved ones, or simply reorganising your holdings, CDSL Easiest makes it a breeze to complete the transfer in just 10 minutes:
Step 1: Create Your CDSL Easiest Account
1. Visit the CDSL Easiest website and click on the “Register for Easiest” option. You’ll need to provide your DP ID and client ID, which you can find in the ‘Profile’ section of your broker’s website. The DP ID is the first eight digits and the client ID is the next eight digits of your Demat account number
2. Once you’ve entered this information, you’ll receive an OTP to your registered mobile number and email address. Submit the OTP to verify your registration.
3. Next, create a username, set a security question, and register the Demat account to which you want to transfer shares.
Important note: Let’s say you’re transferring holdings from a Zerodha account to an IIFL Securities account. You will need to have a CDSL Easiest account in the name of the Zerodha account from which you are transferring.
Step 2: Link Your Beneficiary Account
A major update in 2024 is the mandatory step of linking the beneficiary account before transferring shares.
1. Go to the “Transaction” tab, click on “BO Linking,” and set up the beneficiary account. Enter the Demat account number of the account you want to transfer shares into and your PAN number.
2. You will receive an email from CDSL. Follow the instructions to confirm the beneficiary addition and complete the OTP verification process.
Step 3: Transfer Your Shares
Now that your CDSL Easiest account is set up and your beneficiary account is linked, it’s time to initiate the share transfer.
1. After your account and beneficiary linking are approved (this can take up to 24 hours), log in to CDSL Easiest platform.
2. To initiate the transfer, go to the “Transaction” tab, click on “Setup,” and select the “Bulk Setup” option.
3. Select the current date or the next working market day as the execution date. Choose the account to transfer shares into and enter the ISIN (International Securities Identification Number) of the stocks you wish to transfer.
4. Verify the transaction details, commit the transaction, and complete the OTP and transaction PIN verifications.
Advantages of Using CDSL Easiest
The platform simplifies the share transfer process, eliminating the need for physical visits to the broker’s office.
There are no tax implications as you’re not selling or buying shares.
You can transfer shares as many times as needed.
Apart from a nominal stamp duty charge, there are no additional costs.
Disadvantages of Using CDSL Easiest
After transferring shares, the average buying price of the shares will not be available, which can complicate tax filing.
Some brokers may take longer to approve the CDSL Easiest account. For instance, Zerodha may take up to 48 hours.
The portal may not work after 5 PM
While there is a new option for CDSL to NSDL transfers, its reliability is yet to be tested.
Conclusion
By leveraging the CDSL Easiest platform, you can now effortlessly consolidate your investment portfolio, transfer shares between accounts, and even gift stocks to your loved ones – all without the hassle of tax implications or complex paperwork. Follow the steps outlined in this guide, and you’ll be well on your way to a simplified and organised investment journey!