The Hinduja Group’s Ashok Leyland has produced some of India’s best buses and trucks over the past seven decades. From school buses to army trucks, the company continues to play a vital role in our country’s development. In this article, learn more about Ashok Leyland Ltd, the second-largest manufacturer of commercial vehicles in India.
Ashok Leyland Ltd – Company Profile
Ashok Leyland Ltd manufactures and sells commercial vehicles (CVs) in India and across the globe. Incorporated in 1948, it is the flagship company of the Hinduja Group. They primarily manufacture distribution trucks, light & small commercial vehicles, tractors, and goods carriers. The company offers city, intercity, school and college, staff, tourist, and airport shuttle buses. Their range of defence vehicles comprises logistics, high mobility, armoured, light tactical, tracked, and simulator vehicles. Ashok Leyland also provides power solutions, including diesel generators, agriculture engines, industrial engines, and marine engines.
Further, the Chennai-based automaker provides manpower supply services, air charter services, and driver training services. They also operate retail stores and LeyKart, an e-commerce store for spare parts. Ashok Leyland serves its customers through an all-India sales and service network.
The company markets its vehicles under the Ecomet, CHEETAH, Oyster Wide, SUNSHINE, Viking Diesel, and STALLION brands. The company’s UK-based subsidiary Switch Mobility manufactures next-generation electric buses as well.
Factsheet
- Ashok Leyland is the second-largest manufacturer of commercial vehicles in India (after Tata Motors).
- It is the fourth largest manufacturer of buses in the world and the 19th largest manufacturer of trucks.
- The company operates nine manufacturing plants– 7 in India, 1 in the United Arab Emirates, and 1 in the United Kingdom.
- Ashok Leyland has a presence in 50 countries and is one of the most fully integrated CV manufacturing companies.
- The automaker launched India’s first electric bus in 2016.
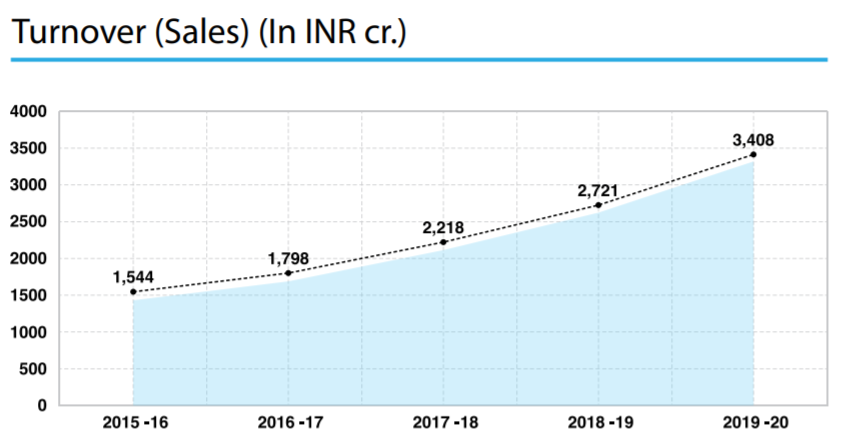
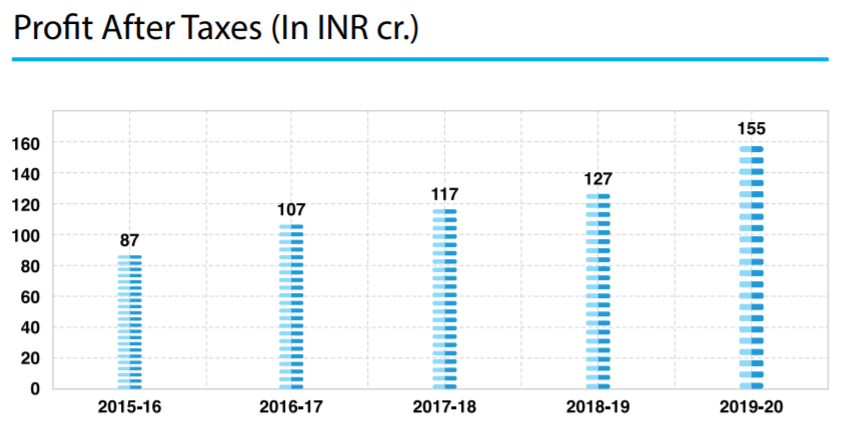
Financial Performance
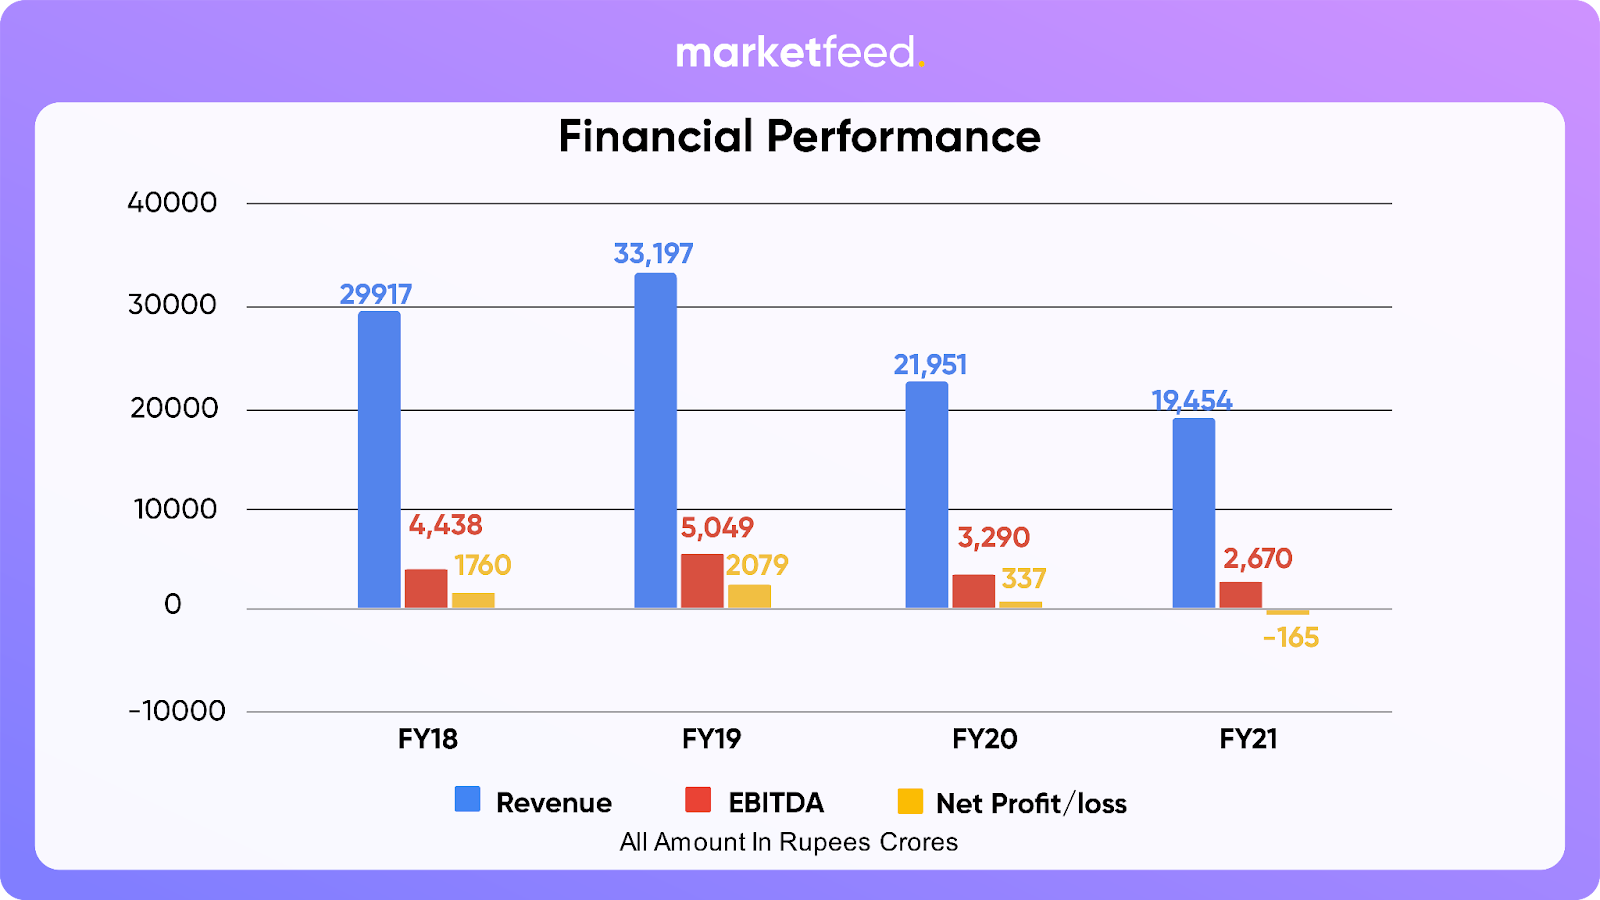
Unfortunately, Ashok Leyland’s revenues and profits have been on a decline. The company reported an 11.4% year-on-year (YoY) decline in sales revenue to Rs 19,454 crore for the financial year 2020-21. It posted a net loss of Rs 165.23 crore in FY21, compared to a net profit of Rs 336.67 crore in FY20. The challenges in the commercial vehicle market due to the Covid-19 pandemic continue to impact Ashok Leyland’s sales volumes and overall performance. A sharp increase in the prices of raw materials and the global semiconductor shortage forced the CV major to hike prices last year.
The company’s revenue has grown at a CAGR of -1.76% over the past five years, whereas the CV industry average stands at 0.24%. Currently, Ashok Leyland has a 67.17% market share in India’s commercial vehicle segment.
For the quarter ended September (Q2 FY22), Ashok Leyland reported a consolidated net loss of Rs 84 crore. It had posted a net loss of Rs 96 crore in the corresponding quarter last year (Q2 FY21). Revenue rose 44% YoY to Rs 5,562 crore in Q2 FY22. Meanwhile, EBITDA remained flat at Rs 576 crore. The company has significant long-term and short-term debt liabilities in its books.
Ashok Leyland will report its financial results for the October-December quarter (Q3 FY22) in February.
Stock Performance
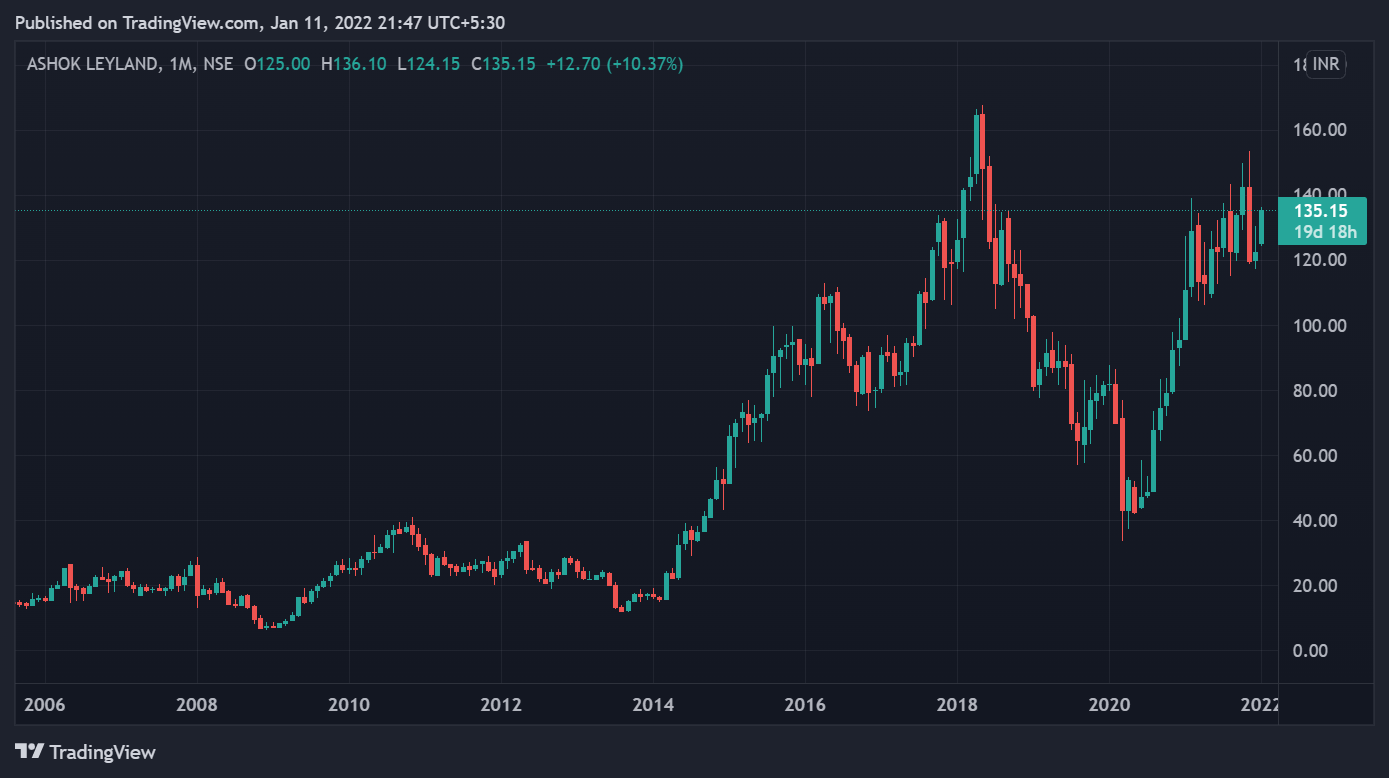
After a significant rally (nearly 5x) from 2014-2016, Ashok Leyland’s shares fell on account of a failed joint venture (JV) with Nissan Motor Company. The partnership turned sour when the Japanese automaker served a termination notice for one of its JVs. This move was reportedly due to a delay in bill payment by Ashok Leyland. Moreover, the two firms were engaged in legal battles due to alleged breach of contracts. The Indian CV manufacturer also failed to pay a royalty of around Rs 200 crore to Nissan.
The company’s shares touched an all-time high of ~Rs 165 in April 2018. However, it started falling heavily from that point. Sales of medium and heavy-duty CVs began to decline sharply due to poor conditions in the global automobile industry. Rising commodity prices, fuel efficiency and BSVI regulations, affordability issues for customers, and drastic effects of the Covid-19 pandemic ultimately led Ashok Leyland’s shares to crash 75% within two years.
Ashok Leyland’s stock price is currently trading at Rs 135.15, down 11.95% from its 52-week high.
The Way Ahead
Ashok Leyland has a long-standing presence in India’s medium and heavy commercial vehicle (M&HCV) segment. It has a well-diversified distribution and service network across the country. However, the company is scrambling to regain its lost market share due to unfavourable market conditions. Industry experts expect Ashok Leyland to be a key beneficiary of the anticipated upcycle in the Indian CV segment.
The CV major had lined up a capital expenditure (capex) of Rs 750 crore for FY22 to strengthen its product portfolio. Recently, Ashok Leyland announced its entry into the used vehicles business via a partnership with Shriram Automall. The companies will launch a physical and digital platform for facilitating the exchange, disposal, and purchase of old CVs.
The company has lined up its electric vehicle (EV) roadmap and also set a target of becoming one of the top 10 commercial vehicle brands in the world. The company’s EV push will be led by its UK-based subsidiary, Switch Mobility. The EV arm plans to launch its first electric light commercial vehicle (e-LCV) in India soon. Ashok Leyland also plans to invest $150-200 million in the EV space in the next few years. Based on estimates, the global electric bus market is likely to reach $70 billion by 2030. Switch Mobility will be well-positioned to address this market. Let us look forward to seeing how the automaker executes its strategic plans.
What are your views on Ashok Leyland? Are you invested in it? Let us know in the comments section of the marketfeed app.