Categories
Jargons

How Much Returns Can You Realistically Make From the Stock Market?

From one of our previous articles, you might’ve understood why you should be interested in the stock market and invest or trade. However, it’s important to have a perspective on how much money (or returns) you should aim to make from the stock market. If you ask beginners, the two most common answers would be as much as possible. Or in absolute terms, maybe ₹5000 or ₹10,000 a day with very little capital. If this is your perspective, then you need to reconsider it as soon as possible!

The answer to the question in the title is: meet industry benchmarks.

What are Industry Benchmarks?

An industry benchmark is a reference point that helps you compare your performance with the leaders in the industry. For example, if the average time the top 10 race drivers take to finish a lap is 1 minute, then the industry benchmark is 1 minute. If a driver finishes the lap in 1 minute, we can consider them successful in that particular industry as they have surpassed the industry benchmark.

We now have clarity on the activities you can do in the stock market: trading and investing. But what are the industry benchmarks in trading and investing?

Industry Benchmark in Trading

If we examine how much Jim Simons (one of the most successful traders in the world) earns, we see that he generates 70% returns on his deployed capital each year. That means that if he had deployed ₹1 crore of capital on trading, he would’ve made around ₹70 lakhs that year. The top traders in India make nearly 40-70% returns on their capital every year. So the industry benchmark of 40-60% returns is what you should aim to generate through trading. 

However, the estimations for industry benchmarks were done with scalability in mind. It is possible to make 100%, 200%, or possibly, even more, returns with small capital, but it may not be scalable. Whatever your capital may be, you should target 40-70% profits per annum. 

Industry Benchmark in Investing

It is common knowledge that Warren Buffet, renowned as the greatest investor of all time, averages CAGR returns of 18% per year. The late Mr. Rakesh Jhunjhunwala, India’s top investor, once said “If you’re able to earn an 18% return on your portfolio, you are no less than a king, and if the return is 21%, you are an emperor.” Even India’s leading portfolio management services generate CAGR returns of 20-30%. From this, we can conclude that 18-20% is the industry benchmark for investing, and this is what you should aim to achieve.

3 Points To Remember

1. Set a Target

Without a target or goal, it is like getting into a car without knowing where to go. To comprehend what is possible, practical, and achievable, you need to be aware of industry benchmarks.

2. Think in Percentage Terms

While discussing profits, we should express them as percentages rather than absolutes. This is because absolute terms do not provide any context for how much capital was used to generate those returns. For example, if someone says they made ₹1 lakh a week and used ₹10 crore capital, that would only be 0.1% returns, which is not great. So we should always think and talk in percentage terms.

3. Making Out of the World Returns is Possible

We discussed how generating massive returns of 200% or more may not be practical because of scalability issues. There are a few exceptional traders who make those kinds of returns, but not everyone can be at that level. It may not be possible or practical if we all aim for high returns from the start. Instead, we should focus on beating the benchmarks and then gradually increasing our targets when needed.

To conclude, you need to set realistic expectations of what you can achieve. People often make the mistake of thinking that they’re going to make a fortune overnight. The reality is that it takes time to make money in the stock market, and you need to be patient. If you’re ready to start investing in the stock market, then make sure that you have the right perspective. Otherwise, you’re setting yourself up for disappointment.

Categories
Jargons

How to Build Wealth Through the Stock Market? Investing vs. Trading

Before you learn about the stock market, it is essential to understand why it should interest you, how you plan to generate income from it, and what kind of activities you should do in the market. There are a lot of different perspectives out there when it comes to the world of the stock market. Some people think it’s a great way to make money, while others think it’s a huge gamble. The core objective of this article is to change mindsets and set a strong perspective.

Why Should You Be Interested in the Stock Market?

To understand why you should become interested in the stock market, we must first understand what everyone is striving for in today’s socio-economic environment. What is the absolute goal of an average person? It’s financial freedom!

What is Financial Freedom?

Financial freedom is a desirable condition of having enough money in your bank account to cover your expenses without having to work, run a business, or rely on others. Many people aspire to achieve it before they retire. Financial freedom allows you to pursue your passions without worrying about expenses, even if your passions do not generate income.

Normally, people save a part of their income and deposit it in their savings account, fixed deposit, or recurring deposit. They invest to generate wealth, which can then be used to take care of any long-term financial goals or expenses after retirement. However, it is impossible to achieve financial freedom by such methods as the annual returns generated by these financial instruments are only 5-7%. They cannot help you generate enough income to beat inflation

Inflation in India stands at ~6%, and if you keep your money in a savings account or deposit it into FDs or RDs, you’re barely beating inflation. You won’t even make enough money to keep aside as savings after accounting for all expenses. So what can you do?

The stock market can be one of the most convenient and easy ways to achieve financial freedom as it offers more returns on your investments.

How to Use the Stock Market to Achieve Financial Freedom?

There are mainly two types of activities in the stock market that a retail participant can take part in:

  • Trading
  • Investing

Trading is the buying and selling of stocks for short periods (intraday or for less than a year) or futures and options to generate income in a short period. There are different types of trading such as intraday trading, swing trading, and positional trading, which we will discuss in later sessions. People trade to generate cash flow instead of generating wealth through long-term investing.

Long-term investing involves buying and holding stocks, bonds, commodities, mutual funds, and exchange-traded funds (ETFs) for extended periods to grow your wealth.

How do Trading and Investing Solve the Problems of an Average Person? 

If you recall, the key issue most people face is the inability to beat inflation. So an average person can beat inflation by investing in the stock market for the long term instead of depositing their savings in a fixed deposit, recurring deposit, or even their bank savings account. Long-term investing can help you amass great wealth by generating higher returns. We should view it as a fundamental duty of every citizen.

The second pressing issue for many people is insufficient income to start investing. With rising expenses, they may not have enough salary or wages to set aside to make investments. To fix this issue, a person can upskill for a higher-paying job, start a business, or trade in the stock markets. You can trade both actively and passively.

Should Everyone Trade?

The only motive for trading is to make money or an extra income. Trading is a choice. If you have the potential to make enough income by increasing your skills in your current job or business, then trading is not necessary.

The stock market is a great way to make money. However, it can also be risky. So it’s important to learn the fundamentals of the stock market before you invest or trade. We hope that you have gained clarity on why you should be interested in the stock market and whether you should engage in trading, investing, or both.

Categories
Jargons

What is Cash Flow Statement?

A Cash Flow Statement is a vital document that provides a clear picture of a company’s financial health. Whether you’re a new or seasoned investor, it’s important to understand the basics of a cash flow statement. In this article, we will understand what a cash flow statement is, its structure, and how to analyse it.

What is a Cash Flow Statement?

A cash flow statement provides information about a company’s cash receipts and cash payments during an accounting period. In simple terms, the statement shows where a company spends its cash and how much it receives. It contains details regarding net cash inflows and outflows of a company and the cash balance. They can be categorised into: cash flow from operating activities, cash flow from investing activities, and cash flow from financing activities.

Cash Inflow vs Cash Outflow

Cash inflow refers to the cash that a company receives during an accounting period, while cash outflow is the cash that a company spends during an accounting period. For example, a company bought 10 packets of milk for ₹200 and paid the seller ₹200 in cash. The company then sold 10 packets of milk to another person and received cash of ₹250. Here, the cash inflow and outflow of the company are ₹250 and ₹200, respectively.

Cash inflow is represented by a positive sign and cash outflow by a negative sign. 

Why Should You Analyse a Cash Flow Statement?

A cash flow statement provides detailed information about the cash transactions of a company during a year. Only cash-based transactions are included in the cash flow statement. So the revenue earned by selling products and services on credit will not be included. 

In the statement of profit & loss, revenue from operations includes both cash sales and credit sales. Credit sales are those in which the products were sold on credit, which means that a company will only receive cash after a certain period. On the other hand, cash sales are those in which the products are sold after the immediate receipt of cash. Revenue in the income statement shows the value of revenue earned even if the actual cash is yet to be received. Meanwhile, a cash flow statement only shows the amount of actual cash received for sales and does not include the value of credit sales. 

Therefore, a cash flow statement helps investors to understand how a company’s operations are making money and how it spends. It also shows how efficiently a firm is managing and generating its cash and how it pays off debt and other obligations. A consistent positive cash flow indicates a healthy and sustainable business model. It reflects a company’s capability to cover its operating expenses and invest in growth opportunities.

Classification of Cash Flows

All cash transactions are summarised in a cash flow statement by grouping each transaction into three categories:

  • Operating Activities: This includes a company’s day-to-day activities that create revenue, such as selling products and services. There are cash outflows and inflows from operating activities. Cash inflows contain cash received from sales and debtors of the company, along with other cash income. Cash outflows contain cash spent or paid to generate sales. It includes transactions such as cash purchases, salary payments, marketing expenses, etc.
  • Investing Activities: This includes purchasing and selling long-term assets and other investments. Cash received and paid for the purchase and sale of buildings, land, machinery, equity shares, and bonds of other companies, etc. The purpose of this activity is to gain benefits in the future.
  • Financing Activities: This includes obtaining or repaying capital such as equity and debt. Cash inflows in this activity include the receipt of cash from issuing stock, bonds, etc. Cash outflows include cash payments to repurchase stock, repay bonds, pay interest & dividends, etc.

What is the Structure of a Statement of Cash Flows?

Let us understand different cashflows in detail by analyzing the consolidated cash flow statement of Avenue Supermarts (DMart):

dmart cash flows | marketfeed

Let us analyse each item in detail:

Cash Flow From Operating Activities

The net cash flow from operating activities is preferably positive in a cash flow statement as a company’s core purpose is to bring in cash flow. All the adjustments regarding the operational cash flow of the company are shown in this section.

cash flow from operating activities | marketfeed

DMart’s cash flow from operating activities is positive, which is a good sign.

Cash Flow From Investing Activities

The net cash flow from investing activities can be negative and still favourable. When a company pushes cash outwards to invest in different assets, it will help them to grow further and generate even more cash flows.

cash flow from investing activities | marketfeed

DMart’s cash flow used in investing activities is negative, meaning that it is investing in different assets. The details under investing activities say that DMart spent ₹2,410 crore to purchase new properties, plants, equipment, etc.

Cash Flow From Financing Activities

The net cash flow from financing activities is favourable to be negative because it means that the company is spending money on its investing activities and the capital that it raised by borrowing money is being paid off.

cash flow from financing activities | marketfeed

DMart’s cash flow used in financing activities is also negative because it paid off a few liabilities.

Net Increase/Decrease in Cash and Cash Equivalents

It represents the sum of all three different cash flow activities in the company. This shows the total net cash that the company paid out or received during the financial year.

Cash and Cash Equivalents at the End of the Year

Net increase/decrease in cash and cash equivalents is subtracted from cash and cash equivalents at the beginning of the year to find the cash and cash equivalents at the end of the year. This will be the actual cash the company has in its bank account.

The final amount of cash that DMart has in its bank account after all the transactions in the previous year is ₹95.12 crore.

Using Cash Flow Statement as a Litmus Test

The data in the cash flow statement can be used to perform a “quality test” on the company. We can understand if the company is generating enough cash flow to sustain its operations. This test can be done by comparing the company with its peers, along with historical data. We can analyze if the net cash flow of the company has been increasing or decreasing over the years and if the cash flow from operating activities keeps on increasing and is positive. Spending cash on investing activities is very important because it increases the company’s ability to generate cash flow in the future. 

By analyzing the previous 10-year data of the three different companies above, we can see that the operating cash flow of DMart has increased over the years, while the operating cash flow of Trent Ltd is not very good.

You can make decisions on whether to study a company by analyzing its cash flow data. You can skip analyzing the company if its cash flow is not good or justifiable. 

What is Free Cash Flow (FCF)?

Apart from net cash flow and details of cash flows from different activities, another important metric that the cash flow statement provides is free cash flow. A free cash flow is the excess operating cash a company generates after accounting for capital expenditures such as buying land, building, and equipment. It is the cash available to a company to repay creditors or pay dividends and interest to investors. Veteran value investor Warren Buffet called it owner’s income and popularised it for stock analysis.

Free cash flow can be calculated using the following formula:

free cash flow formula | marketfeed

DMart’s free cash flow = ₹1,372.35 – ₹2,410,42 = – ₹1,038.07 crore.

Having a negative free cash flow is unfavourable for a company. It means that the firm is not able to generate enough cash from operating activities to meet its capital expenditures.

In this article, we learned what a cash flow statement is and how to analyse it. We also learned how to perform a litmus test to know if it is even worth considering. Make sure to download the cash flow statement of a company and try to understand it.

Categories
Jargons

What is a Balance Sheet?

A company communicates its financial performance to its stakeholders through financial statements. Balance sheet is one of the five financial statements that a company provides. It presents a company’s financial position, i.e. its worth. In this article, we will understand what a balance sheet is, why you should analyse it, its contents and where to find it.

What is a Balance Sheet?

A balance sheet is a financial statement that shows the current financial position of an entity. The balance sheet provides information on a company’s resources (assets) and sources of capital (equity and liabilities/debt) at a given point in time. It shows the net worth of a company. Balance sheet is also known as a statement of financial position or statement of financial condition.

The balance sheet is based on the following equation:

Assets = Liabilities + Capital

Why Should You Analyse a Balance Sheet?

  • A balance sheet contains all details regarding how much a company has and how much it owes to others, which can be used to calculate the company’s net worth.
  • It shows the details of a company’s different assets and the value of each asset.
  • A balance sheet shows the details of a company’s liabilities and how much it owes to others.

Where to Find the Balance Sheet?

You can find a company’s balance sheet from its annual report. An annual report is a company’s yearly report to shareholders, documenting its activities and finances of the previous financial year. It is a 300-400 page document containing all vital information about a company. It is the yearly official communication from the company. The annual report contains information regarding a company’s overall business outlook, industry outlook, financial statements, marketing content, and forward-looking statements.

Standalone vs Consolidated Financial Statements

Companies with subsidiaries have two sets of financial statements in their annual report: 

  • Standalone financial statements: They only include the financials of a company itself and do not include the financials of their subsidiaries. 
  • Consolidated financial statements: They include the financials of a company and its subsidiaries. 

For example, let’s imagine that Company B is a subsidiary of Company A. The standalone financial statements of Company A will only include the transactions of Company A. Meanwhile, a consolidated financial statement includes the transactions of both Company A and Company B.

We always consider the consolidated financial statements because the business transactions of the subsidiary also affect its parent company, as the ownership lies with the company.

What are the Components of a Balance Sheet?

The main components and the structure of a balance sheet are:

balance sheet | marketfeed
Consolidated Balance Sheet of Avenue Supermarts (DMart)

There are two sections in a balance sheet: an asset section and an equity & liabilities section. Even though equity and liabilities are separate components, a balance sheet combines them into a single section named equity and liabilities. We will learn the different elements and their components by analysing the consolidated balance sheet of DMart.

1. Assets 

Assets are anything of value that a company owns and controls. These are the resources available to a company. For example, a plant and machinery that the company uses to produce products is its asset. Assets are classified into two types:

Current Assets

Current assets are those assets held primarily for trading or expected to be sold, used up, or realized in cash within one year. This category also includes assets convertible into cash within one operating cycle. An operating cycle is the time period a company takes to convert its raw materials into finished goods. It includes cash and cash equivalents, inventories, short-term investments, etc.

current assets | marketfeed
  • Inventories are physical products that will eventually be sold to a company’s customers.
  • Financial Assets are liquid assets that get their value from a contractual right or ownership claim. Mutual funds, stocks, cash, etc, are financial assets.
  • Investments represent the amount that a company has invested into various instruments that can be converted to cash within one year or one operating cycle.
  • Trade Receivables refer to the amount that is yet to be received from customers for goods or services sold in credit.
  • Cash and cash equivalents show the amount that a company has in the form of cash. It also includes the cash in a company’s bank accounts.
  • Bank balances other than cash and cash equivalents show the amount of money in banks held as guarantees and commitments. These balances have restrictions on liquidity.
  • Other current financial assets represent all other financial assets that the company holds.
  • Other current assets include all the current assets which do not belong to the above categories.

Total current assets represent the sum of the values of all current assets.

Non-Current Assets (Fixed Assets)

Non-current assets refer to assets not anticipated to be sold or used up within one year or one operating cycle (whichever is greater) of the business. There are two types of fixed assets: 

Tangible assets, such as buildings and machinery, are physical assets that can be seen and touched.

Intangible assets are assets that cannot be seen or touched but are characterised by their impact and value, rather than physical presence. Assets like copyrights, patents, goodwill, etc are intangible assets. These assets are shown after deducting depreciation and amortization. Non-current assets include tangible and intangible assets, capital work in progress, investments, etc.

non-current assets | marketfeed
  • Property, plant, and equipment represent the value of all the properties, plants, equipment, and machinery that a company owns.
  • Capital work-in-progress is the value of tangible fixed assets that are under construction.
  • Right-of-use assets are the assets that a company has leased and has the right to use.
  • Investment properties are the properties that a company has invested in for purposes other than production. It includes properties that the company may buy for capital appreciation.
  • Goodwill is a value addition to the company due to its reputation.
  • Intangible assets are assets that do not have a physical form. It includes computer software, patent rights, etc.
  • Financial assets under non-current investments are the value of financial assets such as stocks, bonds, debentures, etc that a company is planning to hold for more than one year.
  • Income tax assets represent the amount that is to be received as tax refunds, rebates, etc
  • Deferred tax assets represent any amount of tax that has been overpaid or paid in advance, which reduces the future tax liabilities of a company.
  • Other non-current assets represent the value of all non-current assets that are not included in the above categories.

2. Liabilities

Liabilities are what the company owes. It represents the obligations of a company. Bank loans, money owed to creditors, etc are examples of liabilities. Liabilities are further classified into two types:

Current Liabilities

Liabilities expected to be settled within one year or one operating cycle of the business are categorised as current liabilities. An example is loans due for payment within one year.

current liabilities | marketfeed
  • Financial liabilities are contractual obligations that require payment of cash.
    • The lease liability is the amount paid for leases.
    • Trade payables are the amount owed to creditors for credit purchases.
    • Other current financial liabilities are current financial liabilities that are not included in the above categories.
  • Current tax liabilities are the amount payable to tax authorities.
  • Other current liabilities represent all the current liabilities that are not included in the above categories.
  • Provisions in the current liabilities are the amount set aside from profit as provisions to meet future expenses. Warranty is an example of provision.

Non-Current Liabilities

Liabilities projected to be settled over one year or longer, or beyond one operating cycle of the business, are categorized as non-current liabilities. Non-current liabilities include loans with a repayment period of one year or more. It also includes bonds and debentures issued by a company to finance itself. All the items in this category are the same as items from current liabilities except for the duration, which is more than 1 year in the case of non-current liabilities.

Working capital is the surplus of current assets over current liabilities.

3. Equity

Equity represents the owners’ residual interest in a company’s assets after deducting its liabilities. It is commonly known as shareholders’ equity or owner’s equity. Equity is calculated by subtracting a company’s liabilities from its assets. Simply put, equity represents the amount invested by the shareholders of the company. It also includes reserves and surplus of the company. Surplus is the net profit that the company made.

Non-controlling interest is the equity of DMart’s subsidiaries, not owned by DMart. 

In conclusion, a balance sheet tells us what the company is worth. This statement is indispensable for investors, creditors, and management to gauge a firm’s solvency and liquidity. Make sure to download the balance sheet of a company and try to understand what you learned here. 

Categories
Jargons

What is a Statement of Profit & Loss?

A company communicates its financial performance to all stakeholders through financial statements. The statement of profit and loss (P&L) or earnings statement is the first of five statements that a company provides. It presents a company’s financial result, i.e. profit or loss. In this article, we will understand what a statement of profit and loss is, why you should analyse it, its contents and where to find it.

What is a Statement of Profit & Loss?

A statement of profit and loss presents information on the financial results of a company’s business activities over a particular time (usually a quarter or year). It is also known as income statement, P&L statement, statement of operations and earnings statement. The income statement communicates how much revenue a company generated during a period and the costs incurred for generating that revenue. 

The basic equation underlying the income statement is ‘Income – Expense = Profit’.

Where to Find Statement of Profit and Loss?

You can find the statement of P&L from the annual report of a company. An annual report is a company’s yearly report to shareholders, documenting its activities and finances of the previous financial year. It is a 300-400 page document containing all vital information about a company. It is the yearly official communication from a company. The annual report contains information regarding a company’s overall business outlook, industry outlook, financial statements, marketing content, and forward-looking statements.

You can download a company’s annual report from its website or other sources like screeners.

Standalone vs Consolidated Financial Statements

Companies with subsidiaries have two sets of financial statements in their annual reports: standalone financial statements and consolidated financial statements. Standalone financial statements only include the financials of a company itself and do not include the financials of its subsidiaries. On the other hand, consolidated financial statements include the financials of the company and its subsidiaries. 

For example, let’s imagine that Company B is a subsidiary of Company A. The standalone financial statements of Company A will only include the transactions of Company A. Meanwhile, a consolidated financial statement includes the transactions of both Company A and Company B.

We always consider consolidated financial statements as the business transactions of the subsidiary also affect its parent company, as the ownership lies with the company.

Why Should You Analyse the Statement of P&L?

  • To Understand Income Growth: The statement of profit and loss provides all details about the growth in a company’s revenue and income.
  • To Study Expenses: Expenses and other areas where a company spends money can only be analysed from the income statement. We should also compare the expenses of a company to its peers to understand how efficiently it can create revenue.
  • To Understand Profitability and Growth: It is necessary to understand the profitability of a business. The final result of the income statement is the profit/loss. Profitability is a measure of an organisation’s profit relative to its expenses. We should analyse the growth in revenue, profits and expenses to understand if the company is growing.

What are Notes to Accounts?

​​Notes to accounts, also known as footnotes or financial statement notes, are additional explanations, disclosures, and details provided in a company’s financial statements. They accompany the main financial statements (such as the balance sheet, income statement, and cash flow statement) to provide further context, explanations, and additional information that cannot be conveyed in the primary financial statements alone. 

These notes help investors, analysts, and auditors to better understand the company’s financial performance and position. Notes to accounts typically cover topics like accounting policies, contingent liabilities, significant events, changes in accounting methods, and other relevant details to ensure transparency and compliance with accounting standards. They are an integral part of a company’s financial reporting and provide important context to interpret the numbers presented in the primary financial statements.

What are the Components of a Statement of Profit and Loss?

The main components and the structure of a statement of profit and loss are (we’ve taken the example of DMart here):

statement of profit & loss | marketfeed

There are four columns in the income statement. They are particulars, notes, current year financials, and previous year financials. The particulars of the income statement are:

1. Income (Topline)

The first section in the income statement is income or topline. Revenue or turnover generally refers to the amount charged for the delivery of goods or services in the ordinary activities of a business. 

  • Revenue from operations is a company’s revenue from operating activities or its main activities (things a company does to bring its products and services to market). 
  • Other income is the income from non-operating activities (like investment income, gains or losses from foreign exchange, interest income, etc).
  • Total Income is the sum of revenue from operations and other income.

Its respective notes give a detailed breakdown of revenue from operations and other income.

revenue from operations | marketfeed

2. Expenses

Expenses reflect outflows, depletions of assets, and incurrences of liabilities in the course of the activities of a business.

  • Purchase of stock-in-trade contains the expense incurred for the purchase of products that are to be sold and related expenses. Since DMart operates retail outlets, its major expense will be the purchase of stock.
  • Changes in inventories of stock-in-trade are the difference between the amount of the last period’s ending inventory and the amount of the current period’s ending inventory.
inventories | marketfeed
  • Employee benefits expenses are the costs incurred for the benefit of employees. It contains salaries and wages, welfare expenses, etc.
employee benefits expenses | marketfeed
  • Finance costs refer to the cost, interest, and other charges involved in the borrowing of money to build or purchase assets.
finance costs | marketfeed
  • Depreciation and amortization expenses are the expenses incurred due to the loss of value of assets. Depreciation is the reduction in the value of a tangible asset over time due to wear and tear. Amortization is the reduction in the value of intangible assets such as goodwill.
depreciation | marketfeed
  • Other expenses are all the expenses that do not fall within the above categories. 
other expenses | marketfeed

You can go through all the notes to accounts to view the split-up of each cost.

Total expenses are the sum of all the expenses. 

3. Profit Before Tax (PBT)

Profit before tax is the difference between revenue and expenses, but before deducting tax liabilities. PBT = Total Income – Total Expenses.

4. Tax Paid

When a company makes profits, it must pay taxes to the government. This line provides comprehensive details on taxes. Meanwhile, notes to accounts provide in-depth information about all tax expenses. It is not necessary to analyse it.

5. Profit / Loss After Tax

Profit after tax (PAT) or bottom line represents the total profit earned after subtracting all expenses and taxes from revenue.

6. Other Comprehensive Income

In business accounting, revenues, expenses, gains, and losses that are yet to be realized and not included in the net income on an income statement are mentioned under other comprehensive income (OCI). It comprises both net income and other revenue and expense items excluded from the net income calculation.

Foreign currency translation adjustments, unrealised gains or losses on derivatives contracts accounted for as hedges, unrealised holding gains and losses on a certain category of investment securities, and certain costs of a company’s defined benefit post-retirement plans that are not recognised in the current period are the most common items treated as other comprehensive income. It is not necessary to analyse other comprehensive income.

other comprehensive income | marketfeed

7. Profit Attributable to Equity Holders of the Parent and Non-Controlling Interests

The profit after tax in the consolidated income statement includes the financials of the subsidiary companies as well. Meanwhile, non-controlling interest is the portion of a subsidiary company’s stock that is not owned by the parent corporation. It signifies the profit allocated to the other owners of a subsidiary company.

The profit attributable to equity holders of the parent is the profit allocated to the parent company itself.

statement of profit & loss | marketfeed

8. Earnings Per Share (EPS)

Earnings per share is the monetary value of earnings per outstanding share of common stock for a company. It is a key measure of profitability and is commonly used to evaluate stocks. The higher the EPS, the better.  EPS includes retained earnings and dividends. Basic and Diluted EPS are the two types of EPS in the financial statements. 

Basic Earnings Per Share (EPS) is a financial metric that represents a company’s profit allocated to each outstanding common share. It is calculated by dividing the net income by the total number of common shares. Basic EPS provides a straightforward view of a company’s earnings on a per-share basis.

Diluted Earnings Per Share takes into account potential dilution from securities like stock options and convertible bonds. It assumes all such securities are exercised or converted, potentially increasing the number of shares outstanding. Diluted EPS is typically lower than basic EPS, as it considers the impact of potential future share issuances. If the Diluted EPS is higher than the basic EPS, then the diluted EPS will be the basic EPS.

In conclusion, a statement of profit and loss outlines a company’s revenues, expenses, and net profit for a specific time period. This statement is indispensable for investors, creditors, and management to gauge a firm’s profitability. Make sure to download the income statement of a company and try to understand what you learned here!

Categories
Jargons

What are Credit Ratings? Why Do We Need Them?

Credit ratings play an important role in the world of finance. It indicates the safety or risks associated with different securities (stocks, fixed-income securities like bonds, etc.) and their issuers. It provides crucial insights into the world of investments. In this article, we will discover what credit ratings are, how they work, and their role in the financial markets. We will also explore the different credit rating agencies and their credit ratings.

What are Credit Ratings?

A credit rating is an assessment of the creditworthiness of a borrower, whether it’s an individual, a corporation, or a government.  It is a symbol assigned to a security or issuer that represents its creditworthiness or safety. Credit rating agencies (CRAs) are responsible for assigning these ratings. Their primary goal is to provide a standardised evaluation of credit risk, which allows lenders and investors to make informed decisions regarding lending or investing in debt securities.

Credit ratings are generally expressed as letter grades, such as “AAA,” “BBB,” or “C.” Each rating corresponds to a level of credit risk and reliability. The specific rating scale may vary slightly between different credit rating agencies, but the core principles remain the same. The three major global credit rating agencies (CRAs) – Moody’s, S&P, and Fitch use similar, symbol-based ratings to assess a bond issue’s risk of default.

The chart given below ranks the long-term ratings of CRAs from highest to lowest.:

credit ratings table | marketfeed

Bonds with high-quality grade ratings are the safest and carry lower interest rates. On the other hand, low-grade or speculative-grade issues are the riskiest and carry high interest rates as they involve greater risk. Credit rating agencies assign default ratings to bonds that have defaulted on their payment obligations.

Moreover, rating agencies will typically provide outlooks on their respective ratings. The outlook can be positive, stable, or negative. They may also offer additional signals about the possible future direction of their ratings, like indicating that a bond is ‘On Review for Downgrade’ or ‘On Credit Watch for an Upgrade’.

What is Credit Risk?

Credit risk is the risk of loss resulting from the issuer’s failure to make full and timely payments of interest and/or principal. Credit risk has two components:

1. Default Risk/Default Probability: It is the probability that a borrower defaults. A borrower is said to be in default if they fail to make full and timely payment of principal and interest as per the terms of the debt security. 

2. Loss Severity: The second component is the loss severity in the event of default. It is the portion of a bond’s value (including unpaid interest) an investor loses. A default can lead to losses of various magnitudes.

You can summarize the credit risk of a security or issuer as the expected loss.

Expected loss = Default probability × Loss severity

You can express the expected loss either as a monetary amount (e.g., ₹4,50,000) or as a percentage of the principal amount (e.g., 45%).

What are Credit Rating Agencies?

Credit Rating Agencies (CRAs) are independent entities that assess and assign credit ratings to various debt issuers and their securities. These agencies provide valuable insights into the creditworthiness of governments, corporations, and other entities. 

CRAs are independent organisations, which means that they are separate from the entities they rate. These agencies must be independent to avoid conflict of interest. They evaluate the issuer based on various criteria and assign a credit rating. The rating symbols vary depending on the rating agency. Moody’s, Standard & Poor’s (S&P), Fitch Ratings, Credit CRISIL, CARE, and ICRA are among the top credit rating agencies.

Common Credit Rating Categories

Here are some of the common credit rating categories:

  1. Investment Grade:
    • AAA (or Aaa): The highest credit quality with the lowest risk of default.
    • AA (or Aa): High credit quality with a very low risk of default.
    • A: Good credit quality with a low risk of default.
    • BBB (or Baa): Adequate credit quality with a moderate risk of default.
  2. Speculative Grade (or Non-Investment Grade):
    • BB: Speculative credit quality with a moderate risk of default.
    • B: Highly speculative credit quality with a significant risk of default.
    • CCC: Substantial credit risk with a high risk of default.
    • D: In default or near default.

How Do CRAs Assign Credit Ratings?

Credit rating agencies evaluate both quantitative and qualitative aspects of borrowers, including:

  • Financial Statements: They review financial statements such as balance sheets, income statements, and cash flow statements to assess the financial health and stability of the borrower.
  • Credit History: CRAs analyse the credit history of individuals and the repayment history of corporations and governments to assess their ability to meet financial obligations.
  • Economic and Industry Factors: Agencies consider the broader economic environment and the specific industry or sector in which the borrower operates to understand the challenges and growth opportunities it may face.
  • Debt Structure: CRAs examine the structure of the borrower’s debt, including the types of debt securities issued and their terms to evaluate repayment capacity.
  • Market Conditions: Current market conditions and trends, including interest rates and inflation, are considered to assess potential risks.
  • Management and Governance: Credit rating agencies scrutinize the quality of management and governance practices of corporations to understand how effectively the entity is managed.

After analysing these factors, credit rating agencies assign a rating that reflects the borrower’s creditworthiness and likelihood of default. The specific rating categories can vary between agencies, but they generally follow a similar pattern.

How do Credit Ratings Affect Borrowing Costs?

Lenders and investors consider borrowers with higher credit ratings as less risky. As a result, they can access loans and credit at lower interest rates. Meanwhile, borrowers with lower credit ratings are considered riskier. So lenders charge higher interest rates to compensate for the increased risk. Entities with better credit ratings pay lower interest rates on their debt.

For example, a bond with an AAA rating will have lower interest rates, compared to a BBB-rated bond (if all other factors remain the same).

Why are Credit Ratings Important?

  • Risk Assessment: Credit ratings help investors and lenders assess the credit risk associated with a particular borrower. A higher credit rating indicates lower risk, while a lower rating suggests higher risk.
  • Pricing of Debt: Borrowers with better credit ratings can access credit (loans) at lower interest rates because they are considered less risky. Meanwhile, borrowers with lower ratings may face higher borrowing costs.
  • Investment Decisions: Investors, including individuals, mutual funds, and institutional investors, use credit ratings to make informed decisions about investing in debt securities. Investors often consider higher-rated securities as safer investments.
  • Regulatory Compliance: Many financial institutions and regulations require a minimum credit rating for certain types of investments or transactions to ensure a level of risk management.
  • Risk Diversification: Credit ratings help diversify risk in investment portfolios by allowing investors to allocate funds to securities with varying risk levels.

What are the Risks of Relying on Credit Ratings?

  • Credit rating agencies are paid by the companies and governments that they rate. This can create a conflict of interest, as the agencies may be incentivized to give higher ratings to their clients.
  • CRAs can make mistakes, and these mistakes can have a significant impact on investors. For example, in 2008, Standard & Poor’s gave high ratings to many mortgage-backed securities in the US that later defaulted. This led to billions of dollars in losses for investors.
  • These agencies are not required to disclose their rating methodologies. This makes it difficult for investors to assess the accuracy of their ratings.
  • Credit ratings tend to lag the market’s pricing of credit risk.

It’s important to note that investors should use credit ratings in combination with other factors, especially their own research & analysis, while making investment decisions.

In conclusion, credit ratings are essential tools in the financial world, providing a standardized way to assess credit risk and make informed investment and lending decisions. Whether you’re an investor looking to diversify your portfolio or a borrower seeking to access capital, understanding credit ratings is key to navigating the complex landscape of finance.

Categories
Jargons

What are Bonds?

Bonds are a type of fixed-income security that plays a crucial role in the world of financial markets. They are often considered a stable and reliable investment option, especially for risk-averse investors. In this article, we will discover what bonds are, their different types, and how they work.

What are Bonds?

A bond is a debt/fixed-income instrument issued by various entities to raise capital. It is a contractual agreement between the issuer and bondholders. Under the agreement, the issuer borrows money from the investor and agrees to repay the principal (face value), plus interest, at a specified future date. Fixed-income securities are the largest source of capital for governments, not-for-profit organisations, and other entities that do not issue equity.

Bondholders have a higher right to receive interest payments and repayment of principal than equity shareholders. So if a company goes bankrupt, bondholders will be paid back before equity shareholders.

Basic Terms Related to Bonds:

To understand how bonds work, you need to know a few terminologies related to bonds: 

1. Issuer: It is the entity that sells or issues the bond to investors. Bonds can be issued by Central Governments, non-sovereign (local) governments (such as municipalities), supranational organisations (such as the World Bank), quasi-govt entities (i.e., agencies that are owned or sponsored by governments) such as postal services, corporations (such as Reliance Industries), and special legal entities (entities that issue asset-backed securities).

2. Principal or Face Value: It is the amount that the issuer agrees to repay the bondholders on the maturity date. This amount is also known as the par value, face value, nominal value, redemption value, or maturity value. Bonds can have any par value.

3. Coupon Rate: The coupon rate or nominal rate of a bond is the interest rate that the issuer agrees to pay investors each year until the maturity date. The annual amount of interest payments made is called the coupon. For example, a bond with a par value of ₹1,00,000 and a coupon rate of 6% pays ₹6,000 in annual interest or coupon.

4. Coupon Frequency: It is the frequency of interest payments in a year. Coupons may be paid annually, quarterly, half-yearly or monthly. A bond paying quarterly coupons has a coupon frequency of 4.

5. Maturity Date: It is the date on which the issuer is obligated to redeem the bond by paying the outstanding principal amount. The tenor is the time remaining until the bond’s maturity date. Bond maturity can range from less than a year to more than 30 years.

What are Bond Yields?

Coupon represents the interest payments an issuer makes. In the above example, the bond pays 6% annually on the principal, meaning that the return will be 6% a year. However, in reality, the bond may not always be issued at the par value. It can be issued at a discount to the par value.

For example, a 1-year bond with a par value of ₹1,00,000 and a coupon rate of 6% issued at a discount of 2% will be initially sold at ₹98,000. The bond will pay ₹1,00,000 on maturity, providing the investor with a capital gain of ₹2,000. Yield includes the returns on capital gain and the coupon payments. The above bond’s yield will be ~8.16%.

What are Bond Indentures?

A Bond Indenture is a legal and binding contract or agreement between a bond issuer and the bondholders. It outlines the terms and conditions of bond issuance, as well as the rights and responsibilities of both parties. Bond indentures are essential for ensuring clarity and transparency in the bond market and protecting the interests of bondholders.

Key Elements in a Bond Indenture:

1. Issuer Information: This section identifies the entity or organisation issuing the bonds. It includes details such as the issuer’s name, address, and legal status.

2. Bond Terms: The indenture specifies the details of the bonds being issued, including their face value, maturity date, interest rate (coupon rate), and the frequency of interest payments (e.g., semi-annual).

3. Covenants: These are restrictions or obligations that the issuer must adhere to. The covenants can be either affirmative (things the issuer must do) or negative (things the issuer must not do). Common covenants might include limitations on the issuer’s ability to take on additional debt, restrictions on the sale of assets, or requirements to maintain certain financial ratios.

4. Security Provisions: If the bonds are secured, the indenture will detail the collateral or assets that back the bonds. This provides a level of security for bondholders in case the issuer defaults.

6. Default and Remedies: The indenture outlines the conditions under which a default is considered to have occurred and the remedies available to bondholders in such cases. Remedies may include acceleration of the bond’s maturity or the appointment of a trustee to represent bondholders.

7. Payment Terms: The indenture specifies how and when bondholders will receive their interest payments and the process for redeeming the bonds at maturity.

8. Trustee: A trustee is appointed to represent the interests of bondholders. The trustee’s responsibilities may include monitoring the issuer’s compliance with the indenture terms, ensuring timely payments to bondholders, and taking action in the event of a default.

9. Call & Redemption Provisions: If the issuer has the right to redeem (call) the bonds before their maturity date, the terms for such calls are outlined in the indenture. This may include call prices and notification procedures.

How Do Bonds Work?

Here is a basic outline of how a bond works:

1. Issuance of Bonds: When an entity wants to raise capital through debt, it issues bonds. Investors purchase these bonds, essentially lending money to the issuer. In return, the issuer promises to pay periodic interest (coupon payments) and return the principal amount (face value) upon the bond’s maturity.

2. Bond Pricing: The price of a bond can fluctuate in the secondary market. If the bond’s price is higher than its face value, it is trading at a premium. If it’s lower, it’s trading at a discount. The bond’s price is influenced by changes in interest rates, the issuer’s creditworthiness, and time to maturity (tenor).

3. Coupon Payments: The bond issuer makes periodic interest payments to bondholders. These payments are typically made semi-annually based on the bond’s coupon rate, which is expressed as a percentage of the bond’s face value.

4. Bond Maturity: On the maturity date, the issuer retires (cancels) the bond by repaying the principal and pending interests. Maturity periods can vary widely, from short-term bonds with maturities of less than a year to long-term bonds with maturities of 30 years or more.

What are the Different Types of Bonds?


There are many different types of bonds, but they can be broadly categorized into three main groups:

  • Government bonds: These bonds are issued by governments to raise money to finance their operations. Government bonds are considered to be very safe investments, as they are backed by the full faith and credit of the issuing government. To learn more about the Government Securities Market in India, click here.
  • Corporate bonds: These bonds are issued by corporations to raise money to finance their operations or to expand their businesses. Corporate bonds are riskier than government bonds, as they are backed by the assets and earnings of the issuing corporation.
  • Municipal bonds: These bonds are issued by state and local governments to finance public projects, such as schools, roads, and bridges. Municipal bonds are typically exempt from federal income tax, making them a popular investment for high-income taxpayers.

Other Types of Bonds:

1. Zero-coupon bonds: These bonds do not pay regular interest but are sold at a discount to their face value. Investors receive the face value at maturity, which makes them attractive for long-term investors.

2. High-yield bonds: These bonds are also known as junk bonds and are issued by corporations with poor credit ratings. High-yield bonds offer higher interest rates than investment-grade bonds, but they are also riskier.

3. Convertible Bonds: These bonds can be converted into shares of the issuing company’s stock at a predetermined price.

4. Floating-rate bonds: These bonds have interest rates that reset periodically, typically every quarter or six months.

Benefits of Investing in Bonds

The benefits of investing in bonds are:

  • Income generation: Bonds typically pay interest regularly (monthly, quarterly, or annually), which can provide investors with a steady stream of income. This can be especially beneficial for retirees or investors who need to generate income from their investments.
  • Capital preservation: When you invest in bonds, you receive the assurance that the issuer will return the bond’s face value at maturity. High-quality bonds are generally considered low-risk and are often used to preserve capital. They can be a safety haven/cushion during times of economic uncertainty.
  • Diversification: Bonds can help to diversify an investment portfolio and reduce overall risk. This is because bonds tend to perform differently than stocks, so they can help offset losses in the stock market.
  • Lower Volatility: While bonds can carry some risk, they are typically less volatile than stocks. They provide stability to a diversified portfolio.
  • Tax Advantages: Tax saving bonds enjoy special privileges under Section 80CCF of the Income Tax Act which states that individuals enjoy tax deductions up to ₹20,000 on the bonds owned by them.

Risks Associated with Bonds

While bonds offer numerous benefits, it’s essential to be aware of the risks:

  • Interest Rate Risk: Interest rates can fluctuate over time. When interest rates rise, the value of existing bonds can fall. This is because investors can buy new bonds with higher interest rates, making existing bonds with lower interest rates less attractive.
  • Credit Risk: It is the risk that the issuer may default on interest payments or fail to repay the bond’s face value at maturity. A bondholder may lose money if the issuer encounters financial difficulties or goes bankrupt. Credit risk is higher for corporate bonds than for government bonds, as corporations are more likely to go bankrupt than governments. Rating agencies provide insights into a bond issuer’s creditworthiness.
  • Inflation risk: Inflation is the rate at which prices for goods and services are rising. It erodes the real value of fixed-interest payments. If inflation is higher than the interest rate on a bond, the bondholder will lose money over time.
  • Liquidity risk: It is the risk that investors may not be able to sell their bonds quickly or at a fair price. Liquidity risk is higher for less common types of bonds, such as high-yield (junk) bonds and municipal bonds.

What are Bond Ratings?

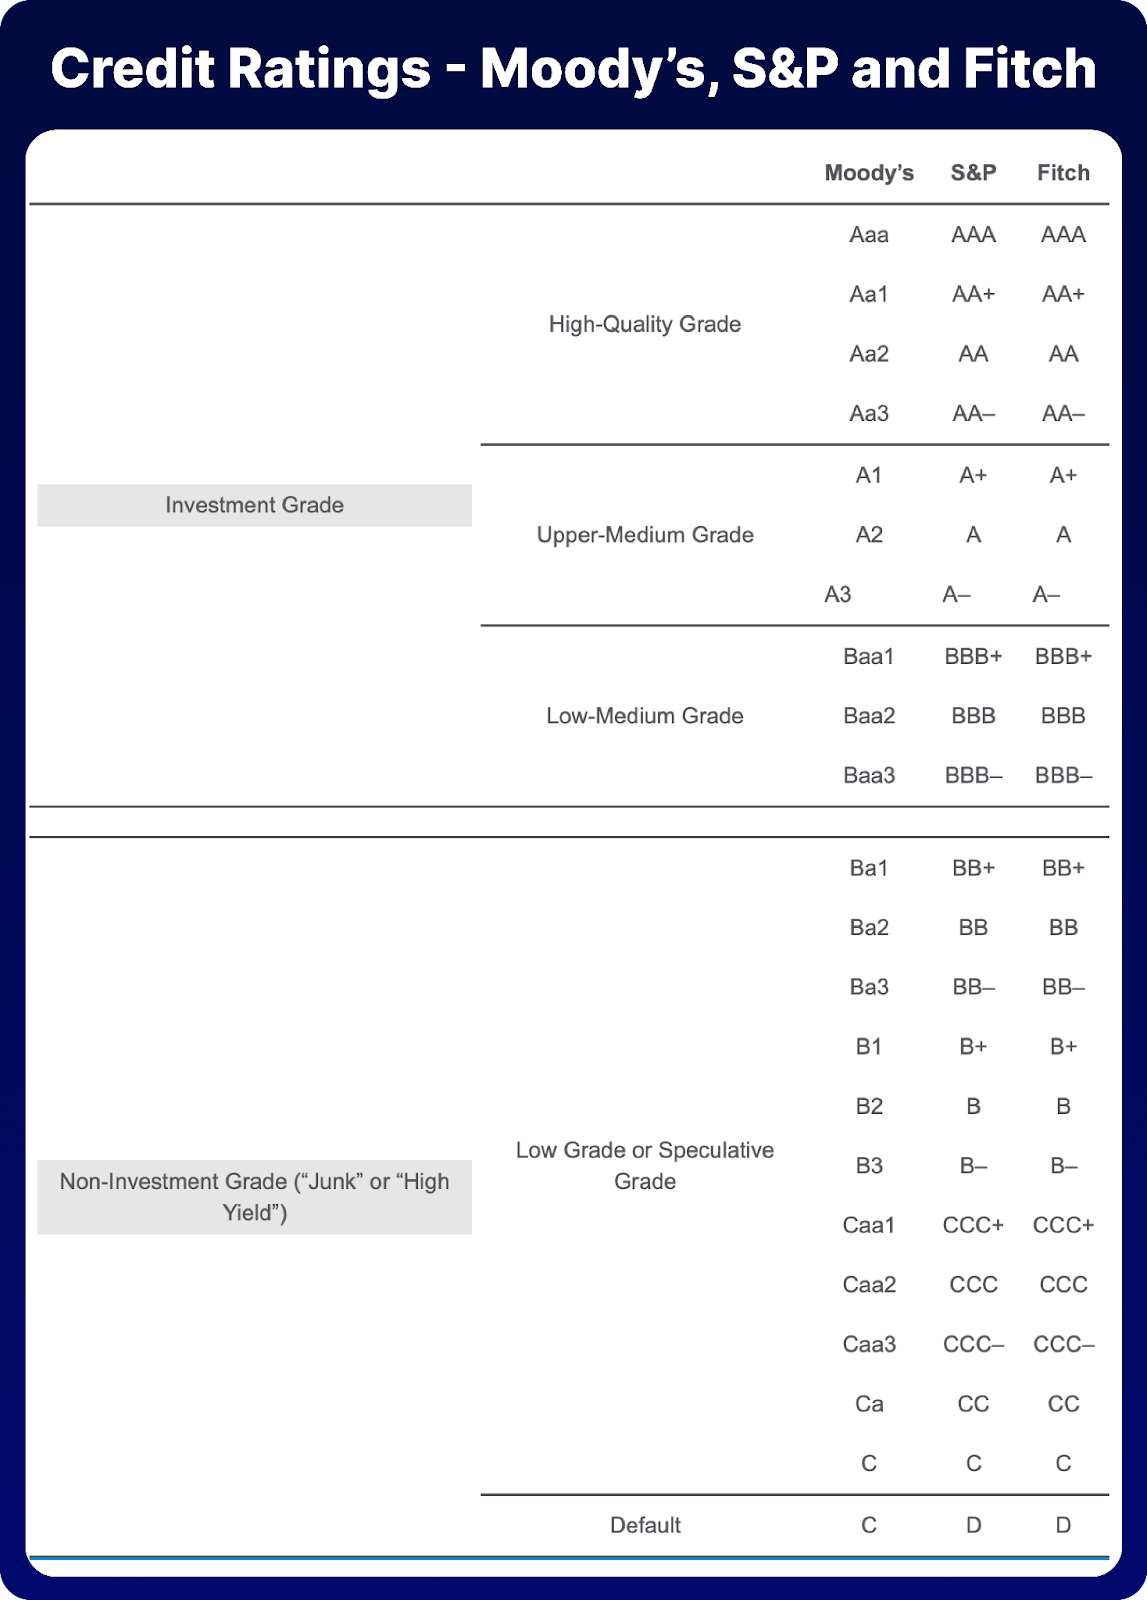
Bond ratings are a measure of the creditworthiness of a bond issuer. It indicates the issuer’s ability to meet its interest and principal payment obligations. Credit rating agencies such as Moody’s, Standard & Poor’s, and Fitch assign these ratings. It helps investors understand the risk associated with a particular bond.

Credit rating agencies use a variety of factors to assess the creditworthiness of a bond issuer, including its:

  • Financial strength
  • Industry and competitive landscape
  • Management team
  • Debt levels
  • Future cash flow prospects

Investment-Grade Bonds: These bonds have higher credit ratings, typically ranging from AAA to BBB- (S&P and Fitch) or Aaa to Baa3 (Moody’s).

Junk Bonds: They are also known as high-yield or speculative-grade bonds. Junk Bonds have lower credit ratings, often rated BB+ and below (S&P and Fitch) or Ba1 and below (Moody’s). They carry higher risk due to the issuer’s weaker financial condition.

How Do Bond Ratings Impact Bond Prices?

Investment-grade bonds tend to have higher prices and lower yields because of their lower perceived risk. Investors are willing to accept lower returns for greater safety. On the other hand, junk bonds generally have lower prices and higher yields. To compensate for the higher risk, investors require more significant returns, which results in lower bond prices.

In conclusion, investing in bonds can be a great way to diversify your investment portfolio. However, bonds typically have a high minimum investment, making them unsuitable for retail investors. You can invest in debt mutual funds to gain indirect exposure to the bond markets. You can also invest directly in bonds through your broker (Zerodha, Groww, Fyers, etc).

Categories
Jargons

What are Hedge Funds? AIFs Explained!

Have you ever wondered what hedge funds are and why they keep making headlines in the world of finance? While the term “hedge fund” may sound complex, fear not, because we’re here to break it down in the simplest way possible. In India, hedge funds are known as Alternative Investment Funds (AIFs). In this article, we will understand what hedge funds or AIFs are and their characteristics. We will also explore the different types of hedge funds.

What are Hedge Funds?

A hedge fund is a pooled investment vehicle like a mutual fund. However, there’s a key difference – hedge funds are private and not open to everyone like mutual funds are. Hedge funds are distinguished by their investment approach rather than the underlying investments. They combine traditional debt and equity instruments with leverage, derivatives, short selling, and other strategies to generate and enhance their returns. The objective of a hedge fund is to generate high returns.

Hedge funds are typically structured as limited partnerships or trusts. These funds have a dedicated professional fund manager who assumes the role of a general partner (GP) in the partnership. The rest of the investors will be Limited Partners (LPs) in the fund. The GP will have comparatively less investment in the fund. 

Hedge Fund Fees or Charges

The General Partner is entitled to management fees and performance fees. The percentage of fees depends on the individual fund, however, “2 and 20” is a common fee structure among hedge funds. In a “2 and 20” structure, the fund manager charges a 2% management fee annually on the Asset Under Management (AUM) and a 20% performance fee on the profits generated. A “1 and 10” fee structure is also common, wherein a 1% management fee and 10% performance fee are charged.

Characteristics of Hedge Funds

Here are a few characteristics that set hedge funds apart from other asset managers:

Investment in Alternative Assets

Traditional investments usually involve buying and holding publicly traded stocks and bonds for the long term. On the other hand, alternative investments are a bit more diverse. They can include both long positions (buying assets with the hope they’ll increase in value) and short positions (betting that assets will decrease in value) in various things like publicly traded and private stocks, debt, commodities, currencies, and financial contracts (derivatives).

Hedge funds typically invest in alternative assets although they can invest in traditional assets. However, it’s important to note that investing in these alternative assets can be riskier compared to the more conventional investment options.

Short Positions

Hedge funds have a unique advantage over mutual funds– they can engage in short selling of securities and other assets. This means that they can bet on the value of an asset going down. In contrast, mutual funds cannot short securities due to the risk of potentially incurring unlimited losses. When you take a short position, the chance of losing your entire investment is higher, making it riskier compared to traditional investing where you hope the value of assets will rise.

Private Ownership

Hedge funds operate as privately owned entities, organized in the form of partnerships or trusts. Unlike many other investment firms and asset management companies that are usually publicly traded and welcome external investors, hedge funds have a more exclusive setup.

In a hedge fund, you’ll typically find a small group of wealthy individuals, often referred to as ultra high net-worth individuals (UHNIs) or high net-worth individuals (HNIs), along with a professional fund manager. These funds usually have restrictions on allowing outside investors to join in. However, they may occasionally permit the addition of new investors as long as it aligns with the terms laid out in their partnership agreement.

Complex and Aggressive Strategies

Hedge funds deploy complex investment strategies such as arbitrages. These complex strategies demand substantial capital commitments and often involve extended periods during which investors must keep their money locked into the fund.

Less Legal & Regulatory Constraints

Hedge funds are not subject to the same strict rules and regulations as other types of investment funds, such as mutual funds. This is because hedge funds are generally considered to be sophisticated investments that are only suitable for accredited investors. Accredited investors are individuals or institutions with a high net worth or income, and they are assumed to be able to understand and bear the risks associated with hedge fund investing.

Types of Hedge Funds

Hedge funds are typically classified by strategy. A general classification includes five broad categories of strategies:

Equity Hedge Funds

Equity hedge funds are actively involved in the public equity markets, where they engage in both long and short positions. They bet on some stocks to go up and others to go down. Many of these equity hedge strategies follow a “bottom-up” approach, which means they start by thoroughly analyzing individual companies. After that, they move on to assessing the specific industry the company belongs to and then take a broader view by analyzing the overall market. The goal is to maintain a relatively balanced mix of long and short positions to manage risk and seek returns.

Event-Driven Hedge Funds

The even-driven strategy also uses a bottom-up approach and seeks to profit from defined events that are expected to change valuations. These strategies focus on identifying and capitalising on specific events that have the potential to impact a company’s valuation significantly. These events can include things like acquisitions, corporate restructurings, or other major developments that can influence how the market values a company.

Event-driven strategies often include a mix of long and short positions in various financial instruments, including common and preferred stocks, debt securities, and options. The objective is to strategically position investments to take advantage of the expected changes in valuations resulting from these significant corporate events.

Relative Value Hedge Funds

Relative value strategies are designed to capitalize on pricing differences between related securities, particularly when these differences deviate from their typical short-term relationships. The core assumption behind these strategies is that the short-term pricing gap will eventually correct itself. Arbitrage trading, a key component of relative value strategies, involves identifying and exploiting such pricing anomalies to generate profits.

Opportunistic Hedge Funds

Opportunistic hedge funds have a primary focus on macroeconomic events and commodity trading. Their investment strategies revolve around seizing opportunities presented by large-scale economic developments and movements in the commodity markets. In pursuit of their objectives, these funds may frequently employ index Exchange-Traded Fund (ETF) securities and derivatives, to take advantage of these broader market trends.

How Do Hedge Funds Make Money?

Partners in a hedge fund contribute capital with which the fund manager makes investments. The hedge fund generates income through two primary sources:

  1. Management Fees: Clients are charged annual management fees based on the total value of their investments, known as Assets Under Management (AUM). These fees compensate the fund manager for their services and oversight of the fund’s investments.
  2. Performance Fees: In addition to management fees, hedge funds often levy a performance fee. This fee is calculated based on the fund’s annual returns. It rewards the fund manager when the fund’s performance surpasses a specified benchmark or target, aligning the manager’s interests with those of the investors.

This helps sustain the operations of the hedge fund, while also incentivizing the manager to strive for strong investment performance.

Hedge Fund Indices

Hedge fund indices indicate the returns achieved by hedge funds. Several research organizations curate databases of hedge fund performance data and consolidate this information into indices. These database indices are designed to depict hedge fund performance either on a wide global scale (representing hedge funds in general) or at a more detailed strategy level. Typically, these indices feature an equal-weighted methodology, which means that they represent the performance of various hedge funds within a particular database without giving more importance to larger funds. This approach provides a snapshot of how hedge funds (both collectively and by strategy) are performing in the market.

You can view the data of Barclays hedge fund indexes here.

Hedge Funds vs Mutual Funds

Although mutual funds and hedge funds share the common goal of investing clients’ money to generate returns, they have some significant differences that set them apart. These distinctions can impact the way they operate and the risk and reward profiles they offer to investors. Here are some of the major differences:

Hedge FundsMutual Funds
Risk LevelHigh risk due to non-traditional and complex investment strategiesComparatively low risk
Minimum Investment₹1 croreAs low as ₹100
RegulationRequires only periodic disclosure to investorsSubject to strict regulatory oversight and disclosure requirements.
Investment StrategiesLong and short investments in private and public equities, debt, derivatives, currencies, etcOnly long investments in equities and debt
Short-selling AllowedNot Allowed
InvestorsHNIs, banks, institutionsAny domestic investor
FeesHighLow
Fund Manager ParticipationThe fund manager has investments in the fundThe fund manager may or may not have investments in the fund

Hedge Fund Taxation

Mutual funds are considered pass-through investments, which means that the income they generate is taxed in the hands of the individual investors, and not at the fund level. This means that investors are personally responsible for reporting and paying taxes on any capital gains, dividends, or interest income they receive from the mutual fund.

On the other hand, hedge funds do not enjoy pass-through tax status. Income generated by a hedge fund is typically taxed at the fund level, often at the fund’s own tax rate. This can have implications for how income is distributed to investors and may result in different tax treatment for investors in hedge funds compared to those in mutual funds. It’s important to note that tax laws and regulations can vary by jurisdiction, and the specific tax treatment of mutual funds and hedge funds may differ depending on local tax laws and fund structures.

Hedge fund taxation in India falls under tax regulations for Alternative Investment Funds (AIFs). Annual earnings exceeding ₹5 crore are subject to a tax rate of 42.74%.

Examples of Hedge Funds In India

Motilal Oswal’s offshore hedge fund, Munoth Hedge Fund, Quant First Alternative Investment Trust, IIFL Opportunities Fund, India Zen Fund, Edelweiss Alternative Asset Advisors, etc are examples of hedge funds in India.

Hedge funds in India are not as well-known as their counterparts in the United States and other developed countries. This is because the hedge fund industry in India is still relatively new.

Hedge Fund Regulation in India

In India, hedge funds are classified as category III Alternative Investment Funds (AIFs). These funds operate under the Securities & Exchange Board of India (Alternative Investment Funds) Regulations, 2012.

In conclusion, hedge funds are private pooled investment funds. However, it is out of reach for retail investors due to the high capital requirements. High tax implications and a non-pass-through model are also deterrents.

Categories
Algo Trading

What are the Benefits of Algo Trading?

Before diving into the benefits, let’s understand what algo trading is all about! Algo trading is a method of executing orders in financial markets (stocks, currencies, commodities, derivatives, etc.) by providing a predefined set of rules to a computer program. As in any industry, computers also play an important role in the stock market. Algorithmic trading, commonly referred to as “algo trading,” is a product of the expanding capabilities of technology. 

Algo trading involves turning a trading strategy into computer code to buy and sell shares or trade in derivatives (F&O) automatically, quickly, and accurately. It has gained a lot of popularity worldwide due to its speed and accuracy. You can connect your broker with an algo trading platform to place trade orders once you’ve coded your trading strategy. 

What are the Benefits of Algo Trading?

A few of the benefits of algo trading are as follows:

1. Reduced Human Errors

Algo trading has eliminated human errors from trading and made it systematic. It helps avoid mistakes such as wrong inputs and poor judgments due to human emotions and psychological factors.

2. Speed and Efficiency

The prime benefit of algorithmic trading is speed. The orders are carried out in a fraction of a second, which is impossible for a person to do. This enables timely responses to market changes without delay.

3. Accuracy

Algorithms can process large volumes of data and recognise patterns that human traders might overlook. This results in more accurate trading decisions than human traders. Since algo trading can carry out transactions that would be almost impossible for a person to execute, the overall profits are higher. Price fluctuations are also minimised due to the execution speed and accuracy.

4. Diversification

Algo trading enables traders to diversify their portfolios across multiple assets and markets, helping them reduce overall risk exposure. Automated systems can manage multiple trades simultaneously. This allows traders to spread their investments across different strategies, asset classes, geographical regions, and industries.

5. Liquidity

Algo trading contributes to the market’s increased liquidity as it enables you to trade large volumes of shares in a short period.

Factors to Consider Before Doing Algo Trading

The following are the factors to consider before starting algo trading:

1. Improper Execution

Algorithmic trading depends on quick trade execution times and little latency, or the time it takes for a trade to be executed. Improper execution of a trade might lead to missed chances or big losses.

2. Technology Dependant

Algorithmic trading is dependent on technology, notably computer programs and fast internet connections. Technical problems or malfunctions can disrupt trading operations and lead to losses. You might lose a significant sum of money on a single transaction due to a single algorithmic error or technical glitches.

3. Over-Optimisation

Over-optimizing (or over-perfecting) algorithms based on past data might make them work poorly in actual market situations. Even if algos perform well in backtests, they might not adjust effectively to real-world markets. So, over-optimizing strategies can lead to bad trading performance.

4. High Costs

Developing and putting algorithmic trading systems into operation may be expensive, and traders may have to pay continuing costs for software and data feeds.

5. Black Swan Events

To forecast future market movements, algo trading uses historical data and statistical models. However, algo traders could be prone to unanticipated market disturbances known as “black swan events,” which can lead to losses.

In order to open and close trades based on computer code, algo trading combines financial markets with software. Investors and traders can set when they want trades opened or closed. Algorithmic trading is widely used in today’s financial markets with a wide range of strategies available to traders. 

In conclusion, algorithmic trading helps you become more profitable via trading in the stock market.  However, it consists of dangers and challenges such as computational errors, system failure, and interrupted internet connections.  Before engaging in algo trading, you should have knowledge of stock market trading through the use of technical analysis tools. You also need to have a lot of patience, do market research, code algorithms, and backtest your strategy to use this method of trading to its full advantage.

Also read: What is Algo Trading and How Does it Work?

  1. What is algo trading?

    Algo trading is a method of using computer programs and mathematical models to make trading decisions in financial markets, execute orders, and manage portfolios automatically. There’s no need for human intervention!

  2. What are the factors to consider while doing algo trading?

    An algo trader may face risks associated with coding errors, cybersecurity threats, and black swan events. They may also face issues related to the over-optimisation of trading strategies and high costs. Traders must navigate regulatory compliance, manage market impact, and address latency issues.

  3. What technology do we need for algo trading?

    Algo trading relies on powerful computers, low-latency networks, specialised software, and reliable data feeds. Cloud computing, co-location services, and advanced analytics tools can enhance performance and strategy development. 

Categories
Algo Trading

What is Algo Trading? History, Benefits Explained!

Algorithmic trading or algo trading has become a popular buzzword in the financial markets over the past few years. It has revolutionised the way people trade. The combination of financial knowledge and computer programs has resulted in faster and more accurate trade executions. In this article, we will help you understand what algo trading is and how it works. We will also discuss the advantages and risks of algo trading in India.

What is Algo Trading?

Algo trading is a method of executing orders in the financial markets (stocks, currencies, commodities, derivatives, etc.) using automated or pre-programmed trading instructions. The ‘algorithm’ places orders based on specific rules and criteria. These criteria include price, timing, and quantity instructions. The trading algorithm follows the instructions to identify opportunities in the market and executes orders when the conditions are satisfied.

Algo trading removes human emotions from the equation. Therefore, it helps avoid manual decision-making and human errors. 

What is an Algorithm?

An algorithm is a set of instructions/directions for solving a problem. It’s a step-by-step process that helps us solve problems or make decisions. These programs or algorithms operate faster than humans and make decisions at lightning-fast speeds. It is a seamless integration of technology and finance.

Brief History of Algo Trading

Algo trading has a rich history, dating back several decades. It gained significant momentum with advancements in technology, which allowed for faster and more complex algorithms.

It all started in the 1970s when computerised trading systems emerged in the American financial markets. In 1976, the New York Stock Exchange (NYSE) introduced an electronic trading system, which traders loved and accepted quickly.

An author named Michael Lewis played a significant role in popularising algorithmic trading. He brought it to the attention of both market traders and the public through his writings, especially when he talked about high-frequency algorithmic trading (HFT). In the US stock market and many other developed financial markets, about 60-75% of the overall trading volume is now generated through algo trading.

In 2008, algo trading got the green light from SEBI (India’s market regulator), and Direct Market Access (DMA) was introduced. DMA gives direct access to the electronic facilities and order books of the stock exchanges to execute trades. This opened the doors to high-frequency trading (HFT) in Indian stock exchanges, allowing more traders to participate actively in the market. But the real game-changer came in 2010 when large institutional brokers were permitted to co-locate their trading servers on the exchange premises. This tiny advantage of a millisecond gave them an edge over regular investors.

Click here to learn more about co-location.

How Does Algo Trading Work?

Algo trading is a complex process that involves many steps and processes. However, a basic outline of how algo trading works is given below:

1. Developing a Strategy

The first step in algo trading is to develop a trading strategy. Traders can create and develop strategies based on technical, fundamental, and quantitative analysis. Moreover, in recent times, traders have been using Artificial Intelligence (AI) and Machine Learning (ML) for sentimental and qualitative analysis. Historical patterns, indicator signals, price behaviour, etc., are also analysed to create strategies. 

2. Writing the Algorithm

Once the strategy is developed, the next step is to convert it into a form that computers understand. Data scientists or traders write algorithms or codes that translate the strategy. Programming languages such as Python, C++, and Java are used to write algorithms for algo trading.

3. Backtesting

Before deploying an algorithm in live markets, traders backtest it on historical data. This means that the trading strategy gets simulated or replicated in the past market. Backtesting is necessary to understand its performance in the past. This step is based on the technical analysis principle that “history tends to repeat itself”. 

However, past performance is never a guarantee of future performance. The backtesting provides different metrics such as the total return, average monthly return, standard deviation of returns, etc. [Here, deviation is nothing but a difference in the actual returns and the expected returns.] Traders make multiple optimisations and revisions before deploying the strategy in live markets.

4. Connectivity

An Application Programming Interface (API) establishes an online connection between a data provider and an end user. An API connects the algo trading system to a trading platform/broker. It is essential to implement an automated trading strategy. APIs enable real-time market data access and trade execution.

5. Order Execution & Risk Management

Once the algorithm is set, it’s time to wait. Algorithms continuously analyse market data according to the strategy. When the conditions in the strategy are satisfied, the system automatically executes buy or sell orders. Moreover, the algorithms also place stop-loss orders and perform position sizing based on the strategy to manage risk. 

6. Monitoring and Forward Testing

Before the final deployment, the strategy needs to be forward-tested. Forward testing is a method of evaluating the performance of a trading strategy by applying it to real-time market data. Forward testing ensures that the algorithm works as intended. It helps to understand how our system performs in real-time, on data that the strategy has never seen before. Any deviations or unexpected variations are corrected and optimised further.

7. Final Deployment

After forward testing the strategy, the final step is to deploy the strategy. In forward testing, the account will not be fully funded. Here, the account is fully funded and deployed in real markets. Additionally, the trades and strategies get monitored and revised periodically.

Basic Types of Algo Trading

  • High-Frequency Trading (HFT) – High-frequency trading (HFT) is a type of super-fast trading done by powerful computers. These computers use smart algorithms to quickly buy and sell stocks and other assets in different markets. Since they’re so fast, HFT computers can make lots of trades in just a short time. Traders who use HFT aim to make profits by taking advantage of small price changes.
  • Arbitrage Trading – Arbitrage refers to the practice of taking advantage of price differences for the same asset in different markets. This type of algo trading involves using automated computer programs to identify and exploit these price differences quickly and efficiently. To learn more about arbitrage trading, click here!

What are the Advantages of Algo Trading?

1. Speed and Efficiency

Algo trading operates at lightning-fast speeds. The computer program executes all the trades in mere seconds, enabling timely responses to market changes without delay. On the other hand, with manual trading, executing trades at such high speed and accuracy is impossible.

2. Accuracy

Algorithms can process large volumes of data and recognise patterns that human traders might often overlook. This results in more accurate trading decisions than human traders.

3. Eliminating Emotions or Bias

Algo trading eliminates emotional and psychological biases. Emotions such as fear, greed, and overconfidence can cloud judgment and lead to impulsive decisions. By relying on algorithms, traders can stick to predefined strategies without being influenced by market sentiments.

4. Backtesting and Optimization

Algo trading allows traders to backtest their strategies using historical data. Backtesting enables them to refine and optimise their algorithms for better performance. Traders can analyse an algorithm’s past performance and make necessary adjustments to enhance its effectiveness in current market conditions.

5. Diversification

Algo trading enables traders to diversify their portfolios across multiple assets and markets, reducing overall risk exposure. Automated systems can manage multiple trades simultaneously. This allows traders to spread their investments across different strategies, asset classes, and sectors/industries.

What are the Risks of Algo Trading?

Although algo trading has many advantages, it is necessary to be aware of its risks.

1. Technical Failures

Algo trading relies heavily on technology, making it vulnerable to technical glitches, connectivity issues, or system failures. Technical failures can lead to significant and irrecoverable financial losses. Even a minor technical error can disrupt trade execution, leading to missed opportunities or losses. Poor internet connections or latency delays can impact trade execution and pricing.

2. Market Volatility

Rapid and automated trades executed by algorithms may lead to market volatility. Huge volatility can lead to quick crashes and unexpected market movements. In extreme market conditions, algorithms may develop market fluctuations due to their swift response to price changes, leading to market instability.

3. Over-Optimisation

Over-optimising algorithms based on historical data can lead to poor performance in real-market conditions. While algorithms may show good results in backtests, they may not adapt well to real-world market conditions. Therefore, over-optimising strategies may lead to underperformance. 

4. Lack of Human Oversight

Relying fully on algo trading without human supervision may lead to unforeseen and unexpected outcomes. Moreover, algorithms may not account for market events or black swan events outside the scope of historical data.

5. Lack of Human Judgment

Algorithmic trading relies on mathematical models and historical data. So it does not consider the subjective and qualitative factors that can influence market movements. In this case, the lack of human judgment can be a disadvantage for traders who prefer discretionary trading.

In conclusion, algo trading has revolutionised the financial markets, introducing speed, accuracy, and efficiency in trade execution. By removing human emotions and leveraging the power of computer algorithms, traders can capitalise on market opportunities with remarkable precision. However, algo trading does come with inherent risks, making it essential for traders to exercise caution. As the landscape of financial markets continues to evolve, algo trading will undoubtedly play an increasingly vital role in shaping investment strategies and market dynamics.

Common FAQs on Algo Trading:

1. What is algo trading?

Algo Trading is a method of executing orders in the financial markets (stocks, currencies, commodities, derivatives, etc.) using automated or pre-programmed trading instructions.

2. When was algo trading introduced?

Algo trading was first introduced in the United States during the early 1970s with the arrival of electronic trading systems.

3. What are the major benefits of algo trading?

Algo trading has transformed the financial markets by introducing speed, accuracy, and efficiency in trade execution. By eliminating human emotions and harnessing the power of computer algorithms, traders can seize market opportunities with remarkable precision.

4. Can algo trading be profitable?

Yes, algo trading can be profitable – provided that you have the right skills, mindset, and resources. It needs to be executed with proper risk management and backtesting. Ensure you follow the guidelines set by regulatory authorities (SEBI).

  1. What is algo trading?

    Algo Trading is a method of executing orders in the financial markets (stocks, currencies, commodities, derivatives, etc.) using automated or pre-programmed trading instructions.

  2. When was algo trading introduced?

    Algo trading was first introduced in the United States during the early 1970s with the arrival of electronic trading systems.

  3. What are the major benefits of algo trading?

    Algo trading has transformed the financial markets by introducing speed, accuracy, and efficiency in trade execution. By eliminating human emotions and harnessing the power of computer algorithms, traders can seize market opportunities with remarkable precision.

Categories
Jargons

What are Penny Stocks?

Penny stocks offer a unique investment opportunity for individuals seeking high potential returns on small investments. In the Indian stock market, several penny stocks have received attention due to their impressive growth potential. In this article, we will explore the best penny stocks in India and discuss the advantages, disadvantages, and key factors to consider before investing in them.

What are Penny Stocks?

Stocks that trade at a very low price and have a low market capitalisation are known as Penny Stocks. Depending on the company’s market capitalisation, these stocks are categorised into nano-cap stocks, micro-cap stocks, and small-cap stocks. Although there is no official rule, penny stocks in the Indian stock market are those which have prices below ₹10.

Advantages of Penny Stocks

Investing in penny stocks can provide several advantages to investors, including:

1. High Growth Potential

Penny stocks often represent small companies with significant growth prospects. These stocks have the potential to generate substantial returns over a short period. Therefore Investors can generate multibagger returns on their investments.

2. Affordable

Penny stocks are affordable, making them accessible to investors with limited funds. This low entry barrier allows individuals to diversify their portfolios without substantial financial commitments.

3. Market Volatility Opportunities

The inherent volatility of penny stocks can present opportunities for investors to profit from short-term price fluctuations. Skilled traders can leverage market volatility to buy low and sell high, potentially maximising their gains.

Disadvantages of Penny Stocks

It is crucial to acknowledge the potential disadvantages associated with investing in penny stocks:

1. High Risk

Penny stocks are high-risk investments. This is because they are often more volatile than stocks of established companies. The financial performance of some of these companies may not be great and are even likely to go bankrupt.

2. Limited Information

Penny stocks are not as widely tracked by financial analysts as compared to larger companies. This limited coverage makes it challenging for investors to obtain accurate and reliable information about these stocks. This increases the risk of making uninformed investment decisions.

3. Easy Manipulation

Penny stocks can be manipulated easily due to their low market capitalisation and limited trading volume. This manipulation can happen in different forms. For example, some people might boost a stock’s price and then sell it for a profit (pump-and-dump scheme), leaving other investors with huge losses.

4. Lack of Liquidity

Penny stocks are often illiquid, which means that it can be difficult to buy or sell them. This can make it difficult to exit your investment if you need to.

Factors to Consider While Investing in Penny Stocks

Before investing in penny stocks, it is crucial to consider the following factors:

1. Company Fundamentals

Thoroughly research the company’s financials, growth prospects, and competitive position. Look for a strong management team, a sustainable business model, and a track record of profitability.

2. Industry Analysis

Evaluate the industry trends and dynamics in which the company operates. Ensure that it is well-positioned to capitalise on market opportunities and navigate potential challenges.

3. Risk Management

Set realistic expectations and establish an investment strategy that aligns with your risk tolerance. Diversify your portfolio and avoid allocating a significant portion of your capital to a single penny stock.

4. Market Liquidity

Assess the liquidity of the penny stock by analysing its trading volume and average bid-ask spread. Higher liquidity enhances the ease of buying and selling, reducing the risk of being stuck with illiquid stocks.

Best Penny Stocks in India

Now, let’s explore some of the best penny stocks in India that have caught the attention of investors:

1. Vodafone Idea

Vodafone Idea (Vi) is one of the leading telecommunications companies in India. Despite facing financial challenges, Vi has shown signs of revival with strategic partnerships and initiatives. Vi has undergone a comprehensive restructuring process recently to improve its financial position. The Indian government’s recent decision to permit telecom operators to raise prices is expected to have a positive long-term impact on Vodafone Idea’s financial stability.

Recently, the Government of India converted the company’s interest dues owed to the government into equity. This conversion, pending since September 2021, has resulted in the government acquiring shares in Vodafone Idea worth ₹16,133.10 crores at an issue price of ₹10 per share.

Despite many challenges, Vodafone Idea possesses several contributing factors to its potential revival. These include a solid market capitalisation of ₹36,023 crores, the backing of Indian billionaire KM Birla who recently rejoined the company’s board, and the government’s interest in salvaging a prominent telecom entity like Vodafone Idea from failure.

2. Bank of Maharashtra

Bank of Maharashtra is a public sector bank that demonstrates a comparable stock performance to other public sector bank stocks. These stocks are part of the outperforming Nifty PSU Bank Index (which consists of 12 PSU bank stocks).

The bank has robust fundamentals, marked by solid credit and deposits growth, and the added assurance of a sovereign guarantee. It has witnessed a decline in non-performing assets (NPAs) quarter-on-quarter, which works in its favour. Over the past year, the stock price has doubled, indicating positive momentum.

Bank of Maharashtra is primarily engaged in providing banking services in the treasury, corporate/wholesale banking, and retail banking segments. The bank’s emphasis on digitalisation and customer-centric services aligns with the changing landscape of the banking industry in India.

3. Indian Overseas Bank

Indian Overseas Bank (IOB) is another public sector bank that has shown promise recently. IOB’s operations revolve around domestic deposits, domestic advances, foreign exchange operations, investments, micro, small, and medium enterprises (including the MUDRA Loan Scheme), retail banking (including Arogya Mahila Savings Bank Accounts), mid-corporate department, agricultural credit portfolio, loans to small and marginal farmers, loans to non-corporate farmers and microfinance.

IOB’s financial performance showcases positive indicators, such as lower gross non-performing assets (NPAs) on a sequential basis, higher basic earnings per share (EPS) quarter-on-quarter, increasing profit after tax, and a significant rise in total income.

The bank has been able to reduce provisions for bad loans every quarter, indicating improved asset quality. Investors are optimistic about IOB’s stock potential, with hopes for a continuation of its impressive performance from last year.

4. Reliance Power

Reliance Power (RPower) is a part of the renowned Reliance Group and operates in the power generation and distribution sector. The company has a diverse portfolio of projects, including thermal, hydro, and renewable energy. As India focuses on renewable energy and infrastructure development, RPower stands to gain from the government’s initiatives in these sectors.

Despite a sequential loss in the December quarter, the company saw a 5% increase in net sales. Reliance Power is committed to fully repaying its debt of ₹1,500 crores in 2023 and has raised ₹1,200 crore in debt capital. Noteworthy developments include BlackRock ETF acquiring a stake and the withdrawal of insolvency proceedings. The company aims to meet India’s growing electricity demand, improve efficiency, reduce costs, and expand into international markets (especially Africa).

5. Morepen Laboratories

Morepen Laboratories is a pharmaceutical company that manufactures and distributes Active Pharmaceutical Ingredients (APIs), formulations, and diagnostics. With a strong presence in the domestic market, the company also exports its products, expanding its reach beyond national borders.

By focusing on R&D, the company aims to develop new products and enhance its existing offerings, ensuring a diverse and comprehensive product portfolio. Additionally, Morepen Laboratories has made strategic investments in digital technology, leveraging it to improve operational efficiency and streamline its processes. Investors are also drawn to the company due to its growth potential in the pharmaceutical industry.

Always remember that penny stocks are volatile and can experience rapid price fluctuations. Diversification, risk management, and a long-term perspective are crucial elements of a successful investment strategy. With careful analysis and a disciplined approach, investors can potentially find opportunities and unlock the growth potential offered by the best penny stocks in the Indian stock market.

Disclaimer: The information and stocks mentioned in the article are purely for educational purposes. Kindly do your own research before investing.

Categories
Jargons

6 Types of Chart Patterns Every Trader Should Know

Trend analysis, volume analysis, and candlestick patterns are powerful tools that help us understand how price behaves in the stock market. They allow us to take high-profitable trades. In this article, we dive into the most popular topic in technical analysis: chart patterns! We will explore 6 types of chart patterns every trader should know.

What are Chart Patterns?

Chart patterns are formations that appear in price charts and create some type of recognisable shape over time as the candlesticks keep forming. You can identify these patterns by drawing a line connecting common price points, such as the closing prices or the highs or lows during a period. Price action traders seek to identify patterns to anticipate the future price direction of a security.

These patterns are a graphical depiction of the collective market psychology at a given time as they form as a result of the behaviour of the market participants. There are few common chart patterns that appear repeatedly and often lead to similar subsequent price movements. These recurring patterns can form a basis for market analysis and price forecasting.

There are two categories of chart patterns in the market:

  1. Continuation Patterns – Continuation patterns indicate that an asset’s price trend is likely to continue in the same direction as which it was before the pattern occurred. They form during periods of consolidation.
  2. Reversal Patterns – Reversal patterns signal a change in the price trend and can be bullish or bearish.

The six most common types of chart patterns are:

1. Bullish and Bearish Rectangle Pattern

Bullish and bearish rectangle pattern

A rectangle pattern usually develops as a continuation pattern and indicates consolidation. However, it can also be a reversal pattern. Two parallel trendlines form this pattern, one connecting the high prices and the other connecting the lows during the period. The trendline on the upper side acts as resistance, and the trendline on the bottom side acts as support.

Bullish Rectangle Pattern

A bullish rectangle pattern forms when the price consolidates in a range and tries to break out of the resistance. The horizontal resistance line that forms the top of the rectangle shows that the investors are repeatedly selling shares at that specific price level, bringing the short bullishness to an end. 

If the price breaks out of the resistance, you can consider a long trade with a stop loss (SL) below the support.

Bearish Rectangle Pattern

A bearish rectangle pattern forms when the price consolidates in a range and tries to break down from the support. The horizontal support line formed at the bottom of the rectangle shows that the investors are repeatedly buying shares at that specific price level. 

If the price breaks down from the support, you can consider a short trade with an SL above the resistance.

2. Triangle Patterns

Triangle pattern

A triangle pattern is a type of continuation pattern. A trendline connecting the highs and another connecting the lows forms this pattern. The upper trendline acts as resistance, and the bottom trendline acts as support. Triangle patterns are of three types:

Ascending Triangle Pattern

An ascending triangle pattern has the same highs and higher lows. The trendline connecting the high prices is horizontal, and the trendline connecting the low prices forms an uptrend. 

Descending Triangle Pattern

A descending triangle pattern has the same lows and lower highs. The low prices form a horizontal trendline, and the trendline connecting the high prices forms a downtrend.

Symmetrical Triangle Pattern

A symmetrical triangle pattern has lower highs and higher lows. The trendline formed by the highs slopes down, and the trendline formed by the lows slopes up. Both trendlines slant roughly at the same angle, creating a symmetrical pattern. 

  • If the price breaks out of the resistance, you can consider a long trade with the SL below the support. 
  • If the price breaks down from the support, you can consider a short trade with the SL above the resistance.

3. Double Top and Double Bottom

double top and double bottom

Double Top Pattern

A double-top pattern forms when an uptrend reverses twice at roughly the same high price level. Typically, volume is lower on the second high than on the first, signalling diminishing demand. The neckline for a double top is the horizontal line that touches the low between the two highs.

You can consider a short trade when the price breaks below the neckline, with an SL halfway between the first top and the neckline.

Double Bottom Pattern

A Double bottom pattern forms when the price reaches a low, rebounds, and then declines again to the first low level. The neckline for a double bottom is the horizontal line that touches the minor high between the two troughs.

You can consider a long trade when the price breaks above the neckline, with an SL halfway between the first bottom and the neckline.

4. Head and Shoulder Patterns

head and shoulders pattern

Head and shoulders patterns are reversal patterns and consist of three segments:

  • Left Shoulder
  • Head
  • Right Shoulder

The neckline in this pattern is formed by connecting the beginning of the left shoulder and the end of the right shoulder. It can slope up, down, or be horizontal.

Head and Shoulders Pattern

The Head and Shoulders pattern is a reversal pattern preceded by an uptrend. It is named so because it resembles a human head and shoulders, as the head is at the centre, and the shoulders are at either side.

Volume during the first advance in the left shoulder should ideally be higher than the advance in the head, showing reduced confidence in the bulls. The volume should increase during the fall from the top of the head. Additionally, there should be an increase in volume during the decline from the peak of the right shoulder, indicating a bearish sentiment.

Once the pattern has formed, the market anticipates the price to fall below the neckline.

You can consider a short trade when the price breaks below the neckline with an SL halfway between the top of the right shoulder and the neckline.

Inverse Head and Shoulders Pattern

An inverse head and shoulders pattern is the bullish version of the head and shoulders pattern. It is an upside-down head and shoulders pattern, preceded by a downtrend, and signals a possible reversal.

You can consider a long trade when the price breaks above the neckline with an SL halfway between the bottom of the right shoulder and the neckline.

5. Flag Continuation Pattern

flag continuation pattern

A flag continuation or a pennant pattern is formed by downward-slopping parallel trendlines. It is typically a short-term pattern. The market expects the price to continue the trend that it was before the pattern formation.

You can consider a long trade when the price breaks above the resistance line with an SL at the centre of the parallel channel.

6. Cup and Handle Pattern

cup and handle pattern

A cup and handle pattern resembles a cup and its handle. The price is bullish and creates a high, falls, recovers slowly over time, and climbs back up to the previously created high.

Then the price forms a small down-sloped rectangular pattern, breaks out of it, and finally breaks out of the previous high.

You can consider a long trade when the price breaks out of the high made after the pattern forms.

Pro Tips for Chart Pattern Analysis

retests and volume
  • Pattern-based trading can yield better results when you combine volume analysis with retests of supports and resistances.
  • In the above bearish rectangle pattern, the volume during the consolidation is comparatively low. But it increases when the price breaks down from the lower support.
  • Most of the time, the price retests the broken support or resistance. It means that the price returns to the breakout/breakout levels.
  • The volume when the price returns for a retest should be low.
  • If the retest fails, the price moves in the direction of the breakout/breakdown with an even higher volume.
  • Traders often prefer to wait for the retest to be completed before entering a trade, as it helps decrease the probability of stop-loss (SL) being triggered by false breakouts or breakdowns.

Practical Application in Trading

  • Chart patterns can form in any timeframes. However, patterns formed over a higher timeframe tend to be stronger than in lower timeframes.
  • Before entering a trade, you should always confirm the volume during breakouts or breakdowns.
  • Technical analysis is a subjective process. Therefore chart patterns won’t always be textbook accurate. It depends on how the trader interprets the information.
  • Understanding the underlying sentiment and psychology is crucial as you gain deeper insights beyond theoretical knowledge.

These patterns are used daily by traders to find high-probability setups for trading. Practice is a must to identify patterns accurately and quickly. As an assignment, go through different charts and try to identify various patterns. Once you practice enough, you will be ready for action!

Also read: What are Candlestick Charts & How to Read Them?

Disclaimer: The information provided in this article is purely for educational purposes. Do your own research before using your hard-earned money to trade in the stock market.