Categories
Jargons

What is Term Insurance & Why Should You Get One?

As the new year approaches, we thought it was vital to discuss a financial product you should consider buying. Our lives are so unpredictable, and it’s essential to have some form of financial protection. You may be the sole breadwinner in your family and constantly worry about the financial impact if something unfortunate happens to you. That’s where a Term Insurance policy comes in handy!

What is Term Insurance?

Term Insurance is a type of life insurance that provides financial protection for a fixed period of time. If the policyholder suddenly passes away during this period, their family members (or nominees) will receive a death benefit. Term insurance is a relatively low-cost way to ensure your family’s financial security if something were to happen to you.

A 20-something-year-old healthy individual can essentially secure a cover of up to ₹1 crore for his dependents for the next 25+ years if he pays a fixed, minimal amount (even less than ₹500) every month to a reputable insurance company.

However, unlike whole life insurance, term insurance does not provide maturity benefits. The insurance company will not pay a lump-sum amount when your term insurance policy matures.

Why Should You Consider Term Insurance?

Here are some of the advantages of term insurance:

  • Term insurance offers much higher coverage for a smaller premium than traditional or market-linked life insurance policies. [A premium is a specific amount a policyholder has to pay periodically (monthly or yearly) to maintain their insurance coverage.]
  • It offers financial security for your loved ones. In the unfortunate event of your death, your family may face a financial burden of funeral costs, unpaid debts, and other expenses. A term insurance policy can cover these expenses and ensure that your loved ones are not left in financial trouble.
  • If you are the primary breadwinner in your family, it means your income contributes significantly to the family’s financial stability. If you become seriously ill or injured and are unable to work, term insurance can help your family maintain their standard of living.
  • You can select optional riders (or extra policy provisions) to increase the standard term insurance benefits. For example, you can add a critical illness rider or plan if you’ve been diagnosed with a serious illness.
  • You can also save money on taxes! The premium you pay for a term life insurance policy can be deducted (up to ₹1.5 lakh) under Section 80C of the Income Tax Act. A deduction of up to ₹25,000 is also available under Section 80D on premiums paid for term plans with a critical illness cover option. More importantly, the death benefit received under the term insurance policy is tax-exempt under Section 10(10D). 

Types of Term Insurance

A single plan cannot accommodate everyone’s requirements given the changing periods and circumstances. As a result, there are many term plans you must take into account while making financial plans or goals.

Level Term 

Level-term plans are the most fundamental and straightforward type of term life insurance. The sum assured selected at the start of the policy remains the same throughout the policy term. In the event that the policyholder dies, the nominees or beneficiaries will get the death benefit.

Increasing Term Insurance


Under this term plan, the coverage amount chosen at the start of the policy increases every year by a specific amount. A term plan with expanding coverage is beneficial in keeping up with inflation since it makes sure the family has enough money to survive. The premium for such plans is relatively higher because the policyholder has the opportunity to enhance the sum guaranteed.

Return of Premium Term Insurance 

It is a type of insurance plan where, if you outlive the policy term, you get back all the premiums you paid. It’s like getting your money back if nothing unfortunate happens during the coverage period. You are eligible to use this option only if you haven’t filed any claims throughout the policy’s term.

Decreasing Term Insurance

In this type of policy, the sum guaranteed is reduced at a certain pace as the policyholder becomes older. It is based on the assumption that as people age, their financial liabilities might decrease, and they might not need as much coverage. It’s a suitable choice if you have loans or a mortgage that you expect to pay off in the near future.

Convertible Term Insurance Plan 

A convertible term insurance plan is a policy that can be changed into another kind of insurance plan at a later time. You might choose this kind of term plan if you anticipate a change in your financial priorities in the upcoming years. For instance, you can choose a term plan that can be changed into a whole life insurance plan.

How Does Term Insurance Work?

  • Firstly, you’ll have to examine factors like the net income of your family, the number of dependents, loan EMIs, and all lifestyle expenses. As a general thumb rule, an ideal term insurance cover should be 10-20 times more than your family’s net annual income! Your insurance should be adequate to cover both the present and future demands of your dependents.
  • The policy term (or the period for which your term insurance policy remains active) can be from 5 years to 99 years. The sum assured can be from ₹20 lakhs to up to ₹5 crore. [Sum assured is the fixed amount paid to the nominee in the unfortunate event of the policyholder’s death.]
  • When you buy a term insurance product, you’ll have to pay a small fee (or premium) every year. The premium for term insurance will be lower the earlier you purchase it. So if you need a cheap life insurance policy, start when you’re young and healthy.
  • The insurance company pays out a large sum to the policyholder’s family (nominee) in the event of their death.
  • In case the policyholder outlives the term plan, nothing is paid out. So look for term insurance policies that allow you to extend your coverage or convert it to a permanent life insurance policy.

Tips to Select Best Term Insurance in India

Assess Life and Financial Situation

Consider your age, financial situation, and the duration of coverage needed to determine the right term insurance policy for you. Assess your financial responsibilities and dependents to choose an appropriate coverage amount.

Evaluate Lifestyle Needs

Understand your spending habits and standard of living to estimate the required life coverage. Ensure that your loved ones can maintain their lifestyle even in your absence.

Analyze Income

Assess your income and financial obligations to determine a practical life cover amount. Avoid overburdening your finances by choosing a coverage level that aligns with your income.

Consider Existing Liabilities

Take into account any outstanding debts and liabilities, such as loans, that need to be covered by the policy. Ensure that the policy term and coverage amount are sufficient to protect your dependents from financial burdens.

Customize with Riders

Explore additional riders, such as critical illness, accidental death, or waiver of premium, to enhance your term insurance policy’s coverage. Understand the available riders and choose ones that suit your specific needs.

Check Claim Settlement Ratio

Evaluate the insurer’s claim settlement ratio, which indicates the percentage of successfully paid claims compared to the total received. Consider insurers with a higher ratio as they demonstrate a better track record of fulfilling claims promptly.

Remember, it’s important to carefully research and compare different term insurance policies and providers before making a decision.

How Much Term Insurance Do You Need? 

Term insurance coverage differs from person to person depending on factors including income, way of life, costs, debt, and more. You ought to get coverage that is around 10 to 12 times your gross yearly income if you are under the age of 55. Such a sum can be adequate to meet future needs and counter inflation.

You can increase your base coverage with riders for a negligible rise in the premium. These add-ons offer additional payments for unforeseen events like accidental death, critical illness, permanent disability, etc.

What are Tax Benefits of Term Insurance? 

  • You can deduct up to ₹1.5 lakh from the premium you pay for your term plan under Section 80C of the Income Tax Act of 1961.
  • A deduction of up to ₹25,000 is also available under Section 80D on premiums paid for term plans with a critical illness cover option.
  • The death benefit received under the term insurance policy is tax-exempt under Section 10(10D)

Term insurance is an important financial tool that can offer peace of mind to you and your loved ones. By choosing the right policy, you can provide your family with the financial support they need during difficult times. You can compare and buy term insurance policies from any popular insurance aggregator platform in India!

Categories
Jargons

What are Unit-Linked Insurance Plans (ULIPs)?

Buying an insurance plan/policy is essential to make yourself financially secure to face any unexpected or sudden problems in life. It provides a cover against any sudden loss. But did you know that there’s a financial product that combines insurance and investment benefits in a single plan? Unit-Linked Insurance Plans (ULIPs) provide a mix of both life insurance and investment. Insurance companies offer ULIPs so that their clients can get life cover and also reap the benefits of investing in equity and debt funds. It creates a habit of regular and disciplined savings.

ULIPs vs Traditional Insurance Plans 

Traditional insurance plans focus solely on providing life insurance coverage. On the other hand, ULIPs have an investment component and allow the policyholder to have some control over the investment allocation within the policy. They provide a combination of wealth creation and life insurance benefits. This makes ULIPs popular among individuals looking for protection and investment opportunities in a single package.

Here are a few notable differences between ULIPs and traditional insurance plans:

ULIPsTraditional Insurance
PurposeInsurance cover along with investment benefits.Insurance cover only
ObjectiveLong-term plans that offer insurance and investment benefit.To avail fixed returns in the long term.
Return on InvestmentVariable returns as it is equity-linkedGuaranteed returns as the investment in risky instruments are low
Lock-in Period3-5 yearsLocked till maturity
SIPAvailableUnavailable
How is your money utilised?The premium payment towards ULIP goes towards meeting the expenses, insurance cover and equity mutual fund.The premium payment towards Traditional insurance plans goes towards expenses, insurance cover and low-risk instruments.

How Do ULIPs Work?

ULIPs work by combining insurance coverage with investment opportunities. Here’s a simplified explanation of how ULIPs typically work:

1. Premium Payment

When you buy and hold a ULIP policy, you’ll have to make regular premium payments. A part of this premium is utilized to provide life insurance coverage. The remaining amount is pooled with the money received from other policyholders and then invested in equity, debt, or even hybrid funds. [A hybrid or balanced fund is a financial instrument that invests in a mix of both equity and debt segments in a specific ratio].

2. Insurance Component

A portion of the premium gets allocated towards providing life insurance coverage. In the event of the policyholder’s demise during the policy term, the nominee will receive a death benefit.

3. Investment Component

The remaining premium gets invested in various investment funds, such as equity, debt, or balanced funds. Policyholders can choose the funds based on their risk appetite and investment goals. A professional fund manager looks after the investments made by all policyholders.

ULIPs give investors the option to switch between equity and debt funds based on market conditions and their risk-taking capacity. The gains from such schemes will be taxed the same way as most mutual funds are taxed

4. Unit Allocation

The insurance company will utilise the investment component of the premium to purchase units in the chosen investment funds. The number of units allocated depends on the prevailing unit price at the investment time.

5. Fund Performance

The value of the units invested fluctuates with the performance of the underlying investment funds. If the funds perform well, the unit value increases, potentially leading to higher returns.

6. Flexibility

ULIPs typically offer flexibility in managing investments. Policyholders can switch between different funds based on their changing investment preferences. Some ULIPs also allow partial withdrawals or top-ups to the investment amount.

7. Charges

ULIPs involve charges such as premium allocation charges, policy administration charges, and fund management charges. These charges get deducted from the premium before it allocates insurance coverage and investments. 

8. Policy Term and Maturity

ULIPs have a defined policy term. On maturity, the policyholder receives the maturity benefit, which is the current value of the investment units. The performance of the chosen funds influences the value of this amount.

Advantages of Investing in ULIPs

ULIPs offer several advantages to policyholders. Here are some key benefits of ULIPs:

1. Insurance Coverage

ULIPs provide life insurance coverage, ensuring financial protection for the policyholder’s family in the event of an untimely demise.

2. Investment Opportunities

ULIPs allow policyholders to invest in a variety of funds, such as equity, debt, or balanced funds. This provides the potential for wealth creation and capital appreciation over the long term.

3. Flexibility

ULIPs offer flexibility in managing investments. Policyholders can switch between different funds based on market conditions or their changing investment objectives. Some ULIPs also provide options for partial withdrawals or additional contributions.

4. Goal-based Investing

ULIPs enable policyholders to align their investments with specific financial goals, such as education, retirement, or wealth accumulation. The investment flexibility allows for customised strategies based on individual objectives.

5. Tax Benefits

ULIPs offer tax benefits under Section 80C of the Income Tax Act in India. Policyholders can claim deductions on the premium paid, subject to specified limits. Additionally, the maturity proceeds are tax-free under Section 10D, subject to certain conditions.

6. Wealth Transfer

ULIPs provide an efficient means of transferring wealth to the nominee(s) in the event of the policyholder’s demise. The death benefit received by the nominee is generally tax-free and can provide financial stability to the family.

Risks and Challenges of Investing in ULIPs

Investing in ULIPs comes with certain risks and challenges:

1. Market Risk

ULIPs are subject to market fluctuations. The value of the investment units can rise or fall based on the performance of the underlying investment funds. Poor market conditions may result in lower returns or even capital loss.

2. Investment Risk

The policyholder bears the investment risk in ULIPs. If the chosen investment funds do not perform well, it can affect the overall returns. The performance is dependent on various factors such as market conditions, economic stability, and fund management.

3. Charges and Fees

ULIPs involve various charges, which can impact the overall returns. It’s essential to understand and consider these charges before investing.

4. Lock-in Period

ULIPs typically have a lock-in period, which means that the policyholder cannot withdraw or surrender the policy before a certain period. Early withdrawal may attract penalties and impact the investment value.

5. Insurance Costs

A portion of the premium paid towards ULIPs gets allocated for insurance coverage. The insurance costs can be higher compared to standalone term insurance plans. It’s necessary to understand whether the insurance component adequately meets your coverage needs.

6. Surrender Charges

If the policyholder decides to surrender or exit the ULIP before the lock-in period, surrender charges may apply. These charges can impact the final payout or surrender value of the policy.

Before investing in ULIPs, individuals should carefully assess their investment objectives, and risk tolerance, and understand the terms and conditions of the policy. It’s advisable to review the performance of the chosen funds regularly and seek professional advice if needed.

How to Choose the Right ULIP?

When selecting a Unit-Linked Insurance Plan, it’s important to consider the following factors;

1. Investment Objectives

Determine your investment goals, whether they are long-term wealth accumulation, retirement planning, education funding, or any other specific financial objective. Aligning the ULIP with your investment objectives is crucial.

2. Risk Appetite

Assess your risk tolerance level. ULIPs offer different investment fund options with varying risk profiles, such as equity funds (higher risk), debt funds (lower risk), or balanced funds (moderate risk). Choose funds that match your risk appetite.

3. Fund Performance

Evaluate the historical performance of the investment funds offered within the ULIP. Analyse factors such as consistency, returns generated over different market cycles, and the fund manager’s track record. Consider funds that have delivered favourable returns over a reasonable period.

4. Charges and Fees

Understand the various charges associated with the ULIP. Compare the charges across different ULIPs to ensure they are reasonable and do not significantly impact your investment returns.

5. Flexibility

Assess the flexibility offered by the ULIP. Look for features such as the ability to switch between funds, make partial withdrawals, or increase/decrease the sum assured as per your changing needs.

6. Transparency

Evaluate the transparency of the ULIP provider. Ensure that you have access to regular updates on fund performance, policy-related documents, and information on charges and fees.

7. Insurance Coverage

Assess the adequacy of the insurance component of the ULIP. Consider factors such as the sum assured, riders (additional coverage options), and the policy’s ability to meet your insurance needs.

8. Company Reputation

Research the reputation and credibility of the insurance company offering the ULIP. Look for financial strength, claim settlement records, customer service, and reviews from existing policyholders. Choose a reputable and reliable insurer.

9. Policy Term and Lock-in Period

Evaluate the policy term and lock-in period of the ULIP. Longer policy terms provide more time for potential investment growth, while the lock-in period ensures commitment to the investment. Understand the implications of early withdrawals or surrenders.

10. Seek Professional Advice

Consider consulting a financial advisor or insurance expert who can provide personalised guidance based on your financial situation, goals, and risk profile. They can help you navigate the complexities of ULIPs and choose the most suitable option.

Tax Benefits of ULIPs

Interestingly, investments made in ULIPs can be used to claim a tax deduction of up to ₹1.5 lakh under Section 80C of the Income Tax Act. The returns from the policy are also exempt from taxation on maturity (up to Rs 2.5 lakh) under Section 10 (10D) of the IT Act. If the ULIP investor dies during the term of the ULIP, their nominee will be entitled to the death benefit specified in the ULIP policy, and the amount received on death is exempt from tax.

Lock-in Period & Charges of ULIPs

ULIPs come with a mandatory lock-in period of five years. It means that you can withdraw your ULIP policy only after five years from the date of investment. There are no provisions to make a premature exit. After five years, you can redeem the full amount. Since ULIPs are a combination of a life insurance policy and a mutual fund (which are long-term investments), it is advised that one should hold a ULIP policy for 15 years or more.

When a person subscribes to a ULIP, the insurer levies a charge for insurance protection upon his death and to cover other expenses. This is known as the mortality charge. It is usually deducted along with other charges before investing the policyholder’s money.

The expense ratio (or annual maintenance charge levied by fund managers) is mostly in the range of 1.05-2.25%. 

Disclaimer: Before investing in a ULIP, do proper research on the product and analyze all the charges levied.

Categories
Jargons

Mutual Funds: Common Types and Terminologies

In the world of investing, mutual funds have emerged as a popular choice for both seasoned and beginner investors. Mutual funds pool money from multiple investors to create a professionally managed portfolio.

However, navigating the world of mutual funds can be overwhelming without a clear understanding of the common types and terminologies associated with them. This article aims to provide an insightful introduction to mutual funds, its common types, and a few basic terminologies.

What are Mutual Funds?

Mutual funds are professionally managed investment vehicles that pool money from multiple investors. They invest this pooled money in a diversified portfolio of stocks, bonds, or other securities. Investors buy units/shares in the mutual fund. A unit represents proportional ownership. Experienced professionals manage the funds and make investment decisions on behalf of the investors. 

This professional management allows investors to benefit from the expertise of seasoned professionals. The Securities and Exchange Board of India (SEBI) regulates the mutual funds industry in India. Mutual funds offer a convenient and cost-effective way for individuals to invest in the financial markets.

Investors can choose from various types of mutual funds, each with specific investment objectives. These types include equity funds, debt funds, liquid funds, balanced funds, index funds, funds of funds, ELSS funds, etc. Investors can easily buy or sell mutual fund shares at the fund’s net asset value.

Types of Mutual Funds

Equity Mutual Funds 

Equity Mutual Funds (EMFs) generate returns by investing in stocks of publicly listed companies across market capitalisations (large-cap, mid-cap, and small-cap). They typically generate better returns than fixed deposits (FD) or debt-based funds. EMFs can be theme based, such as emerging markets, dividend yield, energy funds, tax-saving, etc. It can also be sector-based, such as financial services, automobiles, and fast-moving consumer goods (FMCG). The profits and losses generated from EMFs depend solely on the performance of the shares included in them.

Debt Mutual Funds

These funds invest in fixed-income securities such as corporate bonds, treasury bills, commercial papers, and government securities. Such debt instruments have a pre-determined maturity date and interest rate that the buyer can earn at maturity. It can be a preferred choice for passive investors with a low-risk appetite. However, movements in interest rates pose a risk to debt fund investors.

[Interest rate risk is the risk of loss from changing interest rates.]

Liquid Funds

Liquid Funds invest in short-term fixed-income instruments that invest in securities having a maturity of up to 91 days. These funds carry the lowest interest-rate risk in the debt funds category. Liquid funds are an alternative to depositing your money in a savings bank account as it offers better returns.

Index Funds

An Index Mutual Fund tracks a stock market index, such as NSE’s NIFTY50. The fund manager invests in a portfolio of stocks that constitutes an index. Index funds are passively managed funds and have exposure to the constituent securities of an index in the same proportion. It aims to match the returns offered by the underlying index. If you prefer predictable returns, Index funds will be a good choice. 

Balanced Funds

Balanced Funds (aka Hybrid Funds) invest in a mix of equity and debt segments in specific ratios. Fund managers keep changing the allocation/ratio based on market risks. These funds often provide the best risk-reward balance and help to maximise the return on investment (RoI).

Fund of Funds

Fund of funds (FoFs) is a type of mutual fund that utilises the money pooled from its clients to invest in various other types of mutual funds available in the market. Thus, the returns of an FoF depend on the performance of the target fund. For example, FOF is used to invest in international funds, a fund that invests in an overseas fund.

Tax Saving Funds (ELSS)

An Equity-Linked Savings Scheme (ELSS) mutual fund helps in saving taxes. It provides the dual advantage of wealth creation and tax saving under Section 80C of the Income Tax Act. By investing in ELSS mutual funds, you can claim a tax exemption of up to ₹1.50 lakh from your annual taxable income. However, ELSS would only be effective under the old regime of taxation.

How do Mutual Funds Work?

1. Creation of the Fund

An asset management company establishes a fund with a specific investment objective, such as growth, income, or a combination of both.

2. New Fund Offer (NFO)

The fund launches an NFO, where it offers units of the fund to investors for subscription. Each unit represents proportional ownership in the fund’s assets. The funds collected during this period are pooled together with investments from other investors.

3. Portfolio Construction

Fund managers create a diversified portfolio by investing the pooled money in a variety of securities, such as stocks, bonds, or money market instruments. The specific asset allocation depends on the fund’s investment strategy.

4. Net Asset Value (NAV)

The NAV represents the per-unit value of the mutual fund. is calculated by dividing the total value of the fund’s assets by the number of units outstanding. The NAV is typically calculated at the end of each trading day.

5. Buying and Selling Units

Investors can buy or sell mutual fund units at the NAV price. When investors invest in the fund, they receive units at the current NAV. Similarly, when they sell units, they receive the current NAV value.

6. Expenses and Fees

Mutual funds charge fees and expenses to cover operating costs, including management fees, entry and exit loads, etc. These fees are typically expressed as an expense ratio and deducted from the fund’s assets.

7. Distribution of Profits

Mutual funds may distribute profits to unit holders as dividends or capital gains. These distributions are typically made periodically, depending on the fund’s policy.

8. Performance Monitoring

Investors can track the performance of their mutual fund investments through regular updates provided by the fund. Performance is measured by comparing the fund’s returns against relevant benchmarks or indices.

9. Ongoing Management

Fund managers continuously monitor the fund’s investments, making adjustments as needed to align with the fund’s objectives or market conditions.

Common Terminologies in Mutual Funds

Asset Management Company 

An AMC is a company registered with the Securities and Exchange Board of India (SEBI) that handles a mutual fund’s asset management and investment decisions. The top AMCs in India include SBI Mutual Fund (MF), ICICI Prudential MF, HDFC Mutual Fund, Aditya Birla Sun Life MF, Nippon India MF, and Axis MF.

New Fund Offer (NFO)

Asset Management Companies launch New Fund Offers (NFOs) to issue units of their new mutual fund schemes. The Units are similar to shares issued by companies during an initial public offering (IPO). Through an NFO, investors can purchase units of a mutual fund at the subscription price. The offer price is usually ₹10 per unit. Funds are launched via NFOs for a limited time, following which they are traded in the market based on their corresponding net asset value.

Before applying to an NFO, make sure to review the past performance of the AMC and the fund manager. Also, ensure that the fund matches your investment strategy and risk appetite.

Net Asset Value

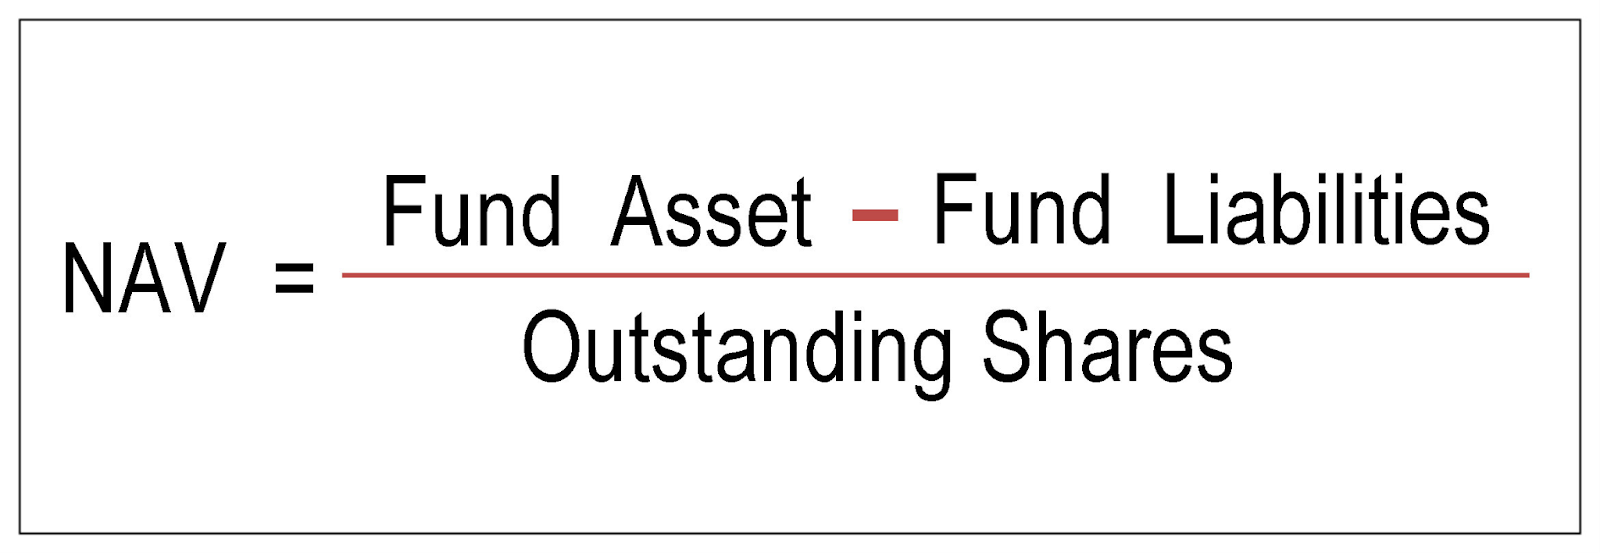
Net Asset Value, or NAV, is the price of each mutual fund unit. It is the weighted average value of the stocks and other assets in the scheme/portfolio. It is calculated by deducting the liabilities from the total asset value and dividing it by the number of shares. NAV is calculated at the end of each trading day.

What is Mutual Funds - Types & Terminologies

NAV is not an indicator of the future prospects of a scheme. Moreover, a mutual fund with a lower NAV does not mean it is not performing well when compared to a fund with a higher NAV.

Open-Ended and Closed-Ended Funds

Open-Ended Funds are mutual funds whose units are open for purchase and redemption at any time. There are no limits on the duration and amount a person can invest. All transactions of such fund units are done at the prevailing NAVs. Open-ended funds are ideal for those who want liquidity in their investments, as they are not bound to any maturity period.

Closed-Ended Funds are funds where investors can purchase units only during the initial offer period (NFO). The units can be redeemed at the specified maturity date.

Interval funds are a cross between open-ended and close-ended funds. It allows transactions at specific periods. Investors can choose to purchase or redeem their units when a trading window opens.  

Expense Ratio

The expense ratio is the annual maintenance charge levied by mutual funds to finance their expenses. It includes the annual operating costs, including management fees, allocation charges, and advertising costs of the fund.

Entry Load and Exit Load

Entry Load is the amount payable by an investor while joining a mutual fund. Recent SEBI regulations have removed the entry load from the calculations of the total expense ratio of a mutual fund.

Exit load is the amount payable when an investor chooses to withdraw from a mutual fund. This charge is payable on the total investment of an individual, usually standing at 1%. It serves as a tool to discourage people from withdrawing funds from a mutual fund and encourages them to stay invested for the long term.

Advantages of Investing in Mutual Funds

A few advantages of investing in Mutual Funds are:

  • Diversification: Mutual funds offer a diversified portfolio of investments, reducing the impact of individual stock or bond fluctuations.
  • Professional Management: Experienced fund managers make investment decisions on behalf of investors, leveraging their expertise and research capabilities.
  • Accessibility: Mutual funds provide easy access to a wide range of investment opportunities, even for small investors, with low minimum investment requirements.
  • Liquidity: Investors can buy or sell mutual fund shares at the fund’s net asset value on any business day, providing liquidity and flexibility.
  • Transparency: Mutual funds disclose their holdings regularly, allowing investors to review the investments made on their behalf.
  • Regulations: SEBI regulates the Mutual funds industry in India. SEBI ensures investor protection and adherence to investment guidelines.
  • Convenience: Investors can rely on professional management, avoiding the need for extensive research and monitoring of individual securities.
  • Choice of Investment Objectives: Mutual funds offer a variety of investment objectives, catering to different risk appetites and financial goals.
  • Dividend Reinvestment: Many mutual funds offer the option to reinvest dividends automatically, compounding returns over time.

Risks and Challenges of Investing in Mutual Funds

A few of the risks and challenges of investing in Mutual Funds are:

  • Market Risk: Mutual funds are subject to market fluctuations, and the value of investments can go up or down.
  • Lack of Control: Investors have limited control over the specific securities chosen by the fund manager.
  • Fees and Expenses: Mutual funds charge various fees, including entry and exit loads, which can impact overall returns.
  • Underperformance: Despite professional management, mutual funds can underperform their benchmarks or other investment options.
  • Over diversification: Some mutual funds may become overly diversified, diluting potential returns and making it harder to outperform the market.
  • Style Drift: The fund manager might deviate from the stated investment strategy, leading to a mismatch with investor expectations.
  • Market Timing Risk: If investors try to time their entry or exit from a mutual fund, they may miss out on potential gains or incur losses.

How to Choose the Right Mutual Fund?

Choosing the right mutual fund requires careful consideration of several factors. 

  • Investment goals: Decide whether you seek growth, income, or a balanced approach.
  • Risk tolerance: Understand how much risk you are comfortable with.
  • Fund Performance: Look for consistent returns over time and compare against benchmarks. 
  • Expense ratio: Lower expenses can positively impact your overall returns.
  • Evaluate the fund manager: Assess their experience, track record, and investment philosophy.
  • Diversification: Look for funds with a diversified portfolio to reduce risk.
  • Read the prospectus: Understand the fund’s investment strategy and potential risks.
  • Minimum investment and fees: Consider if the fund’s requirements align with your budget.
  • Comparison with Benchmarks: Measure the fund’s performance against relevant indices.
  • Seek professional advice: Consult a financial advisor for guidance and expertise if needed.

What is NAV in Mutual Funds?

Net Asset Value, or NAV, is the price of each mutual fund unit. It is the weighted average value of the stocks and other assets in the scheme/portfolio. It is calculated by deducting the liabilities from the total asset value and dividing it by the number of shares. NAV is calculated at the end of each trading day.

What is Mutual Funds - Types & terminologies

NAV is not an indicator of the future prospects of a scheme. Moreover, a mutual fund with a lower NAV does not mean it is not performing well when compared to a fund with a higher NAV.

How to Invest in Mutual Funds?

You can invest in mutual funds online through a broker. A trading & demat account is not necessary to invest in mutual funds. However, it is useful if you have one. Platforms such as Zerodha Coin and Groww offer mutual funds. You can also set Systematic Investment Plans (SIPs) on these platforms.

What is Direct Mutual Fund & How to Buy Mutual Funds?

Direct mutual funds allow investors to purchase units from the mutual fund company directly.  This bypasses intermediaries like brokers or distributors. These funds do not charge any distribution or commission fees, resulting in lower expense ratios compared to regular mutual funds. With direct mutual funds, investors can potentially earn higher returns over time due to the lower expenses.

You can buy direct mutual funds through Zerodha Coin.

Which Mutual Funds Come Under Tax Benefits?

An Equity-Linked Savings Scheme (ELSS) mutual fund comes with tax benefits. It provides the dual advantage of wealth creation and tax saving under Section 80C of the Income Tax Act. By investing in ELSS mutual funds, you can claim a tax exemption of up to ₹1.50 lakh from your annual taxable income. However, ELSS would only be effective under the old regime of taxation.

We would like to remind our readers to invest in mutual funds only after thoroughly understanding the objectives, theme, expenses, and risks involved. Ensure that the strategy deployed by the fund manager aligns with your investment goals. HAPPY INVESTING!

Categories
Jargons

Who are Domestic Institutional Investors (DIIs)?

Domestic Institutional Investors or DIIs are key players in the Indian stock market. These financial institutions, ranging from mutual funds to insurance companies and pension funds, have significant influence over the stock market. In this article, we explain who these institutional investors are and the different types of DIIs. We will also discuss the role of DIIs in the Indian stock market.

Who are Domestic Institutional Investors?

DIIs are large institutions based in India such as mutual funds, insurance companies, pension funds, and banks & other financial institutions. They pool money from different sources to invest in various securities. For example, an insurance company invests the premiums collected from its policyholders on different assets. Life Insurance Corporation (LIC) is an insurance company that is a DII.

 Since these organisations invest people’s money, they have a fiduciary relationship with their investors. DIIs perform due diligence while making investment decisions. They don’t invest in stocks and other securities that are unsafe. Therefore, a DIIs investment in a company shows its conviction in that company’s future prospects.

Analysing the shareholding pattern of DIIs in companies is a part of fundamental analysis. If these institutional investors hold a significant stake in a company, it is a positive sign. Furthermore, the investment trend in these companies also says a lot about it. A decrease in the shareholding over months or years means they are selling their investment in the company. This either means that the company has limited upside potential or the risk has increased.

Types of Domestic Institutional Investors:

Below are a few of the different types of Domestic Institutional Investors:

Mutual Funds

A mutual fund takes money (investments) from different individuals and entities who have a common investment objective. This pooled sum of money is managed by a professional fund manager, who invests in securities and assets to generate returns for investors. Investors buy units in the mutual fund. A unit represents proportional ownership. Experienced professionals manage the funds and make investment decisions on behalf of the investors.

According to the risk appetite of the investment scheme, they broadly invest in equity (comparatively riskier), gold, and fixed-income securities (bonds, debts).

Let us look at the top mutual fund houses in India by Assets Under Management (AUM). AUM refers to the total market value of the investments made by a fund house:

Fund HouseAUM
SBI Mutual Fund₹7.1 lakh crore
ICICI Prudential Mutual Fund₹5.1 lakh crore
HDFC Mutual Fund₹4.37 lakh crore
Nippon India Mutual Fund₹2.87 lakh crore
Kotak Mahindra Mutual Fund₹2.84 lakh crore
(As of March 2023)

Insurance Companies

An insurance policy is an agreement between the insuree (customer) and the insurer (insurance company). According to this contract, the insured person has to pay regular premiums to the insurance company.  There are multiple insurance options from life insurance to health, automobile, electronics, etc. In case of any claim by the insuree, the company will provide them with a lump sum amount within the policy limit. In order to hedge this risk, the insurance company pools in the premiums collected from clients and invest in various financial instruments.

Life Insurance Corporation of India (LIC) has a massive 50%+ market share in the life insurance segment. It is one of the largest DIIs in India.

InsurerAUM
LIC₹43.97 lakh crore
SBI Life₹3.07 lakh crore
ICICI Prudential Life₹2.6 lakh crore
HDFC Life₹2.5 lakh crore
Max Life₹1.06 lakh crore
(As of March 2023)

Pension Funds

Pension schemes are offered to citizens to create a hassle-free retirement life with a sufficient corpus. An individual pays a fixed amount during their working life and will receive a monthly pension post-retirement.

Since these schemes are market-linked products, a fund manager will pool money and invest in multiple financial assets.

National Pension Scheme (NPS),  Public Provident Fund (PPF), and Employees Provident Fund Organisation (EPFO) are some of the pension funds.

Banks & Other Financial Institutions

Banks and Non-Banking Financial Institutions (NBFCs) also participate in investments for their long-term goals. They primarily invest in government securities and corporate bonds as they are low-risk, fixed-return investment vehicles.

Difference Between DIIs and FIIs

Foreign institutional investors (FIIs) are those investors or funds who make investments in assets located in nations other than their own. FIIs can include hedge funds, insurance companies, pension funds, investment banks, and mutual funds of foreign countries and can aid in the growth of our economy. FIIs are also known as Foreign Portfolio Investors or FPIs.

All FIIs in India must register with the Securities and Exchange Board of India (SEBI) to participate in the market. To learn more about FII’s, click here!

The differences between FIIs and DIIs are:

FIIsDIIs
FIIs are not residents of the country they invest in.DIIs reside in the country in which they invest in.
FIIs can only invest up to 24% of the entire paid-in capital of the company.DII ownership is not subject to such restrictions. 
FIIs own around 21% of the companies that comprise the Nifty 500.DIIs own approximately 14% of all shares in the Nifty 500 companies.
FIIs generally invest with a short to medium-term horizon in mindDIIs generally make long-term investments
Categories
Jargons

Understanding the Different Types of Cryptocurrencies

Cryptocurrencies have become extremely popular across the globe over the past few years. Multiple crypto exchanges have sprung up in India, making it easier for you and me to invest or trade in the tens of thousands of cryptocurrencies available today. However, it is vital that we understand the various categories of cryptos and their features before investing in them. In this article, we shall discuss different types of cryptocurrencies. 

What is Bitcoin?

Bitcoin is a digital currency that provides secure global transactions quickly and without third-party manipulations. It was created to address the inefficiencies in global financial systems. Unlike normal currencies, Bitcoin is not issued by any government, and banks do not manage accounts or validate transactions. It is based on a cryptographic system that uses certain codes and numbers to keep information safe and secure.

Bitcoin is created, distributed, traded, and stored with the use of a decentralized ledger system known as a blockchain. It can be considered as records of transactions kept on a secure computer network. Moreover, Bitcoins are generally stored in digital wallets that allow users to manage and trade their coins. We recommend that you go through this detailed article to learn more about Bitcoin, blockchain technology, and how it works.

Bitcoins are currently accepted as a means of payment for products sold or services provided. It also offers lower transaction fees compared to traditional online payment mechanisms. However, the value of Bitcoin has been extremely volatile over the past few years. 

What are Altcoins?

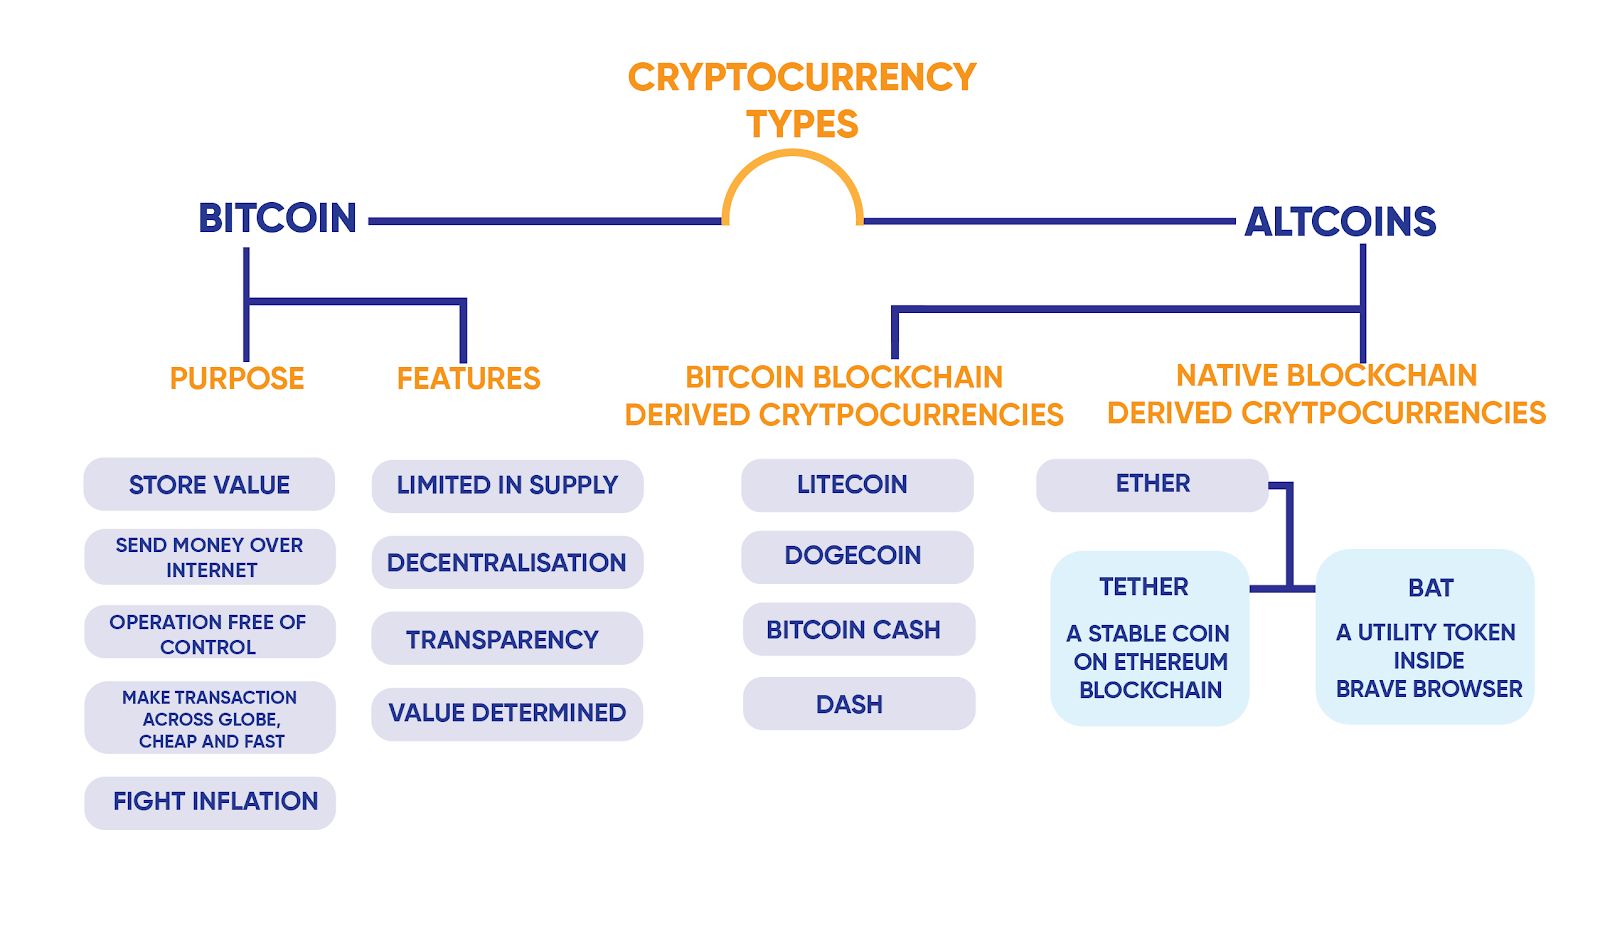
Altcoins or Alternative Coins is a term used to describe all cryptocurrencies other than Bitcoin. These coins also use blockchain technology that allows secure peer-to-peer transactions. Altcoins were built on the success of Bitcoin by slightly changing the rules to appeal to different types of users. They essentially solve the inefficiencies of Bitcoin. For example, an altcoin known as Litecoin was created to address issues related to scalability, higher transaction time & charges, and environmental concerns of Bitcoin.

Another example of an altcoin is Ether. Ethereum (the technology behind Ether) was created based on the idea that blockchain tech can be used to create applications that go beyond just enabling a digital currency. 

There are more than 10,000 altcoins in existence today. New altcoins will keep emerging as a result of innovation and technological advancements.

Cryptocurrency as a Form of Currency

Cryptos that are used solely as a currency fall under this category. Examples include Bitcoin, Litecoin, Shiba Inu, and Dogecoin. Various companies and even countries around the world accept some of these digital currencies for conducting transactions. However, the high volatility of Bitcoin and other popular cryptocurrencies makes it unsuitable for everyday use by the public. 

What are Stablecoins?

Stablecoins are a class of cryptocurrencies backed by reserve assets (cash or commodity). It attempts to offer price stability while ensuring all basic features or benefits of cryptocurrencies. Stablecoins also provides instant processing and security of payments. For example, each Tether (USDT) is pegged to (or backed by) 1 US Dollar. If you hold Tether, an equivalent amount of US Dollar is stored in a reserve. Since fiat currencies are pegged to an underlying asset such as gold or foreign exchange reserves, their valuations remain free from wild movements.

Another example of a stablecoin is PAX Gold, a digital token backed by physical gold. Currently, one PAXG is nearly 30 grams. 

What are Utility Tokens?

While coins are built and run on their own blockchain and operate as currency, tokens are programmable assets that work on other cryptos’ blockchains. Utility tokens are those used for a specific purpose or use-case, generally for spending within a particular blockchain ecosystem. These tokens allow their holders to access a company’s product or service. 

For example, Basic Attention Token (BAT) is a utility token of Brave, a free and open-source web browser developed by Brave Software, Inc. BAT was created to improve the security and efficiency of digital advertising through blockchain technology. It tracks the time and attention of media consumers on websites using the Brave browser. BAT aims to efficiently distribute advertising money between advertisers, publishers, and readers of online marketing content and ads.

Ether is another utility token used to facilitate transactions under Ethereum’s blockchain network.

What are Security/Equity Tokens?

Any company that works with blockchain technology or projects can raise funds via an Initial Coin Offering (ICO). It is similar to an initial public offering (IPO), wherein a firm raises funds by selling its shares to the public. A blockchain-based company can issue a whitepaper, outlining details of its projects, future plans, and issue size. Interested investors can apply to an ICO and receive a new cryptocurrency token issued by the company. This token may have some utility in using the product or service the company is offering. Or, it may simply represent a stake in the company or project.

What are Asset Tokens?

Asset tokens are a type of cryptocurrency backed by a real asset. Any asset, agreement, or contract between parties can be settled using crypto. An example of an asset token is Non-Fungible Tokens or NFTs. These are tokens that exist on a blockchain and cannot be replicated. NFTs can be used to represent ownership of unique items, including art, images, videos, collectibles, and even real estate. However, buying an NFT of an image or art does not mean the buyer gets the copyright of the underlying item. Unlike most digital items that can be endlessly reproduced, each NFT has a unique digital signature— meaning it is one of a kind.

New types of cryptocurrencies will continue to emerge as companies adapt and innovate upon the blockchain technology Bitcoin was built on to launch their own platforms and currencies. You can head over to CoinMarketCap to view a comprehensive list of the different types of cryptocurrencies.

Categories
Jargons

What is Short Selling?

In the normal course of investing in stocks, the primary objective is to buy low and sell high. You buy a certain stock when you anticipate that its price would go up (based on fundamental and technical analysis). However, there could be a situation where markets are bearish, and you anticipate a fall in the price of a stock. This is where the concept of short selling comes in. In this article, we explain what short selling is and how it works with an example. We will also discuss the pros and cons of short selling and the risk associated with it.

Basics of Short Selling

Short selling is a technique in which an investor/trader borrows securities (like stocks) from a broker and sells it in the market, with the intention of buying them back at a lower price in the future.

Those who expect share prices to fall on a future date can capitalise on their predictions. The method of shorting stocks is very interesting. Firstly, an individual can sell shares that they do not own. Traders would need to borrow these shares from a broker, thus opening a position. Brokers lend the shares to a trader with a promise that they will be delivered back at the time of settlement. The trader would sell these borrowed stocks at the prevailing market rate and wait for prices to fall. This is referred to as shorting the position. When the prices drop, the traders buy back those shares to close the position. Thus, the objective behind short selling is to “sell high and buy low”.

If the share prices fall, traders make a profit based on the difference between the selling price and purchasing price. However, if the trader’s study or prediction fails and the share prices go up, they incur a loss.

How Does Short Selling Work?

Short selling is an activity that allows market participants to profit from the fall in the price of a financial instrument. It involves borrowing an asset from a broker, selling it in the market, and then repurchasing it later at a hopefully lower price to return it to the lender. Here’s how the process generally works:

1. Borrowing the Asset

The trader borrows the asset (usually stocks) from a broker or another trader. This borrowed asset is typically done through a margin account, where the investor agrees to certain terms and pays a fee or interest for the borrowed amount.

2. Selling the Asset

After obtaining the borrowed asset, the trader immediately sells it on the market. This is where they take advantage of their belief that the asset’s price will decrease.

3. Waiting for Price Drop

The trader waits for the price of the asset to fall. If the price drops as anticipated, the investor can buy back the asset at a lower price.

4. Repurchasing the Asset

Once the price has dropped, the trader uses the proceeds from the initial sale to repurchase the same asset at a lower price.

5. Returning the Borrowed Asset

Finally, the trader returns the borrowed asset to the lender, typically the broker, from whom they originally borrowed it.

6. Profit or Loss

The profit or loss in short selling is the difference between the price at which the asset was sold and the price at which it was repurchased, minus any borrowing fees, interest, or transaction costs.

what is short selling?

Short selling can be a risky strategy because there’s a potentially unlimited downside. If the price of the asset increases instead of decreasing, the short seller could incur substantial losses. In the worst-case scenario, if the price rises significantly, the losses can be substantial and may even exceed the initial investment.

However, brokers have an automatic liquidation system in place that automatically squares off the position if the required margin is not maintained.

An Example of Short Selling

Suppose a trader speculates or predicts that the stock price of XYZ is bound to decline after a deep fundamental and technical analysis. He feels that the firm has not performed well during a particular quarter. The current share price of XYZ is Rs 100. He borrows 10 stocks of XYZ from a broker and sells them in the market at Rs 100 each. (He receives Rs 1,000 from this sale). Thus, he is getting “short” by 10 stocks. As predicted, the share price of XYZ falls to Rs 75. He then purchases those 10 shares back at the lower rate of Rs 75 per share. Thus, the overall profit from this transaction is Rs 250 (ie, Rs 750 subtracted from the Rs 1,000 he received initially by selling the shares). He then returns those 10 shares to his broker.

Now, what if the trader’s analysis failed, and XYZ’s share price went up to Rs 125? He would then have to spend Rs 1,250 (Rs 125 per share x 10) to buy back the shares that he owes to the brokerage. He gets to keep the Rs 1,000 he earned from selling the shares initially. But, he has lost Rs 250 in this scenario.

How to Short Futures?

One could also short a stock in the futures segment. In the Indian stock markets, if you want to hold a short position for more than a day, the easiest way is to short a future. Futures represent an agreement to buy or sell a specific quantity of a stock at a set price on a specified date in the future. It derives its value from the actual stock. If the underlying value (stock price) is going down, so would the futures. 

If you have a bearish view on a stock, you can initiate a short position on its futures and hold on to the position overnight. Similar to depositing a margin while initiating a long position, entering a short position would also require a margin deposit. 

What are the Advantages of Short Selling?

  • Traders would be able to make significant profits if their predictions become true. It helps you make money in falling (or bearish) markets.
  • Short selling can be used to hedge against any downside risks associated with a stock. Traders can use this method to secure their long-term positions in the market and reduce losses.

What are the Disadvantages of Short Selling?

  • As mentioned earlier, if the trader’s prediction fails, they are exposed to infinite risk. We would recommend that you stay away from short selling if you are new to trading.
  • In short selling, a trader would have to borrow shares from a broker. There is an interest levied on these borrowed stocks, and the trader also has to maintain a margin. If the margin is not maintained, the trader might need to increase funding or liquidate (exit) their position.
  • Timing is a very important aspect of short selling. If a trader shorts stocks long before the prices drop, they would have to bear the costs associated with short selling for a longer period. If a trader shorts a stock late, they would not be able to catch the fall that was initially predicted.
  • Traders who short stocks could be prone to a short squeeze. This is a situation wherein highly shorted stocks are targeted by certain investors. They would buy these stocks and drive up their prices. Thus, the short sellers would make huge losses when this happens. This is what happened with GameStop, AMC shares in the US. You can read more about it here.

What are the Risks of Short Selling?

A few of the risks of short selling are:

1. Potential for Unlimited Losses

2. Margin Calls – A margin call is a demand from a broker for an investor/trader to deposit additional funds to cover potential losses in their account.

3. Limited Availability of Borrowed Shares

4. Regulatory Restrictions and Market Manipulation

5. Squeeze Risk

6. Timing Risk

Long Position vs Short Position

  • A long position means that the investor has bought the shares and is expecting the price to go up. 
  • A short position means that the investor has short-sold a share and is expecting the prices to fall.
  • A long position makes a profit when the price rises while a short position makes a profit when the price falls.

Regulations for Short Selling in India

In order to short stocks, traders need to have a margin account through which they can borrow stocks from a broker. They would need to maintain the margin amount in that account to continue or retain a short position. This margin acts as a security deposit with your broker.

Traders can place a Margin Intraday Square (MIS) order for short selling. This means that selling and buying the stock (short selling) happens during the market hours (9:15 am to 3:30 pm). Brokers will automatically square off your short position towards the end of market hours.

The Securities and Exchange Board of India (SEBI) allows traders to short-sell securities only in intraday trade. The entire process of short selling has to take place within the same day. Due to the Covid-19 pandemic and the negative sentiments surrounding it, global markets crashed in March-April 2020. In order to stabilise markets, SEBI imposed a temporary ban on short selling and increased margin requirements. This ban was lifted in November 2020.

Categories
Jargons

How to Analyse Debt and Valuation of a Company?

We often come across a lot of different financial ratios with complex names and become confused about the kinds of metrics to use when analyzing different companies listed in the stock market. In this article, we will discuss how to analyse the debt and valuation of a company (by using Tata Steel as an example).

Understanding Debt and Valuation

Debt refers to the total amount of money that a company owes to external creditors or lenders. It can arise from various sources, including loans, bonds, lines of credit, and other forms of borrowing. When a company borrows money, it agrees to repay the borrowed funds over time, often with interest. Companies take in debt for financing operations, expanding their business, investing in new projects, acquiring assets, or managing cash flow fluctuations. Debt can be an important tool for companies to raise capital and achieve their growth objectives. However, it also comes with the responsibility of making regular interest payments and eventually repaying the principal amount borrowed.

Meanwhile, valuation means finding the real worth of a company. Market participants use it to determine the price they are willing to pay or accept when selling a business. Thus, value investing is based on the true value of a business compared to its market value.

  • The market value of a business is the worth that the market assigns to it. To calculate the market value of a publicly traded company, multiply its share price by the number of outstanding shares.
  • Intrinsic value is the true and accurate worth of a company. It is the anticipated or calculated value determined through fundamental analysis.
  • If the market value of a company is higher than its intrinsic value, then the stock is currently overpriced or overvalued. On the other hand, if the intrinsic value of a company is lower than its market value, then the company is undervalued.

Debt Analysis Ratios (Leverage Ratios)

For a company, debt (leverage) is like a double-edged sword. They can scale their business and improve sales with the help of debt funds. However, if not used wisely, the interest to be paid for these borrowings can eat up the company’s profits. It could also lead to a crunch in the cash reserved for future operations.

The following are the different types of leverage ratios:

1. Debt-to-Equity Ratio

Equity is the value attributable to the shareholders of a company. It is calculated by subtracting liabilities from the value of the assets. The debt-to-equity ratio tells us how much borrowings are present in a company compared to its equity.

Debt-to-Equity Ratio = Total Debt/Total Equity

We can find the total equity of a company in its balance sheet. By adding the borrowings from the current and non-current liabilities, we get debt. For Tata Steel, the ratio stood at 0.76X  in FY23, which means that for every ₹1 equity in the company, there exists ₹0.76 as debt. A higher Debt-to-Equity ratio indicates a higher amount of debt compared to equity.

debt to equity ratio analysis of tata steel, jsw steel, jindal steel

From the graph shown above, we can conclude that Tata Steel has been able to reduce its debts, although it has increased slightly this year. The company’s Debt-to-Equity ratio is also aligned with the industry average. We can also conclude that the steel sector is capital-intensive, and each manufacturer has to raise funds through debt to conduct its operations. 

2. Interest Coverage Ratio

The interest coverage ratio helps us to know how much the company can earn with respect to its interest payment. It is also known as the debt service coverage ratio.

Interest Coverage Ratio = Earnings Before Interest & Tax (EBIT) / Finance Cost

To calculate EBIT, we add Finance Cost (listed as an expense) to the Profit Before Tax (PBT). For Tata Steel, the Interest Coverage Ratio stands at 5.29, which means for every ₹1 paid as interest, the company can generate ₹2.29 as revenue. A decreasing interest coverage ratio tells us that the company does not generate enough revenue to service its debt.

interest coverage ratio of tata steel, jsw steel, and jindal steel

In the graph above, Tata Steel’s interest coverage ratio was higher than peers in FY22 but fell to the industry average in FY23.

Valuation Ratios

As stock market investors, it is always ideal to buy shares of a company when it has a cheaper valuation. Valuation is the process of determining the true value of an asset or company. For example, the real estate prices of a particular plot surge when there is an announcement of a new township or tourism project. The ones who bought the plot earlier at a cheaper rate tend to enjoy the higher valuation of the property. 

Similarly, investors can measure the valuation of each stock they invest in.

1. Price-to-Earnings (P/E) Ratio

The Price-earnings ratio gives you an insight into how much the stock market participants are willing to pay for the stock for every ₹1 profit generated by the company.

Price-to-Earnings Ratio = Current Market Price/Earnings Per Share (EPS)

To calculate EPS, we divide the net profit of a firm by the total number of its shares. Tata Steel’s P/E stands at 14.57, meaning that for every ₹1 profit generated by the company, investors are ready to pay ₹14.57.

price to earnings (p/e) ratio of tata steel, jsw steel, and jindal steel

Tata Steel is slightly undervalued compared to peer companies. Meanwhile, JSW Steel is valued at a P/E of 39.89, making it a more expensive option. 

Every industry/sector has a different range of valuation. Thus, we cannot define a standard P/E range for all stocks. Therefore, we must compare the valuation to its industry averages.

2. Price to Sales (P/S) Ratio

We used Earnings Per Share (EPS) for calculating the P/E ratio. However, changes in tax slabs, new accounting rules, one-time payments, etc. can influence EPS. To overcome this, we can consider the total sales of a company to find its valuation. A low price-to-sales ratio (P/S) means that the company is relatively undervalued.

Price-to-Sales (P/S) ratio = Current Market Price/ Sales Per Share

To calculate Price-to-Sales ratio, we divide a company’s revenue from operations by the total number of shares. The P/S of Tata Steel stands at 0.52, which means that for every ₹1 earned as revenue, the company’s investors value it 0.52 times.

price to sales (P/s) ratio of tata steel, jsw steel, and jindal steel

Tata Steel has a low P/S ratio.

3. Price to Book (P/B) Ratio

Suppose a company ends its operations after liquidating assets and settling all debts. Any final amount remaining within the firm has to be distributed amongst its investors. This amount is known as the book value of a company. 

The sum of the total equity and cash reserve from a company’s balance sheet is its book value. By dividing the book value by the total number of shares, we get the book value per share.

Price to Book Ratio = Current Market Price/Book Value Per Share

For Tata Steel, the P/B ratio stands at 1.24, meaning that the stock is trading at 1.24 times its book value.

price to book (p/b) ratio of tata steel, jsw steel, and jindal steel

Here, JSW Steel has a P/B ratio of 3.15, which means it has a higher valuation. Conservative investors can consider stocks whose P/B ratio is close to 1. For modern and asset-light businesses, P/B will always be on the higher side.

Using Debt and Valuation Analysis for Investing

In the world of finance and investment, making informed decisions is key to success. Two essential tools that play an important role in this process are debt analysis and valuation analysis. Let’s explore why these tools are vital for investors seeking to make smart investment choices:

  • Risk Mitigation: Debt analysis allows investors to assess a company’s financial health by examining its debt levels. This helps in understanding the risk associated with an investment. High debt can be a red flag, indicating potential financial distress, while low or manageable debt levels can instil confidence in an investment’s stability.
  • Valuation Analysis: It involves estimating the intrinsic value of an asset or company. By comparing this value to the current market price, investors can determine whether an investment is overvalued or undervalued. Making decisions based on valuation analysis can prevent overpaying for assets and enhance long-term returns.
  • Portfolio Diversification: Understanding the debt and valuation metrics of different investments enables investors to build a diversified portfolio. A well-diversified portfolio spreads risk, reducing the impact of poor-performing assets and increasing the potential for overall returns.
  • Long-Term Success: Debt and valuation analysis provide the foundation for a disciplined investment strategy that considers both short-term fluctuations and long-term growth prospects.
  • Finding Opportunities: Valuation analysis can uncover undervalued assets or companies with growth potential. These opportunities might not be apparent without a systematic assessment of valuation metrics.
  • Enhanced Returns: Making investments based on thorough analysis can lead to improved returns over time. By buying undervalued assets and avoiding overvalued ones, investors increase their chances of profiting from market inefficiencies.

Limitations of Debt and Valuation Analysis

While debt and valuation analysis are valuable tools for investors, it’s essential to acknowledge their limitations to make well-rounded investment decisions. Here are some key limitations to consider:

  • Incomplete Information: Financial statements can sometimes lack crucial information, and companies may use accounting methods that make their financial health appear better than it actually is. This can lead to inaccuracies in debt and valuation analysis.
  • Market Sentiment: Market sentiment and investor behaviour can heavily influence stock prices and valuations. These factors may not always align with a company’s fundamentals, making it challenging to predict short-term market movements.
  • Economic Factors: Economic conditions (such as recessions or economic booms) can significantly impact the performance of companies and their debt obligations. Debt analysis may not fully account for these external factors.
  • Industry Specifics: Different industries have varying debt norms and valuation metrics. What’s considered acceptable in one industry might not apply to another. Ignoring industry-specific dynamics can lead to inaccurate conclusions.
  • Future Uncertainty: Debt and valuation analysis rely on historical data and assumptions about the future. Unexpected events, changes in market conditions, or shifts in a company’s strategy can disrupt these assumptions and render analyses obsolete.
  • Limited Scope: Debt and valuation analysis often focus on quantitative aspects, overlooking qualitative factors like company management, industry trends, and competitive dynamics. These qualitative factors can significantly impact a company’s performance.

Note: Never try to analyse a company with only one kind of ratio. Using multiple ratios and comparing them with metrics of peer players across a specific time period will give us a comprehensive insight into a company.

Categories
Jargons

10 Economic Data to Look Out for Every Month

At the beginning of every month, government agencies or various institutions release key economic data that indicates the performance of our overall economy. Analysing these data sets can help us make informed decisions and become intelligent stock market participants. In this article, we shall discuss the top 10 economic data/indicators that you can track and analyse every month.

1. Gross Domestic Product (GDP)

Released by: National Statistical Office (NSO)

GDP stands for Gross Domestic Product. It is a key economic indicator that represents the total monetary value of all goods and services produced within a country’s borders during a specific period. It is typically measured on a quarterly or annual basis. GDP is used to assess and quantify the economic performance and health of a country.

GDP is a critical metric for policymakers, economists, and investors as it provides insights into the overall economic activity, growth, and standard of living in a country. However, it’s important to note that GDP alone does not capture the entire economic well-being or societal progress, as it does not consider factors like income distribution, environmental impacts, or the overall quality of life.

2. Employment Data

Released by: Ministry of Statistics and Program Implementation (MoSPI)

Employment and unemployment data are other essential economic indicators. This data helps us understand the health of the labour market and the overall economic conditions in a country. It shows the number of people currently employed and actively seeking employment. It also shows the number of people unable to fund jobs although willing to work.

The total labour force consists of all employed and unemployed people in an economy. The unemployment rate shows the economy’s spare capacity and unused resources. Moreover, unemployment tends to be cyclical and decreases when the economy expands. When the economy expands, companies employ more employees to meet growing demand.

Check out MoSPI’s official website here.

3. Consumer Price Index (CPI)

Released by: Ministry of Statistics and Program Implementation (MoSPI)

The Consumer Price Index (CPI) measures the changes in the retail price level of general goods and services. These are goods that our Indian households buy for their daily consumption needs. CPI is also helpful in understanding the real value of wages, salaries, and pensions, and the purchasing power of a country’s currency.

Typically, CPI shows inflation in the economy. An increase in CPI indicates that prices of essential retail goods are surging. The Reserve Bank of India (RBI) currently uses the Consumer Price Index as the key measure of inflation to set the monetary and credit policy.

4. Wholesale Price Index (WPI)

Released by: Ministry of Commerce and Industry

The Wholesale Price Index (WPI) measures the changes in the price of goods sold and traded in bulk by wholesale businesses to other businesses. In simple terms, WPI is a measure of the wholesale price movements in the country. It includes only the prices of goods and does not include any items related to services.

If the index keeps rising every month, it means that prices of goods are getting inflated at the wholesale level. This may lead to an increase in input costs for manufacturing companies, thus cutting short profit margins.

5. Interest Rates

Released by: Reserve Bank of India (RBI)

The repo rate is the interest rate at which a central bank lends money to commercial banks for short periods. This rate influences borrowing costs, consumer spending, and business investment. When repo rates are lower, loans become cheaper, stimulating economic growth through increased spending and investment.

Central banks adjust the repo rate to control inflation. They raise it to reduce borrowing and spending during economic overheating, which can also impact exchange rates, attracting foreign investment with higher rates. These changes in the repo rate can also influence other interest rates, such as the prime lending rates.

Moreover, the repo rate has an impact on the stock market. Lower rates make equities more appealing to investors. Monitoring the repo rate provides valuable insights into the economy’s state and outlook, guiding decisions for businesses, investors, and policymakers

6. Goods & Services Tax Collection Report

Released by: Ministry of Finance

Both Central and state governments levy taxes on the goods and services sold in India. We have the Central GST (CGST) and State GST (SGST). At the beginning of each month, the ministry publishes the aggregate and state-wise GST collection report.

We can interpret how the overall economy is performing while comparing the GST collection reports to those of the previous months. An increase in GST collection depicts that consumers are spending more money which, in turn, helps the economy and related companies.

7. Purchasing Manager’s Index (PMI)

Released by: S&P Global

Released on: The first week of every month.

PMI measures the industrial activity of a country. It gives us a preview of manufacturing activities before the actual industrial data is released. To calculate the index, IHS Markit selects purchasing managers and business executives of specific companies to answer a set of questions on business, employment, and inventories. Based on their answers, a scale ranging from 0 to 100 is calculated. PMI is calculated for both the manufacturing and services sectors.

A PMI above 50 represents an expansionary phase in the corresponding sector. If the PMI value is greater than that of the previous month, it signifies that the economy is improving over time. Similarly, a PMI below 50 represents a contraction in the corresponding sector.

8. Forex Reserves

Released by: Reserve Bank of India (RBI)

Forex reserves are like a country’s savings account in foreign currencies. They show how financially strong and stable the country is. Having enough reserves helps keep the value of its money steady and ensures smooth international transactions. These reserves are essential for paying for imports and foreign debts without causing economic strain. When a country has ample reserves, it gives confidence to investors and international markets, attracting more investments and protecting against financial troubles.

Forex reserves also allow the country’s central bank to intervene in currency markets, stabilising the value of its money and preventing sudden changes.

9. Auto Sales

Released by: Every automobile manufacturer in India.

Every auto manufacturer operating in India has to report its monthly sales figures.

Analysis: We can compare the sales figures with that of the previous month as well as year-on-year (YoY) data to interpret the demand for vehicles. If overall sales have declined heavily, we can consider it as a bearish phase for auto manufacturers and auto ancillary companies, as their businesses have declined.

10. Foreign Exchange Rate

Released by: Reserve Bank of India (RBI)

RBI quotes the rate of the Indian Rupee (INR) to foreign currencies (mainly the US Dollar) daily.

At the beginning of every month, we can find out whether INR has become stronger or weaker. If the Indian Rupee is getting weaker every month, it is beneficial for exporting companies (and IT players as well), as they will be able to generate more revenue. Whereas, if the Rupee is getting stronger, manufacturers who import raw materials (crude oil, metals, minerals) only need to exchange fewer currencies compared to the previous month, which decreases their expenses.

Impact of Economic Data on the Stock Market

Economic data can have a significant impact on the stock market. Investors and traders use this information to measure the health and prospects of the economy and individual companies. Here’s how each of the above-mentioned economic data points can influence the stock market:

GDP

GDP growth reflects the overall health of the economy. Positive GDP growth is generally associated with increased corporate earnings and can drive stock market appreciation.

Employment Data

Positive employment data signals a strong job market and increased consumer spending, potentially leading to higher stock prices. Conversely, rising unemployment may result in market uncertainty.

WPI and CPI

Inflation data affects purchasing power and corporate profitability. High inflation can lead to uncertainty in the market and impact stock prices.

Interest Rates (Repo Rate)

Central bank interest rate decisions influence borrowing costs and investment decisions. Lower interest rates can stimulate borrowing and spending, positively affecting stocks.

Goods and Services Tax (GST)

Changes in GST rates can impact consumer spending and corporate earnings, influencing stock prices in sectors affected by these changes.

Purchasing Managers’ Index (PMI)

PMI measures the health of the manufacturing sector. A PMI above 50 indicates expansion, which can boost investor confidence and drive stock market growth.

Forex Reserves

High forex reserves indicate a stable economy and may boost investor confidence in the country’s financial markets, attracting foreign investment and potentially leading to higher stock prices.

Foreign Exchange Rate

A strong domestic currency relative to foreign currencies can impact exports and the profitability of multinational companies. A weaker currency can benefit exporters and certain industries, potentially leading to stock market gains.

Auto Sales

Strong auto sales indicate consumer spending and economic activity. Positive auto sales data may signal a healthy economy and potential stock market gains, particularly for automobile-related companies.

In conclusion, economic data acts as a barometer for a country’s overall health. It can influence investor sentiment, corporate earnings, and market trends. Investors closely monitor these data points to make informed decisions and adjust their stock market strategies accordingly.

Categories
Jargons

What are the Key Ratios Related to Life Insurance?

Life insurance serves as a vital tool in safeguarding your family’s financial well-being when you’re not around. In this article, we will explore the concept of life insurance in detail. We’ll also take a closer look at some key ratios related to life insurance. These ratios help us understand the financial strength of insurance companies and evaluate their operations in a more refined manner.

What is Life Insurance?

Life insurance is a contract between an insurer (insurance company) and the insured (policyholder). When the insured person passes away, the insurer pays a sum of money to one or more named beneficiaries of the insured person. The policyholder has to pay insurance premiums during their lifetime. You can pay the insurance premiums upfront as a lump sum or in recurring payments over time, usually monthly and yearly.

Types of Life Insurance Policies

The two most common types of life insurance policies are:

1. Term Life Insurance Policy

Term Insurance is a type of life insurance that provides financial protection for a fixed period of time. If the policyholder suddenly passes away during this period, their family members (or nominees) will receive a death benefit. Term insurance is a relatively low-cost way to ensure your family’s financial security if something were to happen to you.

A 20-year-old healthy individual can secure a cover of up to ₹1 crore for his dependents for the next 25+ years if he pays a fixed, minimal amount (even less than ₹500) every month to a reputable insurance company. However, unlike whole life insurance, term insurance does not provide maturity benefits. The insurance company will not pay a lump-sum amount when your term insurance policy matures.

2. Permanent Life Insurance Policy

A Permanent Life Insurance Policy offers coverage for your entire lifetime, as long as you continue to pay the premiums. When you purchase a permanent life insurance policy, a portion of your premium payments go toward the cost of insurance, while the remaining portion is invested by the insurance company. Over time, the cash value of your policy grows, and you can access this cash value through policy loans or withdrawals while you’re alive. It provides a death benefit to your beneficiaries when you pass away.

Key Ratios Related to Life Insurance

A life insurance policy is only as good as the financial strength of an insurer. You can use the following key ratios to analyse the financial strength of an insurance company.

1. Persistency Ratio

This ratio helps you understand how persistent customers have been in renewing their coverage year after year. This tells about its customers’ loyalty and whether they have been paying their premium without default. We can judge if the company has been delivering product quality over the years using this metric. It is measured at regular intervals like the 13th month, 25th month, 37th month and 61st month. A higher persistency ratio of any company tells you that it has been able to contain a large pool of satisfied clients.

We calculate Persistency Ratio as the ratio of the number of total policies sold to the number of policies renewed at a given time. The closer the ratio is to 1, the better. The persistency ratio will never be lower than 1.

persistency ratio formula

For example, if a company issues 100 policies, but only 80 of those policies get renewed, then the persistency ratio will be 100:80.

2. Claim Settlement Ratio

Claim Settlement Ratio is one of the most important ratios that one should look into before buying insurance. It tells what percentage of the total claims filed by the customers have been settled by the organisation. People prefer insurance companies that settle claims quickly and pay out the benefits, rather than those that take a long time to do so. The higher the claim settlement ratio, the better.

claim settlement ratio formula

The claim settlement ratio is typically calculated on a yearly basis.

3. Solvency Ratio

Solvency Ratio tells whether an insurance company has the money to settle all claims at liquidation. According to the Insurance Regulatory and Development Authority of India (IRDAI), every insurance entity needs to maintain a minimum solvency margin of 1.5 or 150%. Higher solvency ratios indicate more capability of paying insurance claims during uncertain times which gives more confidence to an insured person.

solvency ratio formula

4. Loss Ratio

Loss Ratio is a measurement of a company’s loss during a certain year. It shows the total amount of claims dispensed as a percentage of the total premium earned in that year. An increasing loss ratio tells that the company is in a situation of disbursing more payments, but is not able to earn premiums at a similarly high rate. Thus, a higher loss ratio indicates financial trouble for the company.

loss ratio formula

5. Expense Ratio

In the insurance Industry, the expense ratio is a profitability measure. It is calculated by dividing the expenses associated with acquiring, underwriting, and servicing premiums by the net premium earned. The expenses can include advertising, employee wages, and commissions for the sales force. The expense ratio signifies an insurance company’s efficiency before factoring in claims on its policies and investment gains or losses. It offers a clear view of how well an insurer manages its overheads and operational costs in relation to the revenue generated from premiums.

expense ratio

6. Combined Ratio

The combined ratio is also a measure of profitability to measure an insurer’s performance in its daily operations. It is calculated by taking the sum of incurred losses and expenses and then dividing them by the earned premium. The combined ratio measures the money flowing out of an insurance company as dividends, expenses and losses. Losses indicate the insurer’s discipline in underwriting policies. A ratio below 100% indicates that the company is making an underwriting profit, while a ratio above 100% means that it is paying out more money in claims than premium receipts.

combined ratio

7. Investment Yield Ratio

This ratio measures the average return on the company’s invested assets before and after capital gains and losses. Both realized and unrealized capital gains are considered while calculating the investment yield (including capital gains).

investment yield ratio

8. Premium Growth Ratio

The premium growth ratio indicates growth in the business undertaken by the insurance company. This ratio is calculated by dividing the difference between the gross premium written (GPW) in the current and previous years by the GPW in the previous year. [GPW is the total amount of premiums an insurance company receives from policyholders for their insurance policies. It’s like the total bill customers pay to the insurance company for coverage.]

premium growth ratio

In conclusion, key ratios related to life insurance offer valuable insights into the financial health, risk management practices, and overall performance of life insurance companies. From the solvency ratio that assesses an insurer’s stability to the expense and loss ratios that reveal its operational efficiency and claims handling capabilities, these metrics serve as vital tools for making informed decisions in the complex world of life insurance.

Categories
Jargons

What are Depositories?

Have you ever wondered where the the shares you own/bought are stored? Just like a bank holds your funds, an institution called a depository keeps shares and other securities safe. In this article, we will understand what a depository is, its different types, functions, and its role in the financial markets. Additionally, we will understand a few concepts and topics related to depositories.

What are Depositories?

Depositories are institutions that hold your shares and other securities in an electronic or dematerialised (Demat) form. Brokers are privately owned companies, and entrusting them with your equity shares and other assets is risky. There exists a possibility of brokers engaging in unethical activities using your securities. Depositories exist to prevent such a risk.

A depository acts as a custodian of Demat accounts and shares. Depository participants open Demat accounts, serving as intermediaries between investors and the depository. One can store shares, exchange traded funds (ETFs,) bonds, debentures, certificates of deposits, Government Securities (GSecs), and much more in a depository.

What is Dematerialisation?

Dematerialisation is the process of converting physical paper securities (such as share certificates, bonds, and other financial instruments) into electronic or digital form. In other words, it involves the transformation of tangible paper-based assets into electronic records.

Depositories in India

In India, there are two depositories:

1. National Securities Depositories Ltd (NSDL)

NSDL is the oldest and largest depository in India. It came into existence through the Depositories Act of 1996 and commenced operations in 1996. It was the first depository to provide trading services in electronic format. According to the Securities & Exchange Board of India (SEBI), NSDL has around 2.4 crore active investors, with more than 36,123 depository participant service centres across 2,000 cities. 

2. Central Depository Services Ltd (CDSL)

Established in 1999 in Mumbai, CDSL is the second-largest depository in our country after NSDL. It provides services like holding financial securities in the electronic format and facilitating trade and settlement of orders. This depository holds all types of stocks and securities. According to SEBI, CDSL has more than 5.2 crore active customer accounts with around 21,434 depository participant service centres.

In India, every broker must register with at least one of the two depositories. Brokers like Zerodha and Upstox are registered with CDSL, while Sharekhan and Kotak Securities are registered with both NSDL and CDSL. Each broker has a unique ‘DP number’ from the depository they are registered with. Some brokers are DPs at both NSDL and CDSL.

Functions of Depositories

1. Custodian

Depositories act as a custodian for your securities. It securely holds and safeguards securities, including stocks, bonds, mutual funds, and other financial instruments, on behalf of investors. This eliminates the need for physical possession of paper certificates and reduces the risk of loss, theft, or damage.

2. Dematerialisation

Dematerialisation is the process of converting financial securities in physical form into electronic format or demat form. Depositories perform dematerialisation. This conversion simplifies the process of transferring ownership and eliminates the need for physical delivery.

3. Immobilisation

Depositories immobilize physical securities, making them no longer transferable through physical means. Instead, ownership is electronically transferred, improving both security and efficiency.

4. Book-Entry System

Depositories maintain electronic records of securities ownership. They act as intermediaries in the transfer of securities between buyers and sellers. Depositories update their records to reflect changes in ownership after each transaction. This enables the seamless transfer of ownership between buyers and sellers. This book-entry system eliminates the need for physical record-keeping and reduces paperwork.

5. Settlement Services

Depositories facilitate the settlement of securities transactions by ensuring that securities are transferred from sellers to buyers and that payment is made to the sellers. This reduces settlement risks and delays.

6. Ownership Transfer Facilitation

Depositories have facilities for transferring securities from one account to another. This is especially important in the case of unlisted securities. Since unlisted securities are not publicly traded, they cannot be sold in the open market like public securities.

CDSL provides Easi/Easiest Portal to transfer securities manually.

7. Corporate action processing

Depositories process corporate actions such as dividends, stock splits, mergers, and rights issues. They ensure that shareholders receive the benefits or instructions associated with these actions.

8. Facilitation of Trading

Depositories make it easier for investors to buy and sell securities. When investors trade on stock exchanges or in over-the-counter (OTC) markets, depositories handle the transfer of ownership behind the scenes, ensuring a smooth transaction process.

9. Reduction in Settlement Risks

By providing a centralised system for settlement and record-keeping, depositories reduce the risk of settlement failures, errors, and discrepancies.

10. Proxy Voting

Some depositories offer proxy voting services. Proxy voting refers to the vote cast by one person or firm on behalf of another.

What is a Book Entry System?

Book entry is a method of electronically tracking ownership of securities, eliminating the need for physical certificates to be issued to investors. This allows investors to trade or transfer securities without having to present a paper certificate as proof of ownership. When an investor purchases a security, they receive a receipt and the information is stored electronically.

Depository vs Clearinghouse

A Depository is a facility that holds and maintains records of securities in demat form. A Clearing House is responsible for validating, clearing, and settling trades executed on a stock exchange or other trading platform.

Who are Depository Participants (DPs)?

Although Depositories are the custodian of securities, investors cannot directly interact with them. It can only be done through a depository participant (DP). The DP acts as an intermediary between the depository and investors. It’s a depository participant who opens a Demat account with a depository.

In India, most of the brokers themselves are the Depository Participants

What are Depository Receipts (DRs)?

A Depository Receipt (DR) represents ownership in a foreign company. It’s a security that trades like an ordinary share on a local exchange. This means that publicly listed shares of a foreign company can be traded on an exchange outside its home market. To create a depository receipt, the equity shares of the foreign company are deposited in a bank (which serves as the depository) in the country where the shares will be traded. Subsequently, the depository issues receipts that represent the deposited shares.

Global Depository Receipts (GDRs)

Companies issue global depository receipts (GDRs) outside their home country and beyond the United States. The depository bank that issues GDRs is generally located (or has branches) in the countries on whose exchanges the shares are traded. A key advantage of GDRs is their exemption from foreign ownership and capital flow restrictions that the issuing company’s home country might impose since they are sold beyond its borders.

American Depository Receipts (ADRs)

An American depository receipt (ADR) is a US dollar-denominated security that trades like a common share on US exchanges. They enable foreign companies to raise capital from US investors. Note: An ADR is one form of a GDR. However, not all GDRs are ADRs because GDRs cannot be publicly traded in the United States. 

Role of Depositories in Capital Markets

Depositories play a crucial role in capital markets and investment infrastructure. They provide essential services that facilitate the efficient and secure functioning of the financial markets. Their role includes various aspects of the financial system, including securities trading, settlement, and investor protection. Depositories streamline the process of holding and trading securities, enhance transparency, reduce risks, and provide valuable services to investors, issuers, and other market participants. Their role is essential in promoting market integrity and investor confidence.

Categories
Jargons

What are Blue Chip Stocks?

You may have come across many social media posts or videos of stock market experts encouraging everyone to invest in blue chip stocks. Whether you’re a beginner or an experienced investor, it’s always a good idea to hold blue chip stocks in your investment portfolio. In this article, we will discuss what blue-chip stocks are, their characteristics, and a few related topics.

What are Blue Chip Stocks?

Blue-chip stocks are shares of well-established, financially stable, and reputable companies that have a history of delivering consistent performance. These companies are typically leaders in their respective industries. The term “blue chip” was originally derived from poker, where blue chips have the highest value.

Blue Chip companies are also known for paying out regular dividends to their shareholders over time. Most of them generate stable returns for investors and are known to have much lower downside risk in times of recessions, inflation, and economic downturns.

For example, State Bank of India (SBI) is a blue-chip public sector banking company.

Characteristics of Blue Chip Stocks

Blue-chip stocks are known for their reliability and stability in the stock market. They are so reliable that these stocks have a considerably high weightage in stock market indices. Here are some of the characteristics of blue-chip stocks:

1. Financial Stability

Blue-chip companies are financially strong and reliable. They have healthy balance sheets, stable revenue streams, and strong cash flows. This makes them less likely to face financial distress or bankruptcy.

2. Market Leaders or Dominants

Blue-chip companies are often leaders in their respective industries or sectors. They have a dominant market position and a competitive advantage over their rivals.

For eg, HDFC Bank is a leader in the banking sector, while TCS and Infosys are leaders in the Information Technology (IT) Sector.

3. Longevity

Bluechip companies have a history of operating successfully for many years, sometimes even for decades or centuries. These companies have demonstrated their ability to adapt to changing market conditions, including recessions.

4. Dividend Payments

Since blue-chip companies are financially strong and have stable cashflows, they usually pay regular dividends. Therefore, blue chip stocks can create a passive income stream for investors.

5. Low Volatility

Volatility refers to the rate at which the price of a stock increases and decreases. High volatility represents high risk. Blue chip stocks tend to have low volatility and are considered low-risk investments. They are less prone to sharp price fluctuations in the market.

6. Large Market Capitalisation

A company’s market capitalisation is used to evaluate and rank its size and value in the stock market. Blue-chip companies have a high market cap. You can calculate the market cap of a company by multiplying its current stock price by the number of outstanding shares.

7. Brand Value

The majority of the blue-chip companies have well-known brands and distinguished products. Customers typically choose products with more brand value than those with none. For eg, ITC Ltd and Hindustan Unilever Ltd operate FMCG brands that are preferred by many customers across India.

8. Global Operations

Many blue-chip companies have a global footprint. They conduct business and generate revenue from various regions around the world. This global diversification can help mitigate risks associated with regional economic fluctuations.

9. Resilience in Economic Downturns

Blue-chip companies can withstand recessions and economic downturns. Although the business of these companies will be affected, it will not be as severe as that of smaller companies. Their financial strength and brand value contribute heavily to this characteristic.

Long-Term Growth Potential

Blue chip stocks are considered safe investments due to their exceptionally strong financial health and stability. They may have survived difficult challenges and market cycles over the years. These companies are market leaders and well-positioned in the market. Although they will be stable, they might not have the potential to provide investors with multibagger returns as they are already established companies.

However, this does not mean that blue-chip companies will never fail. The collapse of Lehman Brothers and General Motors in the 2008 Economic Recession is proof that even the seemingly strongest companies might fail under extreme stress.

Blue Chip Companies in India

Some well-known examples of blue-chip stocks include:

  1. Reliance Industries – India’s largest business group; has interests in energy, petrochemicals, natural gas, retail, telecom, mass media, and financial services.
  2. Tata Consultancy Services (TCS) – A multinational information technology services and consulting company.
  3. HDFC Bank – India’s largest private sector bank.
  4. Infosys Ltd – A multinational information technology company.
  5. Hindustan Unilever Ltd – A British-owned Indian consumer goods company.
  6. Coal India – A central public sector undertaking under the ownership of the Indian Govt’s Ministry of Coal.
  7. Wipro Ltd – A multinational corporation that provides information technology, consultant and business process services.
  8. Maruti Suzuki – Market leader in India’s passenger vehicles segment.

Blue Chip Stocks vs. Growth Stocks

Blue-Chip StocksGrowth Stocks
Shows stability and resilience during economic crisisHigh growth potential
Market leadership and dominanceLow market share (the company is in the growth stage)
Diversified revenue streamsMay only have a single line of products
Regular dividendsLimited or no dividends
Strong financial performanceFinancials may be focused on development and not stability
Long investment horizonShort investment horizon

Why Invest in Blue-Chip stocks?

The stock market can be volatile it can unexpectedly show some drastic movements in either direction. Thus, it is advisable to invest a decent portion of your capital in blue-chip stocks. A few of the reasons why you should invest in blue-chip stocks are given below:

  • Helps in reducing risk because blue chip firms endure economic downturns. 
  • Can create a passive income source as most blue-chip stocks pay dividends regularly.
  • They help diversify your portfolio by reducing risk.
  • The unsystematic risk (risks affecting a whole sector) in these stocks is very low.
  • They can give very high returns during favourable economic conditions.
  • As these stocks are well-known to people, liquidity in these stocks is very high. That means they can be bought and sold whenever you want at a fair price.
  • Blue-chip stocks are a robust and safe pick for long-term investment.

Evaluating Blue Chip Stocks

Evaluating blue chip stocks is similar to how you would analyse any company. One must know fundamental analysis and also the knowledge on how to apply them effectively. The basic framework on how to analyse these companies is as follows:

1. Identify the Stocks – select stocks with high market capitalisation.

2. Understand the Business

3. Ensure Quality

4. Check Valuation

5. Make a Decision

You can read our detailed article on how to identify quality stocks for the long term here.

Blue Chip Indices

In the Indian stock market, the benchmark indices of National Stock Exchange (NSE) and Bombay Stock Exchange (BSE) can be used to evaluate the performance of blue-chip stocks. Nifty50 is the benchmark index of NSE, while Sensex is the benchmark index of BSE.

The Nifty50 constitutes the top 50 companies from various sectors with high market cap listed on the NSE (along with other eligibility criteria). Sensex constitutes one of the top 30 stocks listed on the BSE and has similar selection criteria. You can easily track the performance of blue-chip stocks using these indices.

Blue-chip stocks represent some of the most established and reliable companies in the stock market. They are characterised by financial stability, market leadership, and a history of consistent performance. While they may not provide rapid growth, they are known for their resilience and ability to generate long-term returns. Investing in such stocks can be a wise choice for those seeking stability and income in their investment portfolios.

Categories
Jargons

Options Greeks: What is Theta?

Before you go through this article, we request you to go through the basic terms of Options. You can find it here. If you are learning about options, you have to be thorough with the knowledge of Option Greeks. It helps the trader to know how and why the price of the options changes. So let us learn about what theta is, known as an option seller’s friend and an option buyer’s worst enemy.

We will start this series by explaining one of the most important Option Greeks, which is the Theta or time decaying factor. Both Call and Put options lose value as the expiry date nears. The rate at which they lose value is called Theta. A Theta value of -2 indicates that the option premium will fall by Rs 2 each day which is passed. But why do the options lose value? Let’s find it out here.

Explaining Theta

How important is time? Does time have a cost? If yes, how will you associate a price with time? Before you read forward, take a minute and form your own opinion on these three questions.

Let’s look at an example. Imagine you want to become an established cricketer in the Indian team. How would that happen? You have to put in years of practice and learn many skills. You have to devote your time day in and day out to become a better cricketer. Still, there is no guarantee that if you decide to give 20 hours each day, you will be selected for the national team.

But, you will surely have a better chance of becoming a cricketer if you spend your time upskilling yourself rather than doing absolutely nothing in the field. Thus, the likelihood of you becoming a cricketer directly correlates with the time you put in. Similarly, you will be more confident about an exam if you have more days to study for it. Why? This is because you would feel that you have an ample amount of time to prepare for it. The longer the time for preparation, the more confident you will be.

This same logic is followed in the stock market as well. Suppose Nifty 50 is around 13,500. You have two options contracts among which you can buy anyone. Firstly, Nifty 14,000 Call Option which expires in 2 days. Secondly, Nifty 14,000 Call Option which expires in 20 days. Obviously, you will feel safe and confident in buying the second Call Option. Why? This is because more the time, the better the likelihood for the index to move up. In short, more time to expiry leads you to have a better chance of ending your position in profits.

Risk of an Option Seller

All the conversations we had above were from the perspective of an option buyer. Now, let’s switch our hats to that of Option sellers/writers. As an Options seller, you don’t want the Nifty to cross 14,000 in the above example. If Nifty crosses above 14,000 then you have to pay money to the option buyer. If Nifty remains below 14,000 points, you will get to retain the option premium you received from the buyer.

Out of the two Call Options, in which one do you feel the risk for you as an option seller is higher? Yes, it is the second one which is riskier. Nifty crossing 14,000 points in 2 days has a lower probability than it crossing that mark in 20 days. What do you want to compensate for this risk? Money! This concept in the world of finance is known as Time Risk. Options premium is always the summation of the intrinsic value of your option and the time value involved.

Option Premium = Time value + Intrinsic Value

Hence, one can easily draw a conclusion from this. If you are buying a call option with a farther expiry date, then you are obliged to pay a higher option premium for it. This higher option premium is paid to compensate for the Options Writers’ time risk.

The chart below shows the Nifty option chart with a strike price of 13,700. The expiry date of this Call Option is 31st December 2020. The Option Premium which the buyer has to pay to the writer is Rs 152.50.

The second chart shows the Nifty Call Option with the same strike price but with a farther expiry date. The contract has to be closed on 28th January 2021. The Option Premium which the buyer has to pay to the writer is Rs 381.79. Between the two Call Options with the same price, an option buyer has to pay a higher option premium to the option seller/writer for the contract whose expiry date is farther.

Conclusion

As the option reaches closer to its expiry date, the time risk of the option seller/writer decreases. Due to this, the option premium loses some of its time value. Thus, decreasing the option premium which has to be paid to the option seller/writer.

Theta is considered very difficult to understand. But in reality, it is very easy. Just remember that time has an opportunity cost and that cost is reflected in Theta. Wait for the next chapter of this series to get a better idea of what Options Greeks are. Till then, happy trading!